Principles of spontaneous bedform generation
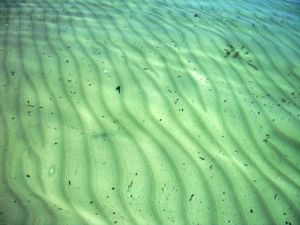
Bedforms generally form spontaneously when water flows over a sandy sediment bed. Processes responsible for the instability of flat sediment beds are discussed in several Coastal Wiki articles listed below under #Related articles. There are several types of seafloor instability, which give rise to the great diversity of bedforms observed in the field. The common denominator of bedform generation processes is the adjustment of the flow field to an initial random disturbance of the seafloor, such that gradients in the corresponding adjusted sediment flux amplify the initial disturbance. A mathematical derivation of bedform generation processes is generally based on the identification of leading nonlinearities in the equations describing the flow adaptation to an infinitesimally small disturbance of the seafloor. This article aims to provide a qualitative and more intuitive understanding of bedform generation processes. The focus is on bedforms with a rhythmic character with crest and trough lines perpendicular to the undisturbed flow, such as bed ripples, subaqueous dunes and tidal sand waves.
Contents
Initiation of bedforms
Once the water flow over a sediment bed is strong enough to set sediment particles in motion, bedforms arise spontaneously on an initially flat sediment bed. The condition for the onset of particle motion is a function of the bed shear stress [math]\tau_b[/math] exerted by the flow on the sediment bed, the median grainsize [math]d_{50}[/math] of the sediment particles and the relative particle density [math]s =\rho_s / \rho[/math] (ratio of particle and water densities ). A fair approximation of this condition (for non-cohesive sediments, [math]d_{50} \gt 100 \mu m[/math]) is given by the Shields parameter [math]\theta[/math], [1]
[math]\theta \equiv \Large\frac{\tau_b}{(s-1) \rho g d_{50}}\normalsize \, \gt \, \theta_c \approx 0.04 \, , \qquad (1)[/math]
where [math]g=[/math] gravitational acceleration. For values of the Shields parameter just above the critical value, only small bedforms, called ripples, are formed. For larger values of [math]\theta[/math], bed ripples evolve into larger bedforms, called dunes (in rivers) and sand waves (in tidal environments). For high values of the Shields parameter, [math]\theta \gt \approx 0.7 [/math], bed ripples are wiped out by sheet flow[2], but the larger bedforms can subsist.
Bedload transport maximum
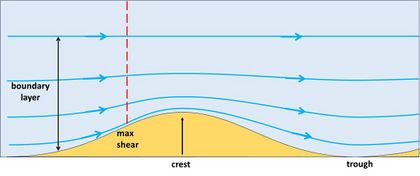
The principle of spontaneous bedform generation is schematically illustrated in a series of figures. Fig. 1 shows a vertical longitudinal section of a smooth 2-dimensional bed perturbation in the form of a small ridge and a shallow trench. A steady flow from left to right adapts to the bed perturbation as shown by the streamlines. The fluid layer near the bottom where the streamlines are deflected by the bed perturbation is called the boundary layer. The bending over the ridge is opposed by the inertia of the flow (inertia is the momentum carried by the flow, a nonlinear effect). The streamlines following the bottom therefore almost collide with the upstream ridge flank. At the location where they come closest to the ridge flank, the sediment experiences the strongest shear stress. This is the location where the capacity of the flow to move sediment along the bottom is greatest.[3][4]
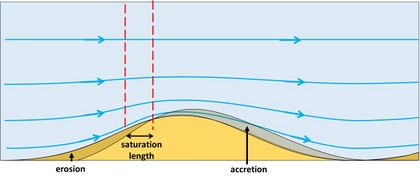
Sediment transport along the bottom by rolling or jumping of sediment grains is called bedload transport. However, it takes a while before the full bedload transport capacity is realized. The location of maximum bedload transport is therefore located a short distance downstream of the location of maximum bed shear stress (Fig. 2) [5]. Before the maximum is reached, the bedload transport increases on the upstream flank of the ridge, by moving an increasing amount of sediment grains. The ridge flank upstream of the location of maximum bedload transport therefore loses sediment and erodes. Downstream of the location of maximum bedload transport, the capacity of the flow to move sediment grains decreases. Sediment grains are therefore left behind, which means accretion of the ridge downstream of the location of maximum bedload transport - the ridge migrates in a downstream direction. If the location of maximum bedload transport is located upstream of the ridge crest, the crest will accrete. In this case, the bed perturbation grows as it migrates downstream. Figures 1 and 2 illustrate the essential principle underlying the spontaneous formation of bedforms in steady flow.
Residual circulation cells
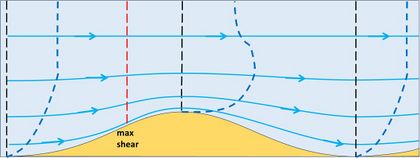
Figure 3 shows the adjusted velocity profiles at the ridge crest and trough. The boundary layer is thinner above the ridge crest than above the trough, implying flow acceleration-deceleration. At the seabed (below the bedload transport layer) the velocity is zero. The fluid mass in the boundary layer is thus bending over, which means that is has a rotational component called vorticity. The near-bed clockwise vorticity is clearly greater at the ridge crest than at the trough. Figure 4 shows the transport of vorticity at the ridge crest and the trough. The boundary layer region from trough to crest experiences loss of clockwise vorticity, while the boundary layer region from crest to trough experiences a gain (a nonlinear second-order effect). The loss of clockwise vorticity in the trough-to-crest region drives a small counterclockwise rotational flow, superimposed on the main flow shown in Fig. 5. The gain of clockwise vorticity in the crest-to-trough region likewise drives a clockwise rotational flow component. These superimposed circulations contribute to moving sediment grains from the trench to the ridge crest.[6]
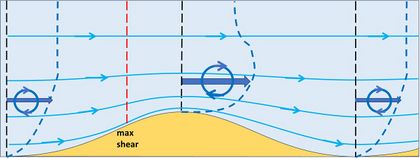 Fig. 4. Transport of vorticity (rotational component of velocity) at the ripple trough and ripple crest. The vorticity balance on the upstream side of the ripple is negative (more clockwise vorticity exits than enters), while the vorticity balance is positive on the downstream side. |
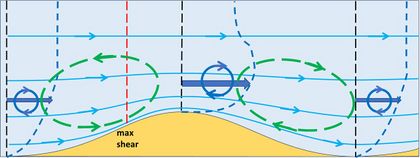 Fig. 5. The negative vorticity balance on the upstream side of the ripple drives a counterclockwise circulation, while the positive balance on the downstream side drives a clockwise circulation. This circulation pattern, superimposed on the steady main flow, contributes to moving sediment particles from the ripple trough to the ripple crest. |
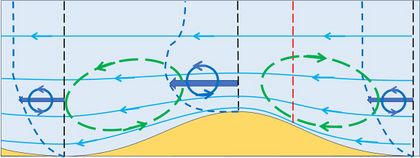
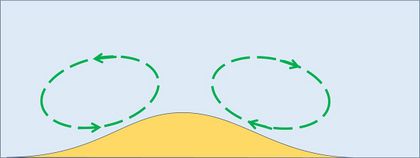
If the main steady flow is reversed (Fig. 6), the resulting adjusted flow pattern is the exact mirror of Fig 5. All flow directions are reversed except the superimposed circulation pattern resulting from the vorticity transport balance. Figure 7 shows the net flow pattern that results from considering successive periods of alternating steady flow. In this case no bedform migration occurs. However, the bed perturbation can grow because the residual circulation pattern in the boundary layer contributes to moving sediment grains from the trench to the ridge.[7][8]
Equating oscillating flow (e.g. horizontal wave orbital flow, or tidal flow) with successive periods of alternating steady flow is not entirely correct. The boundary layer structure in oscillating flow differs from steady flow, primarily because of the time required for a turbulent boundary layer to form after flow reversal. For surface waves, the thickness of the turbulent boundary layer is therefore much smaller than for steady flow. However, mathematical models taking the temporal dynamics of the boundary layer into account yield a residual near-bed circulation pattern similar to Fig. 7. [7][8]
Ripple coarsening in steady flow
Ripples are the first bedforms to arise spontaneously when water flows over a sandy sediment bed. They form from a small perturbation of a flat sediment bed when the flow velocity is just above the critical value for setting sediment grains in motion. The bed shear stress maximum is located on the upstream flank of the perturbation at a distance of the order of [math] \lambda / 8[/math] from the crest (see Appendix; [math]\lambda[/math] is the wavelength of the perturbation). Assuming that the bedload saturation length [math]l_{sat}[/math] is 10-100 times the median sediment grain diameter [math]d_{50}[/math] [4], then the fastest growing perturbations have a wavelength of 100-1000 [math]d_{50}[/math] (see Appendix). These emergent ripples (wavelets) will grow in height, but also in wavelength. The migration speed of the ripples depends on the height and on the wavelength. As not all the ripples have the same height and wavelength, ripples tend to coalesce into larger ripples. The merging process is accelerated by the reorganization of the original circulation cells into larger cells that span the two coalescing ripples, such that the development of a larger ripple of twice the original wavelength is promoted[9]. This process is called ripple coarsening.[5]
The seabed is then no longer smooth; the flow along the bottom becomes turbulent and the boundary layer extends to the free water surface. At this development stage, the streamlines will not follow the bed everywhere, but they separate at the ripple crest, to which a recirculating vortex is attached at the downstream side. Sediment suspension by the vortex greatly increases the saturation length. The location of maximum sediment transport may be shifted downstream of the ripple crest, resulting in ripple decay. Wavelength growth is also inhibited when the ripple wavelength [math]\lambda = 2 \pi / k[/math] reaches values at which surface water waves become resonant with the bed perturbation.[5] When the current velocity [math]u[/math] equals or exceeds the wave celerity [math]c= \sqrt{g \, \tanh(kh)/k}[/math], the flow becomes supercritical and antidunes appear. However, the development of subaqueous dunes from bed perturbations with wavelengths [math]\lambda[/math] much larger than the water depth [math]h[/math] is possible for rough (rippled) sediment beds.[4] The dune wavelength scales with the water depth; the fastest growing perturbations have wavelengths in the range [math]\lambda = 6-60 \; h[/math]. [10] The development of dunes with smaller wavelengths is suppressed by gravity-driven transport from crest to trough.[11]
Wavelength selection in oscillating flow
Spontaneous bedform generation in oscillating flow is generally assumed to be driven by the residual circulations shown in Fig. 7. These residual circulation cells exist for bed perturbations of any wavelength. However, periodic bedforms in field situations only occur at certain wavelength ranges. Wave ripples typically have a wavelength of 5 to 50 cm, while seabed sand waves (submarine dunes in tidal seas) have a wavelength of 100 to 1000 m.[12][8] The strength of the residual circulation cells differs for different wavelengths, but this is not the only explanation of the wavelength ranges. Bedload transport is generally assumed to have a downslope component that counteracts the contribution of the residual circulation cells to the upslope movement of sediment grains. The downslope transport component is stronger for bed perturbations with a small wavelength (because they have steeper slopes). Thus, the growth of bed perturbations with a small wavelength will be slow or even impossible. On the other hand, if the wavelength of the bed perturbation is large, the residual circulation cells are weak and the distance for sediment grains to move from trough to crest is large. So, bed perturbations will start developing ripples with intermediate wavelengths.
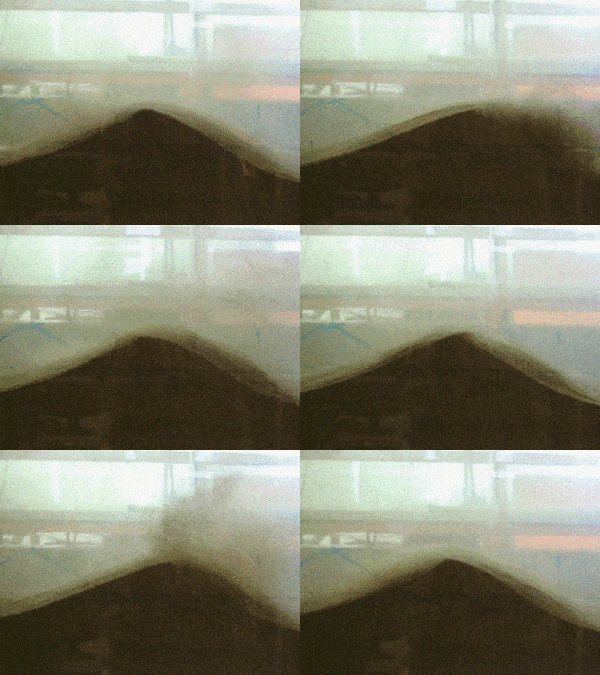
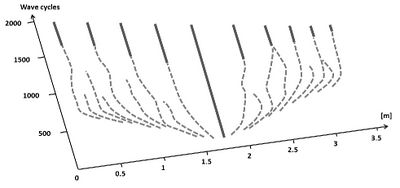
When the ripple height grows, flow separation at the ripple crest will generate vortexes laden with sediment that are ejected into the flow (Fig. 8). The resulting modification (inversion) of the sediment fluxes creates zones of erosion and deposition, allowing for the creation and development of new ripples. Merging occurs when two ripples are situated between two other ripples that generate vortices of a larger magnitude. By this mechanism, a field of wave ripples can arise from a single initial seabed perturbation (Fig. 9).[14]
Wave ripples are induced by the horizontal component of the wave orbital velocity near the sediment bed. Ripple wavelengths can therefore not be much larger than the horizontal orbital excursion given by [math]U_0 T / \pi[/math], where [math]U_0[/math] is the maximum wave orbital velocity along the seabed and [math]T[/math] the wave period.[15] Sheet flow transport prevails when wave orbital currents are strong ([math]U_0 \ge 0.5-1 \; m/s[/math]); bed ripples are wiped out. This explains why wave ripple lengths larger than 50 cm seldom occur. Megaripples with wavelength of several meters and complex 3-dimensional shapes are also observed in wave-dominated environments, but their generation mechanism is not yet well understood.
Sand waves in shelf seas are induced by residual circulations (Fig. 7) generated by interaction of tidal currents with seabed perturbations in the tidal boundary layer. The underlying process is essentially the same as for wave ripple generation, i.e. the mutual reinforcement of sand wave growth and corresponding tide-averaged circulation cells. This process is in some cases disturbed by tidal asymmetry, since convergence of sediment transport then no longer occurs on top of the sand wave crest, but downstream of this point. This results in asymmetry of the bed forms and migration[16].
The wavelength of sand waves is much smaller than the ebb/flood excursion, which can exceed 10 km in tidal seas. The weakness of the residual circulation cells associated with bed perturbations of great length is the main reason of the relatively small length of sand waves compared to the tidal excursion.[12] A more detailed description of sand waves is presented in the article Seabed sand waves.
Related articles
- Stability models
- Rhythmic shoreline features
- Wave ripples
- Wave ripple formation
- Seabed sand waves
- Sand ridges in shelf seas
- Beach Cusps
- Nearshore sandbars
Appendix: Ripple wavelength in steady flow (current ripples)
We use the following symbols:
[math]x = [/math] the coordinate along the main flow
[math]t =[/math] time
[math]\lambda =[/math] the wavelength of the bed perturbation, [math]k = 2 \pi /\lambda =[/math] the corresponding wavenumber
[math]z(x,t) = z_b e^{i k (x – ct) + \sigma t}[/math] the complex bed perturbation (only the real part counts), which is assumed periodic, with growth rate [math]\sigma[/math] and migration rate [math]c[/math]
[math]l_{sat} =[/math] the saturation length of the sediment flux, of the order of 10-100 median grain diameters [math]d_{50}[/math]
[math]q_0 =[/math] the unperturbed sediment flux over the flat bottom
[math]q_{sat} = C_{sat} \, k \, z(x,t) \, e^{i \phi } =[/math] the adjustment of the saturated sediment flux to the perturbed bottom ([math]C_{sat}=[/math] constant)
[math]q' \propto e^{ikx} =[/math] the perturbation of the sediment flux due to the bed perturbation [math]z(x,t)[/math].
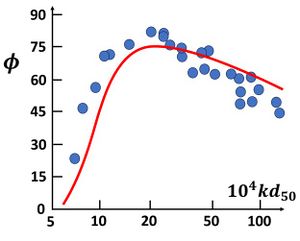
The highest shear stress is reached on the updrift side of the bed perturbation before the crest; the phase [math]\phi[/math] indicates the phase lead of the bed shear stress and the sediment flux relative to the bed perturbation.
The total perturbed sediment flux [math]q(x,t) = q_0 + q’(x,t) [/math] adjusts to the saturated sediment flux according to the relaxation equation[5]
[math]\Large\frac{\partial q}{\partial x}\normalsize = i k q’ = \Large\frac{1}{l_{sat}}\normalsize \, (q_{sat} -q’) , \qquad[/math] giving [math]\qquad q’ = \Large\frac{q_{sat}}{1 + ik l_{sat}}\normalsize . \qquad (A1)[/math]
The seabed evolution equation, [math]\quad \Large\frac{\partial z}{\partial t}\normalsize = - \Large\frac{\partial q}{\partial x}\normalsize \qquad[/math] gives [math]\qquad (\sigma - ikc) \, z = - ikq’ = - \Large\frac{ikq_{sat}}{1 + ikl_{sat}}\normalsize = - \Large\frac{ik^2 C_{sat} z e^{i \phi}}{1 + ikl_{sat}}\normalsize. \qquad (A2)[/math]
Taking the real part of equation (A2) gives the growth rate
[math]\sigma = \Large\frac{C_{sat}}{l_{sat}^2}\frac{y^2 \sin \phi \, – \, y^3 \cos \phi}{1 + y^2}\normalsize . \qquad (A3)[/math]
Here [math]y = k l_{sat}[/math]. The growth rate is positive if [math]y \lt \tan \phi[/math].
The phase [math]\phi[/math] is a slowly varying function of the wavenumber [math]k \;[/math] for values of [math]k \, d_{50}[/math] in the range 10-3-10-2 (Fig. A1). We will ignore this variation and consider [math]\phi \approx 45^o \;[/math] constant when deriving an expression of the fastest growing wavelength. The fastest growing wavelength [math]k[/math] is then found by solving the equation [math]d \sigma /dk =0[/math]. The result is
[math]k = \Large\frac{1}{l_{sat}}\normalsize \Big( Y - \Large\frac{1}{Y}\normalsize \Big) , \quad Y = \Big( \Large\frac{1 + \sin \phi}{\cos \phi}\normalsize \Big)^{1/3} . \qquad (A4)[/math]
Ripple development starts in laminar flow for perturbations with small wavelengths (large [math]k \, d_{50}[/math]), for which the phase [math]\phi \approx 45^o \;[/math]. Using [math]l_{sat} = 10-100 \: d_{50}[/math], the wavelength [math]\lambda[/math] of the fastest growing perturbation [math]\lambda = 100-1000 \: d_{50}[/math]. Ripple wavelengths observed in lab experiments and in rivers fall in the same range. If downslope sediment transport (from crest to trough) is taken into account, a slope-dependent parameter must be subtracted from the phase [math]\phi[/math]. This implies that the wavelength of the fastest growing perturbations will be longer.
References
- ↑ Kleinhans, M. G. 2005. Phase diagrams of bed states in steady, unsteady, oscillatory and mixed flows. In (editor L. van Rijn): Principles of Sedimentation and Erosion Engineering in Rivers, Estuaries and Coastal Seas, pp. Q1– Q16, Aqua, Blokzijl, Netherlands
- ↑ Wikramanayake, P.N. and Madsen, O.S. 1994. Calculation of Movable Bed Friction Factors. Technical Report. U.S. Army Engineer Waterways Experiment Station, Vicksburg, MS.
- ↑ Kennedy, J.F. 1969. The formation of sediment ripples, dunes and antidunes. Ann.Rev.Fluid Mech. 1: 147-168
- ↑ 4.0 4.1 4.2 Vinent, O.D., Andreotti, B., Claudin, P. and Winter, C. 2019. A unified model of ripples and dunes in water and planetary environments. Nat. Geosci. 12: 345–350
- ↑ 5.0 5.1 5.2 5.3 Fourrière, A., Claudon, P. and Andreotti, B. 2010. Bedforms in a turbulent stream: formation of ripples by primary linear instability and of dunes by nonlinear pattern coarsening. J. Fluid Mech. 649: 287–328
- ↑ Charru, R. and Hinch, E.J. 2006. Ripple formation on a particle bed sheared by a viscous liquid. Part 2. Oscillating flow. J. Fluid Mech. 550: 123–137
- ↑ 7.0 7.1 Vittori, G. and Blondeaux, P. 2022. Predicting offshore tidal bedforms using stability methods. Earth-Sci. Rev. 235, 104234
- ↑ 8.0 8.1 8.2 Vittori, G, and Blondeaux, P. 2024. On the prediction of the characteristics of sand ripples at the bottom of sea waves. Earth-Science Reviews 252, 104753
- ↑ Flemming, B.W. 2000. On the dimensional adjustment of subaqueous dunes in response to changing flow conditions: a conceptual process model. In: Trentesaux, A., Garlan, T. (Eds.), Marine Sandwave Dynamics. Proceedings International Workshop, University of Lille, pp. 61–67
- ↑ Dronkers, J. 2016. Dynamics of coastal systems, 2nd edition. Advanced Series on Ocean Engineering 41. World Scientific, Singapore, pp. 753
- ↑ Fredsoe, J. 1974. On the development of dunes in erodible channels. J.Fluid Mech. 64: 1-16
- ↑ 12.0 12.1 Besio, G., Blondeaux, P., Brocchini, M., Hulscher, S.J.M.H., Idier, D., Knaapen, M.A.F., Németh, A.A., Roos, P.C. and Vittori, G. 2008. The morphodynamics of tidal sand waves: A model overview. Coastal Engineering 55: 657–670
- ↑ van der Werf, J. J., Doucette, J. S., O'Donoghue, T. and Ribberink, J. S. 2007. Detailed measurements of velocities and suspended sand concentrations over full-scale ripples in regular oscillatory flow. Journal of Geophysical Research 112(2): 1–18
- ↑ 14.0 14.1 Marieu, V., Bonneton, P., Foster, D. L. and Ardhuin, F. 2008. Modeling of vortex ripple morphodynamics, J. Geophys. Res. 113, C09007
- ↑ Sleath, J.F.A. 1976. On rolling grain ripples. J.Hydr.Res. 14: 69-80
- ↑ van Gerwen, W., Borsje, B.W., Damveld, J.H. and Hulscher S.J.M.H. 2018. Modelling the effect of suspended load transport and tidal asymmetry on the equilibrium tidal sand wave height. Coastal Engineering 136: 56–64
- ↑ Frederick, K. A. and Hanratty, T. J. 1988. Velocity measurements for a turbulent nonseparated flow over solid waves. Exp. Fluids 6: 477-486
- ↑ Zilker, D. P., Cook, G. W. and Hanratty, T. J. 1977. Influence of the amplitude of a solid wavy wall on a turbulent flow. Part 1. Non-separated ows. J. Fluid Mech. 82: 29-51
- ↑ 19.0 19.1 Charru, F., Andreotti, B. and Claudin, P. 2013. Sand ripples and dunes. Annual Review of Fluid Mechanics 45: 469-493
Please note that others may also have edited the contents of this article.
|
