Wave ripples
Contents
Introduction
Sea waves shape the bottom and generate different morphological patterns, which are characterized by a wide range of length scales. The ripples are the smallest bedforms but, notwithstanding their relatively small size, they play a prominent role in many transport processes. Indeed, usually, the flow separates at their crests and vortices are generated which increase momentum transfer, sediment transport and, in general, mixing phenomena.
Even though the ripples generated by sea waves (wave ripples) appear to be similar to the ripples generated by steady currents/slowly varying tidal currents, they have different characteristics since they are the result of a different mechanism of formation. What follows concerns wave ripples, which hereinafter are simply named 'ripples'. The ripples generated by steady currents are not considered in the present article.
Ripple geometry
The geometry of the most common ripples is almost two-dimensional and similar to that of a wave with a crest and a trough (see figure 1). However, the wavelength [math]\lambda[/math] of the ripples is of the order of magnitude of the amplitude of the fluid displacement oscillations close to the sea bottom and it turns out to be of [math]O [/math] (10 cm) , while the height of the ripples is of a few centimetres.
The estimate of the geometrical characteristics of the ripples is important for many reasons. First, ripple presence enhances the suspended sediment transport. Indeed, when the steepness of the ripples becomes larger than approximately 0.1 [1], the oscillatory bottom boundary layer separates from the crest of the bedforms and a vortex is generated, twice per wave cycle, on the lee side of the ripple by the roll-up of the free shear layer shed from the ripple crest. This vortex picks-up the sediments from the bottom and at flow reversal, when it is convected in the opposite direction by the free stream, it ejects the sediments far from the bottom. Later, the vortex decays and the sediments settle down. Moreover, because of the vortices they shed, the ripples significantly increase the bottom friction and the dissipation of energy. Finally, ripples may act as a source of nutrients. In fact, for high values of the bottom shear stress, ripples are washed out and the nutrients are released into the water column at a rate which depends on the time development of their geometrical characteristics.
Empirical formulae to predict ripple wavelength and height are used for practical purposes. The physical quantities which affect the ripple geomety can be assumed to be i) the density [math]\rho[/math] of the water, ii) the kinematic viscosity of the water [math]\nu[/math], iii) the period [math]T[/math] of the velocity oscillations induced close to the sea bed by the surface waves or, alternatively, the angular frequency [math]\omega=2 \pi /T[/math], iv) the amplitude [math]U_0[/math] of the velocity oscillations ([math]U_0=a\omega/\sinh (kh)[/math], [math]k=2 \pi/L[/math] being the wavenumber of the surface wave, [math]a[/math] being its amplitude and [math]h[/math] the local water depth), v) the sediment size [math]d[/math], vi) the density [math]\rho_s[/math] of the sediment and vii) gravity acceleration [math]g[/math]. By applying dimensional arguments, the wavelength and height of the ripples turn out to depend on four dimensionless parameters, i.e. the relative density [math]s=\rho_s / \rho[/math], the ratio [math] d /\delta[/math] between the grain size and the viscous length [math]\delta=\sqrt{2 \nu / \omega}[/math], a sediment Reynolds number [math]R_p = \sqrt{ (s-1)g d^3} / \nu[/math] and a flow Reynolds number [math]R_{\delta} = U_0 \delta / \nu[/math]. Of course, these parameters can be replaced by their combinations and in the literature it is common to encounter other parameters such as the mobility number [math]\psi= U_0^2 / ((s-1)gd)[/math], the Reynolds number of the sediment defined by [math]R_d = U_0 d / \nu[/math] and the flow Reynolds number [math]Re = U_0^2 / (\nu \omega) = R^2_\delta / 2[/math].
Both a simple dimensional analysis and idealized models, based on linear stability analyses (see the article Wave ripple formation), show that the geometrical characteristics of ripples can not be predicted from the knowledge of just one dimensionless parameter. However, the empirical formulae which can be found in the literature use one parameter for simplicity. Hence, the first question to be addressed is: which is the independent parameter that mainly controls ripple geometry ?
The plethora of predictors using different parameters, along with the significant differences among the predictions they provide, suggest that the problem of predicting ripple characteristics is far to be definitively solved. An exhaustive description of all the predictors and the advantages/disadvantages of each of them is beyond the aim of the present article. The paper of Nelson et al. [2] describes and discusses some of the predictors commonly used. In the following, to give an idea of these predictors and of their performances, we describe only a few of them.
Ripple wavelength
Laboratory and field data indicate that the wavelengths of the ripples generated by regular surface waves are somewhat different from those generated by irregular waves. However, Soulsby and Whitehouse [3] and Nelson et al. [2] proposed a single predictor to be used under both regular and irregular waves and they related the ratio between the ripple wavelength [math]\lambda[/math] and the amplitude [math]U_0/\omega[/math] of the fluid displacement oscillations close to the bottom to the parameter [math] U_0 / ( \omega d)[/math]:
[math]\Large \frac{\lambda}{U_0/\omega} \normalsize =\Large \frac{1}{ a_1 + b_1 \frac{U_0}{\omega d} \left[1-e^{-\left( c_1 \frac{U_0}{\omega d} \right)^{d_1}} \right]} \normalsize , \qquad(1) [/math]
where the constants suggested by [1] are
[math]a_1=1, \ \ \ \ \ b_1= 1.87 \times 10^{-3}, \ \ \ \ \ c_1=2.0 \times 10^{-4}, \ \ \ \ \ d_1=1.5 , \qquad (2) [/math]
while the constants suggested by [2] are
[math]a_1=0.72, \ \ \ \ \ b_1= 2.00 \times 10^{-3}, \ \ \ \ \ c_1=1.57 \times 10^{-4}, \ \ \ \ \ d_1=1.15 \qquad (3) [/math]
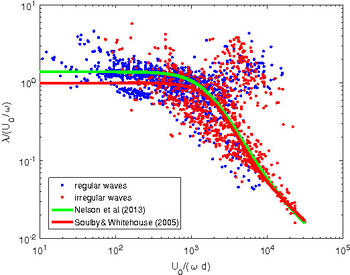
Figure 2 shows measured ripple wavelengths along with the values provided by equation (1) with the values of the constants suggested by both Nelson et al. [2] and Soulsby and Whitehouse [3].
The blue points of figure 2 are extracted from the database collected by [2] for regular waves or oscillatory flows. Of course when data for irregular waves (red points) are added by considering the flow generated by the significant wave (red points), the scatter of the data slightly increases. The experimental data obtained using an oscillating tray are discarded because Miller and Komar [4] concluded that the results of oscillating bed experiments are different from water tunnel, wave channel and field results. Moreover, some of the data of [2] are not plotted in figure 2 because they refer to field data or data obtained in large flume facility where the average characteristics of the surface waves change over time. Even though Nelson et al. [2] introduced heuristic criteria to consider only ripples which attained a morphological equilibrium, it might be that some of the data refer to relic ripples the geometry of which does not depend on the actual characteristics of the surface waves.
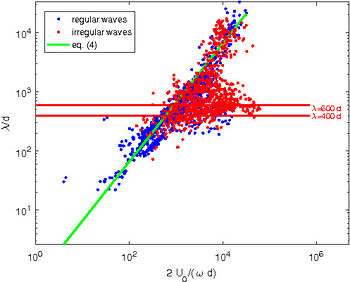
On the other hand, Inman [5] suggested that, for an assigned sediment size, the ripple wavelength depends on [math]2 U_0 / \omega[/math], i.e. twice the amplitude of the fluid displacement oscillations close to the bottom. In particular Inman [5], by analysing experimental data, showed that the ripple wavelength is directly proportional to [math]2 U_0 / \omega[/math] up to a critical value whereupon the crest-to-crest distance becomes inversely proportional to [math]2 U_0 / \omega[/math] and finally it attains a constant value. Figure 3 shows that the values of [math]\lambda/d[/math] plotted versus [math](2 U_0/\omega)/d[/math], for the data already considered in figure 2. The laboratory measurements dominate the left hand side of the plot while the field measurements dominate the right hand side. Later, Clifton [6] classified ripples as orbital, anorbital and suborbital ripples. Orbital ripples are characterized by a wavelength proportional to the amplitude of the fluid displacement oscillations
[math]\lambda \simeq 0.65 \Large \frac{2 U_0}{\omega} \normalsize . \qquad (4) [/math]
Anorbital ripples appear for large values of [math]2 U_0/(\omega d)[/math] and their wavelength is almost independent of [math]2 U_0 / \omega[/math] and ranges between [math]400 d[/math] and [math]600 d[/math], even though the measurements show a large scatter which does not allow to obtain a more precise value. The critical point is to predict what type (orbital/anorbital) of ripple appears for given hydrodynamic and morphodynamic parameters. Moreover, suborbital ripples exist too, which have a wavelength which depends on both [math]2 U_0/ \omega[/math] and the grain size [math]d[/math]. This problem is not present if formula (1) is used to predict ripple wavelength, however also figure 2 shows that a significant number of observations (values of [math]U_0/(\omega d)[/math] in the range [math](10^3,10^4)[/math]) deviate from the trend predicted by relationship equation (1)
Nielsen [7] proposed to predict the spacing of the ripples as function of the sediment mobility number
[math]\psi=\Large \frac{U_0^2}{\left( s-1 \right) g d} \normalsize \qquad (5) [/math]
and he suggested
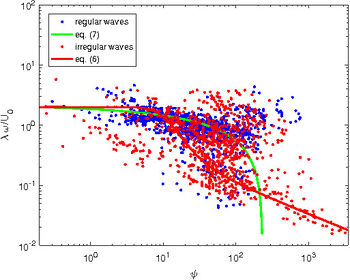
[math]\Large \frac{\lambda}{U_0/\omega} \normalsize = \exp\left(\Large \frac{693-0.37 \ln^8\psi}{1000 +0.75 \ln^7 \psi} \normalsize \right) \qquad(6) [/math]
for ripples observed in the field and
[math]\Large \frac{\lambda}{U_0/\omega} \normalsize = 2.2 - 0.345 \psi^{0.34} \qquad (7) [/math]
for the ripples generated by a regular oscillatory flow. The values of the ripple wavelength predicted by means of (6) and (7) are plotted as function of the mobility number in figure 4, along with the experimental data.
Ripple height
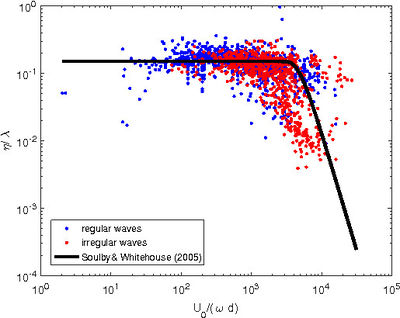
Once ripple wavelength is estimated, the height [math]\eta[/math] can be obtained from the prediction of ripple steepness. Soulsby and Whitehouse [3] suggest to predict the ripple steepness [math]\eta/\lambda[/math] as function of the parameter [math]U_0/(\omega d)[/math]
[math]\Large \frac{\eta}{\lambda} \normalsize = 0.15 \left[ 1 - \exp\left[ -( \Large \frac{5.0 \times 10^{3} } {U_0/\omega d} )^{3.5} \normalsize \right] \right] . \qquad (8) [/math]
On the other hand, Nelson et al. [2] suggest to predict the ripple steepness as function of the ripple wavelength according to the formula
[math]\Large \frac{\eta}{\lambda} \normalsize =0.12 \lambda^{-0.056} , \qquad (9) [/math]
where [math]\lambda[/math] should be in metres. The predictor equation (9) has the disadvantage of predicting the ratio [math]\eta/\lambda[/math] as function of a dimensional quantity. Moreover, to predict the ripple steepness, it is necessary either to know the wavelength or to predict the value of [math]\lambda[/math] by using equations (1) and (3). Figure 5 shows a comparison between the results provided by equation (8) and the experimental measurements for regular and and irregular waves.
Ripple symmetry index
Even though the profile of the ripples is almost symmetric with respect to their crest, a small degree of asymmetry is invariably generated by the steady streaming, which is present under a propagating wave because of nonlinear effects [10], and by the difference between the forward fluid velocity, which takes place under the crests of the surface wave, and the backward velocity under the troughs. Hence, a symmetry index of the ripple can be defined as the ratio between the length [math]l_2[/math] of the gentle (up-current) side to the length [math]l_1[/math] of the steep (down-current) side of the bottom forms. Figure 6 shows the values of [math]\; (l_2 / l_1)-1 \;[/math] plotted versus the strength of the steady streaming for the experimental data of Inman [5], Tanner [11] and Blondeaux et al. [9]. In figure 6, the value of the steady velocity component [math]U_s[/math] is estimated by means of the theory of Longuet-Higgins [10] ([math]U_s = 3\pi a^2\omega /[2L\sinh^2(2\pi h/L)][/math]). Hence, the abscissa of figure 6 is equal to [math]3\pi a /[2L\sinh(2\pi h/L)][/math]. As expected, the results plotted in figure 6 indicate that ripples tend to become more asymmetric as the mass transport velocity increases.
Three-dimensional ripples
Often, the ripple profile is two-dimensional but depending on sediment and flow characteristics, other ripple shapes are observed. For example, figure 7a shows the brick-pattern ripples observed by Sleath [1] during a laboratory experiment. Brick pattern ripples have the crests perpendicular to the direction of the fluid oscillations, as two-dimensional ripples. However, the crests are joined by equally spaced bridges of smaller amplitude which are parallel to the direction of fluid oscillations and shifted by half a wavelength between adjacent sequences. It follows that the overall bottom topography resembles a wall made by bricks.
Other three-dimensional ripples do exist and photos can be found in the books of Sleath [1] and Allen [8].
Friction factor for ripples
In large scale hydrodynamic problems, it is not possible to compute the flow field with the spatial resolution required to compute the flow around each ripple. Hence, these small scale bedforms are usually modelled as a roughness of the bed of appropriate size. Experimental measurements indicate that the size of the roughness is related to the ripple height. Van Rijn [12] suggests that the roughness size ranges between one and three ripples heights. These values are supported by the data shown in figure 3.6.7 of Nielsen's book [13]. However, experimental measurements carried out for low flow intensities indicates that also the shape of the ripples, and in particular their steepness [math]\eta/\lambda[/math], affects the equivalent roughness size. In the literature, it is suggested that the equivalent roughness size [math]k_s[/math] can be given values close to [math]c_1 \eta^2/\lambda[/math], where [math]c_1[/math] is a constant. Nielsen [13] proposed [math]c_1=8[/math] while Grant and Madsen [14] and Li et al. [15] proposed [math]c_1=28[/math] and Van Rijn [12] suggested [math]c_1 =20[/math], even though in a previous work Van Rijn [16] assumed [math]k_s=1.1 \eta \left(1-e^{-25 \eta/\lambda} \right)[/math]
For large flow intensities, when the coherent vortices shed by the ripples pick-up a lot of sediments from the bed and put them into suspension, Nielsen [13] suggests to estimate the equivalent roughness by means of
[math] k_s= 8 \Large \frac{\eta^2}{\lambda} \normalsize +170 d \sqrt{\theta -0.05} , [/math]
where [math]\theta=\tau / ((\rho_s-\rho) g d)[/math] is the Shields parameter evaluated by using the skin friction [math]\tau[/math].
Grain-sorting over ripples
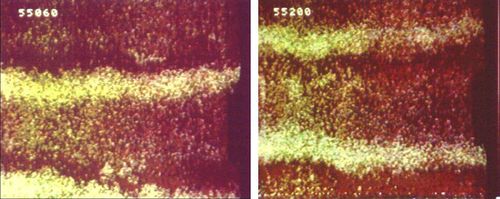
In the field, the sediment is often a mixture of particles having different
sizes and ripples give rise to sorting phenomena.
Foti and Blondeaux [17] made laboratory experiments with a sediment mixture characterized by a bimodal
grain size distribution and observed that the coarser fraction oscillated around the crests of the bedforms while the fine
fraction tended to move towards the troughs (see figure 8).
Moreover, they found that the sorting phenomena
affect the dynamics of the ripples. Indeed, the ripples generated by a well sorted sediment turn out to be shorter
than those generated by a poorly sorted sediment.
Related articles
- Wave ripple formation
- Stability models
- Rhythmic shoreline features
- Principles of spontaneous bedform generation
- Sand ridges in shelf seas
- Beach Cusps
- Nearshore sandbars
- Bedforms and roughness
- Sand transport
- Sediment transport formulas for the coastal environment
- Coastal and marine sediments
References
- ↑ 1.0 1.1 1.2 1.3 Sleath J.F.A. (1984) Sea bed mechanics. John Wiley and Sons.
- ↑ 2.00 2.01 2.02 2.03 2.04 2.05 2.06 2.07 2.08 2.09 2.10 2.11 Nelson T.R., Voulgaris G. and Traykovski P. (2013). Predicting wave-induced ripple equilibrium geometry. J. Geophys. Res.: Ocean 118, 3202-3220.
- ↑ 3.0 3.1 3.2 Soulsby R.R. & Whitehouse R.J.S. (2005) Prediction of Ripple Properties in Shelf Seas. Mark 2 Predictor for Time Evolution Final Technical Report TR 154. HR Wallingford Limited.
- ↑ Miller M.C. and Komar P.D. (1980). A field investigation of the relationship between ripple spacing and near-bottom water motions. J. Sed. Petrology 50, 183-191.
- ↑ 5.0 5.1 5.2 Inman D.L. (1957). Tech. Mem. U.S. Beach Erosion N. 100.
- ↑ Clifton H.E. (1976). Wave-formed sedimentary structures - A conceptual model. In Davis and Ethington ed: Beach and nearshore sedimentation. SEPM special publication 24, 126-148
- ↑ Nielsen P. (1981). Dynamics and geometry of wave generated ripples. J. Geophys Res. 86 (C7), 6467-6472.
- ↑ 8.0 8.1 Allen J.R.L. (1984). Sedimentary structures, their character and physical basis. Elsevier.
- ↑ 9.0 9.1 Blondeaux P., Foti E., Vittori G. (2000). Migrating sea ripples. European Journal of Mechanics - B/Fluids 19 (2), 285-301.
- ↑ 10.0 10.1 Longuet-Higgins M.S. (1953). Mass transport in water waves. Philos. Trans. R. Soc. 345, 535-581.
- ↑ Tanner W.F. (1971). Numerical estimates of ancient waves, water depth and fetch. Sedimentology 16, 71-88.
- ↑ 12.0 12.1 van Rijn L.C. (1993). Principles of sediment transport in rivers, estuaries and coastal seas. Aqua Publications, Amsterdam, the Netherlands.
- ↑ 13.0 13.1 13.2 Nielsen P. (1992). Coastal bottom boundary layers and sediment transport. World Scientific
- ↑ Grant W.D. and Madsen O.S. (1982). Movable bed roughness in unsteady oscillatory flow. J. Geophys Res. 87, 469-481.
- ↑ Li M.Z., Wright L.D. and Amos C.L. (1996). Predicting ripple roughness and sand resuspension under combined flows in a shoreface environment. Marine Geology 130, 139-161.
- ↑ van Rijn L.C. (1984). Sediment Transport, Part III: Bed forms and alluvial roughness. J. Hydraul. Eng., ASCE, 110, 1733-1754.
- ↑ 17.0 17.1 Foti E. and Blondeaux P. (1995). Sea ripple formation: the heterogeneous sediment case. Coastal Eng., 25(3-4), 237-253.
Please note that others may also have edited the contents of this article.
|


