Tsunami
Definition of Tsunami:
Long waves caused by a strong local disturbance of the water mass. Tsunamis generally consist of a few successive waves with wavelengths typically much larger than the wavelength of wind-generated waves and much smaller than the wavelength of tidal waves.
This is the common definition for Tsunami, other definitions can be discussed in the article
|
Contents
Tsunami causes and occurrence
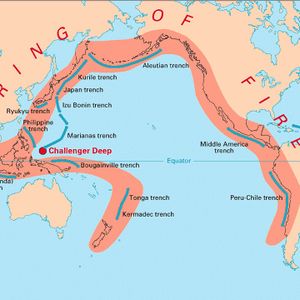
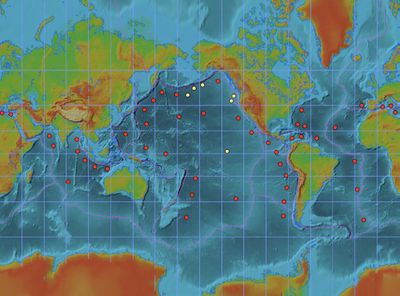
The occurrence of a tsunami can have several causes, see e.g. the review article of Röbke and Vött (2017) [1] and references therein. The main cause, responsible for the strongest tsunamis, are seaquakes (submarine earthquakes): the sudden uplift of the seabed due to shifting earth plates. This mainly occurs in subduction zones, where an earth plate slides under an adjacent earth plate causing vertical motion of the submarine crust along the subduction line. The most important subduction zones lie along the edges of the Pacific Ocean, the so-called ring of fire (see Fig. 1). The strength of the tsunami depends on the slip length and slip angle ("rake") along the fault plane, as well as on the fault aspect ratio (fault length/fault width)[2]. As a rule, the initial tsunami wave height is proportional to the cube of the length of the rupture zone (Bryant 2008[3]) which, in turn, is positively correlated to the area of displacement. The highest tsunami wave radiates in both directions perpendicular to the subduction line. According to an analysis of Zhao and Niu[4], the period of the leading tsunami wave depends primarily on earthquake magnitude, focal depth and local water depth. Sufficiently accurate information about these various quantities for existing submarine fault structures is generally not available for assessing their tsunami generating potential. For this reason, probabilistic tsunami hazard assessments (PTHAs) are usually based on the annual exceedance frequency of tsunami heights in regions of submarine tectonic activity, based on long-term observation records. In this way, a set of tsunamigenic seaquake scenarios can be established for each vulnerable coastal site, representing the probability distribution of earthquakes that may affect this particular site[5].
A second important cause is submarine gravity mass wasting. Such slides can be triggered by seismic activity at a sloping seabed (e.g., the shelf break) that is covered with a thick unstable layer of unconsolidated material. The tsunami wave propagates in the direction of the slide and is strongest if the speed of the debris flow is comparable to the local wave propagation speed[1]. Gas formation (methane) due to the anaerobic degradation of organic material can contribute to the loss of stability of the sediment layer on the sloping seabed [6].
Tsunamis caused by subaerial landslides are a more local phenomenon. Volcanic activity can also cause a tsunamis, but generally of moderate strength. A tsunami can in rare cases result from the impact of a large meteorite.
Another type of tsunamis, so-called meteotsunamis, can arise from atmospheric disturbances. Sudden local pressure fluctuations can generate a small setup or set-down of the water level that is amplified if the atmospheric front propagates at a speed comparable to the wave propagation speed or if the spatial/temporal scales coincide [7]. The amplitude of meteotsunamis is usually small, but it can increase strongly due to resonance effects in semi-closed basins (e.g., harbor seiches, which are damaging for moored ships). See Proudman resonance and meteo tsunamis for further details.
Tsunami characteristics
A tsunami usually consists of a number of waves (up to about ten) of different amplitude [8]. The first tsunami wave is not always the highest; subsequent waves (the third, fourth or fifth) can often be higher[9]. The characteristic wave period is different for each tsunami, but usually much greater than the period of wind-driven waves (i.e., more than a few minutes) and much smaller than the tidal period (i.e., less than two hours). The wave height can be a few meters at the place of origin, but when the tsunami starts propagating over the ocean the wave height quickly becomes smaller and is then usually less than one meter[10]. The wavelength is much greater than the water depth and the energy loss during ocean propagation is small (approximately inversely proportional to the wavelength). The propagation speed [math]c[/math] can therefore be approximated with the formula [math]c = \sqrt {gD}[/math], where [math]D[/math] is the average depth and [math] g [/math] the gravitational acceleration. Tsunamis travel at great speed across the ocean ([math]c[/math] in the order of a few hundred m/s) covering distances of many thousands of kilometers without great energy loss. The energy flux [math] F [/math] can be estimated with the formula [math]F = cE \approx (1/8) \rho g H ^ 2 \sqrt {gD}[/math], where [math]E[/math] is the tsunami wave energy, [math] H [/math] the tsunami wave height and [math]\rho[/math] the water density. When the tsunami reaches the coastal zone, the water depth decreases sharply as does the propagation speed [math] c [/math]. However, frictional energy dissipation being relatively modest, the energy flux [math]F[/math] remains almost the same. According to the Green rule, [math]H_{shore}/H_{ocean} \approx (D_{ocean}/D_{shore})^{1/4}[/math], the wave height [math]H[/math] of the tsunami is strongly increased (for example, the amplification factor is 6 if [math]D_{ocean}=5000 m , D_{shore}=4 m[/math]). The wave height can be amplified even more in marine inlets, such as bays, fjords or harbours, where the tsunami energy flux is concentrated and accelerated due to strong funnel effects [1]. The tsunami waves are also distorted when entering the sloping continental shelf; the front of a tsunami wave that travels upslope moves faster than the trough of the preceding wave which already travels in shallower water. Differences in propagation speed of wave crest and preceding wave trough contribute to steepening of the wave front[11].
When the tsunami wave arrives at the coast it runs up the shoreface (schematically depicted in Fig. 6). If the slope is steep (the width of the shoreface being smaller than the wavelength of the tsunami), the tsunami 'feels' the shoreface as a straight wall. The tsunami is then strongly reflected and the wave height can be doubled. The tsunami floods the coast as a surging wave with a relatively low speed that often can be outrun and the wave run-up is not much higher than the wave height on the inner shelf[12].
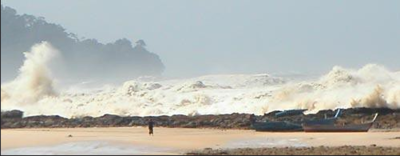
If the shelf slope is gentle (the width of the foreshore being greater than the tsunami wavelength), the tsunami can transform into an undular bore, with short waves riding on the main tsunami wave. When reaching the shore, the tsunami transforms further into a breaking bore (a wall of water, see Fig. 2) that propagates at great speed with a very fast rising water level. Unless the shelf is extremely flat, the wave run-up is much higher than the wave height at the toe of the shelf (see section #Tsunami models).
The above qualitative description suggests that the character of a tsunami is related to the surf similarity parameter [math]\xi[/math] [13][12][14],
[math]\xi = \Large\frac{\tan \beta}{\sqrt{H_0/L_{\infty}}}\normalsize = \tan \beta \, \Big( \dfrac{2 \pi D}{H_0} \Big)^{1/2} \Big(\dfrac{g}{D \omega^2} \Big)^{1/4} \, , \qquad (1)[/math]
where [math]H_0[/math] is the tsunami height at the toe of the shelf slope, [math]L_{\infty} = 2 \pi \sqrt{gD} / \omega [/math] is the tsunami wave length at large depth, [math]S= \tan \beta[/math] is the shelf slope and [math]T=2 \pi / \omega[/math] is the tsunami wave period. Surging waves correspond to high values of [math]\xi[/math] and breaking waves to low values, [math]\xi \lt 3[/math]. [15]
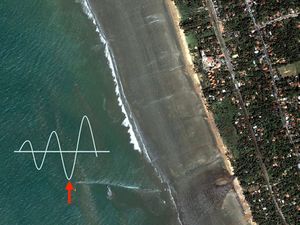
The highest wave in a tsunami wave train is usually preceded by a wave trough. A distinction is often made between two types of tsunamis: tsunamis where the largest wave crest precedes the largest wave trough (sometimes called leading-elevation N-wave or LEN-wave) and tsunamis where the largest wave crest is preceded by the largest wave trough (sometimes called leading-depression N-wave or LDN-wave). Both types of tsunami occur in practice. In case of a LDN-wave, the sea retreats over a large distance and part of the shoreface falls dry before arrival of the wave crest, see Fig. 3. This is an important signal for bathers that a high tsunami wave is approaching. Experiments in a laboratory flume show that tsunami of the leading-depression type are subject to more intense wave breaking, especially on gently sloping shelfs; in this case the wave energy and run-up height are reduced compared to tsunamis of the leading-elevation type, although the swash flow may be stronger. However, non-breaking tsunamis of the leading-depression type have a steeper wave front and therefore a greater run-up[17].
Tsunami impact
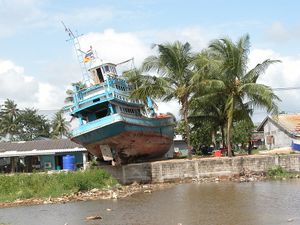
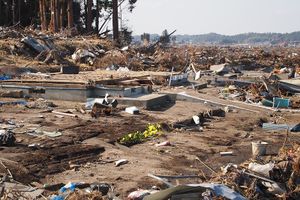
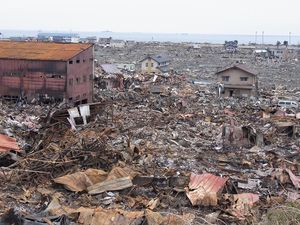
Tsunamis can cause enormous damage to coastal infrastructure, crushing houses, uprooting trees and making many casualties, see Fig. 4. From historical records it has been estimated that more than a million people have been killed worldwide by tsunamis [18]. In low-lying coastal areas (less than 10 m elevation above mean sea level) tsunamis can penetrate several kilometers inland. There are even records of tsunamis that have penetrated several tens of kilometers inland and have reached levels of several tens of meters. The flood water volume is approximately equal to the water volume above beach level of the incident tsunami wave [19]. Run-up velocities of strong tsunamis are very high; velocities of the order of 5 – 8 m/s are common and speeds up to 20 m/s have even be observed[20]. The destructive power of tsunamis is largely due to the many debris that are dragged by the flow[21].
Upon travelling inland the flow gradually slows down. The coarsest sediments carried by the tsunami are deposited first whereas the finest sediments are transported further inland[22]. Sedimentary records are best preserved in accreting low-energy environments such as coastal lagoons and salt marshes. Upward fining deposition layers over large distances are a distinctive mark of tsunami events [1]. However, not all past tsunamis can be detected in this way, because at some places upward coarsening deposits may also occur and sedimentary structures are not always well preserved over time; therefore, other properties of the tsunami deposits have to be taken into consideration as well (e.g. pollen, magnetic fabric, heavy metals, fish fossils, and other[23]).
The return flow of the tsunami to the sea (backwash) can be very strong and dangerous; it follows the steepest topographic slope and is often concentrated in channels, with velocities that can be higher than during the uprush [24].
Laboratory flume experiments and numerical models suggest that the maximum tsunami wave decreases sharply over a series of coast-parallel obstacles. The number of building rows is an explanatory variable for the maximum wave run-up load reduction, with the most load reduction occurring in the first 4 rows[25].
Why are tsunamis so devastating
The period of tsunami waves is typically in the range 300 – 6000 s (angular frequency in the order of 0.001 – 0.02 [math]s^{-1}[/math]). Therefore, these waves are not much influenced by the effect of earth's rotation, which corresponds to a frequency smaller than 0.00015 [math]s^{-1}[/math]. Tsunami waves in the ocean have wavelengths typically in the order of 100 to 500 km and on the continental shelf in the order of 2 – 20 km. This implies that they are refracted and diffracted by seabed structures with spatial scales of these orders of magnitude. More specifically, this means that tsunami waves refract to the continental shelf and approach the shore more or less perpendicularly. The energy flux of tsunami waves is thus directed toward the coast. This contrasts with tidal waves that are too long for being refracted to the coast. Due to their very low frequency, tidal waves are bent along the coast by the effect of earth's rotation (see Coriolis and tidal motion in shelf seas). The energy flux of tidal waves, which is comparable in strength to the energy flux of tsunami waves, is therefore not directed towards the coast, but along the coast. Hence, the impact of tidal waves on the coast is much less than the impact of tsunami waves. Just like tsunami waves, wind-generated waves are also refracted to the coast. Their energy density on the ocean is generally higher than the energy density of tsunami waves. However, the energy propagation speed of wind waves is much lower and so is the corresponding energy flux. Hence, wind waves are much less amplified when travelling into shallow water than tsunami waves. Moreover, wind waves lose a great deal of their energy due to breaking in the surf zone before they reach the shore. This explains why tsunamis have a far more devastating effect on the coast compared to tidal and wind waves.
Tsunami observation and warning
Just a single experimental measurement of a real-life tsunami in the nearshore zone is known to the authors[26]. Installing observation equipment at specific locations in anticipation of a tsunami makes no sense. Tsunami's are very rare events for each specific coastal location, even in areas that are very sensitive to submarine earthquakes. Experimental information about tsunamis that actually occurred is based on the effects observed in the coastal area after being hit by a tsunami. In some cases, eyewitness reports or amateur films are available. Although very important, this is insufficient for gaining in-depth understanding of the hydrodynamic processes that occur when a tsunami hits the coast. For this reason, understanding tsunamis is primarily based on modelling, as described in the following section.
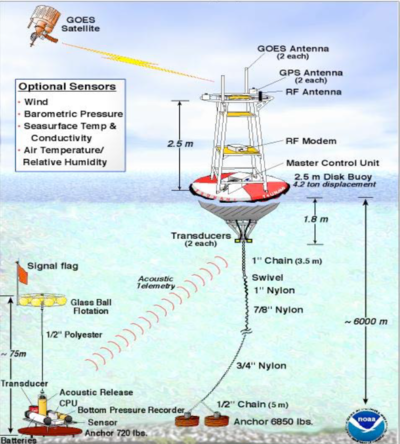
Tectonic activity that generates tsunamis is recorded by many seismic stations around the world. However, submarine earthquakes do not necessarily cause a tsunami. Tsunamis traveling across the ocean are very long waves of small amplitude that cannot be easily detected visually or by ships. For tsunami warning, an extensive network of monitoring stations has been installed in ocean areas where tsunamis can occur. The largest network is the DART system [27] consisting of an array of stations in the Pacific Ocean, see fig. 5a. Each station consists of a seabed pressure recorder that detects the passage of a tsunami. The data is sent by sonar signal to a moored buoy. This buoy sends a radio signal via satellite to the Tsunami Warning Center, see Fig. 5b. In this way, a tsunami traveling across the ocean can be detected and an early warning can be issued to countries where the tsunami will land, allowing timely evacuation of risk populations. The information collected by the monitoring network also enables to estimate the nature and intensity of the tsunami and the possible impact on the coast.
Tsunami models
Due to the scarceness of field observations, one has to rely on models for gaining insight into the hydrodynamic processes involved in tsunami events. The propagation of tsunami waves over the continental shelf and the shoreface can be simulated in hydraulic scale models. Due to the length scales involved (the tsunami wave lenght is O(100) m at model scale), conducting a properly scaled experiment is a difficult task, and there exists only few studies where proper Froude scaling have been applied (see e.g. Schimmels et al. 2016[28] and Matsuyama et al. 2017[29]). In such studies scale effects may still occur when energy dissipation (wave breaking and bed friction) comes into play. This imposes a limitation on the simulation of the inland run-up process in the laboratory.
Numerical modeling
Most of the early theoretical tsunami research utilized solitary waves as a representation of the tsunami (see e.g. Goring, 1978[30], Synolakis, 1986[31], 1987[32]). In the study by Madsen et al. (2008[11]), the use of solitary waves as a representation of tsunamis was questioned, however. They showed that the scales involved with a solitary wave are not representative of actual field scales, and are more related to wind waves than actual tsunamis. The problem is, that with the solitary wave formulation, the wavelength cannot be determined independently of the wave height and this means that solitary waves are much shorter than leading tsunami waves on the continental shelf.
To overcome some of these difficulties, non-linear shallow water (NLSW) models such as TSUNAMI (Goto and Ogawa, 1997[33]), MOST (Titov and Gonzales, 1997[34] and Titov and Synolakis, 1998[35]) and COMCOT (Liu et al. 1998[36]) have been used with reasonable success in simulating the propagation and run-up of tsunamis. These models, however, cannot resolve wave breaking and tsunami boundary layers and cannot handle dispersion. Dispersion can naturally be handled by Boussinesq type models (see e.g. Lynett and Liu, 2002[37]), but they still do not resolve the boundary layer nor the wave breaking. Detailed process-based numerical models are required for simulating these effects. A thorough model study of this type has been carried out by Larsen and Furman (2019)[12], who used a computational fluid dynamics scheme (CFD) for describing these processes.
Analytical modeling
A major problem for predicting the impact of tsunamis lies in the fact that the initial tsunami-generating disturbance cannot be predicted and is therefore generally not well known. When a tsunami wave is detected on the ocean, the time is too short for an accurate calculation of the impact before the tsunami lands on the coast. Only simple theoretical or semi-empirical relationships can be used.
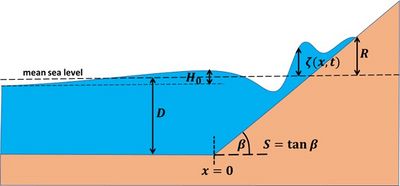
Carrier and Greenspan (1957[38]) solved analytically the non-linear shallow-water equations (mass and momentum balance without friction) over a sloping bed,
[math]\Large\frac{\partial \zeta}{\partial t}\normalsize + \Large\frac{\partial}{\partial x}\normalsize [(D+\zeta -x\tan\beta) \, u] = 0 , \quad \Large\frac{\partial u}{\partial t}\normalsize + u \Large\frac{\partial u}{\partial x}\normalsize + g \Large\frac{\partial \zeta}{\partial x}\normalsize =0 , \qquad (2)[/math]
where [math]t[/math] is time, [math]x[/math] is the spatial coordinate in the propagation direction, [math]D[/math] is the average shelf depth, [math]\tan \beta[/math] is the average shelf/shoreface slope, [math]\zeta[/math] is the surface elevation and [math]u[/math] is the depth-averaged current velocity. The corresponding schematization is shown in Fig. 6.
Analytical relationships for the tsunami run-up height and run-up velocity, validated with laboratory experiments and advanced numerical models, have been elaborated by Madsen and Schäfer (2010[14]). In the simplest model, a standing sinusoidal tsunami wave at the toe of the shelf/shoreface slope was considered,
[math]\zeta(0,t) = \dfrac{H_0}{2} \cos(\omega t) . \qquad (3)[/math]
According to the theoretical analysis for a non-breaking tsunami wave presented in the article Waves on a sloping bed, the following expressions for the maximum run-up height [math]R[/math] and the maximum run-up velocity [math]V[/math] are found:
[math]R = H_0 \Big( \Large\frac{\pi}{\tan \beta}\normalsize \Big)^{1/2} \Big( \Large\frac{D \omega^2}{g}\normalsize \Big)^{1/4} = 2^{1/4}\pi^{3/4} H_0 \, \Big( \dfrac{D}{H_0} \Big)^{1/4} \, \xi^{-1/2} \, , \quad V = \omega H_0 \Big( \Large\frac{\pi }{4 \beta^3 }\normalsize \Big)^{1/2} \Big( \Large\frac{D \omega^2}{g}\normalsize \Big)^{1/4} = \pi \sqrt{g H_0} \, \Big( \dfrac{\pi D}{2 H_0} \Big)^{1/4} \, \xi^{-3/2} . \qquad (4)[/math]
These simple expressions represent fairly well detailed numerical model results that include wave breaking, bed friction and turbulent energy dissipation[12]. The numerical model gives somewhat higher values of [math]R[/math] and [math]V[/math] for a sandy shore, but in practice the values will be lower due to energy dissipation on obstacles that are generally present in the run-up area [13].
The numerical model [12] also provides results for [math]R[/math] and [math]V[/math] in the case of a breaking tsunami. These results are best approximated by
[math]R = H_0 \, \xi \, , \quad V = 2 \sqrt{g H_0} \, , \qquad (5)[/math]
where [math]H_0[/math] is the height of the tsunami wave when collapsing on the beach. The first expression is similar to the formula established by Hunt (1959[39]) for swash uprush (see the article Swash zone dynamics) and the second expression corresponds to the initial flow velocity after dam break (see the article Dam break flow).
Non-breaking tsunamis occur for large [math]\xi[/math]-values [math]\xi \gt \xi_b[/math], corresponding to a steep shelf slope and long-period tsunamis. Breaking tsunamis occur for small [math]\xi[/math]-values [math]\xi \lt \xi_b[/math], corresponding to gentle shoreface/beach slope and short-period tsunamis. A reasonable estimate is [12],
[math]\xi_b \approx 2 \, (D / H_0)^{1/6} . \qquad (6)[/math]
Semi-empirical modeling
See Discussion page.
Empirical rule
A purely empirical rule for the maximum run-up of a tsunami was proposed by Plafker (1964, unpublised). This rule states that the maximum run-up will not exceed twice the height of the seafloor deformation resulting from a submarine earthquake [16].
Related articles
References
- ↑ 1.0 1.1 1.2 1.3 Röbke, R.B. and Vött, A. 2017. The tsunami phenomenon. Progress in Oceanography 159: 296–322
- ↑ Satake, K., Ishibe, T.,Murotani, S., Mulia, I.E. and Gusman, A.R. 2022. Effects of uncertainty in fault parameters on deterministic tsunami hazard assessment: examples for active faults along the eastern margin of the Sea of Japan. Earth, Planets and Space 74:36
- ↑ Bryant, E.A. 2008. Tsunami: The Underrated Hazard. Springer 2nd edition, Berlin
- ↑ Zhao, G. and Niu, X. 2022. Relation between the period of leading tsunami wave and source parameters. Ocean Engineering 249: 110891
- ↑ Grezio, A., Babeyko, A., Baptista, M.A., Behrens, J., Costa, A., Davies, G., Geist, EL., Glimsdal, S., González, F.I., Griffin, J., Harbitz, C.B., LeVeque, R.J., Lorito, S., Løvholt, F., Omira, R., Mueller, C., Paris, R., Parsons, T., Polet, J., Power, W., Selva, J., Sørensen, M.B. and Thio, H.K. 2017. Probabilistic tsunami hazard analysis: multiple sources and global applications. Rev. Geophys. 55:1158–1198
- ↑ Tinivella, U., Accaino, F. and della Vedova, B. 2008. Gas hydrates and active mud volcanism on the south Shetland continental margin, Antarctic Peninsula. Geo-Mar. Lett. 28: 97–106
- ↑ Monserrat, S., Vilibić, I. and Rabinovich, A.B. 2006. Meteotsunamis: atmospherically induced destructive ocean waves in the tsunami frequency band. Nat. Hazards Earth Syst. Sci. 6: 1035–1051
- ↑ Grilli, S.T., Harris, J.C., Tajalli Bakhsh, T.S., Masterlark, T.L., Kyriakopoulos, C., Kirby, J.T. and Shi, F. 2013. Numerical simulation of the 2011 Tohoku tsunami based on a new transient FEM Co-seismic source: comparison to far- and near-field observations. Pure Appl. Geophys. 170: 1333–1359
- ↑ Murty, T.S. 1977. Seismic sea waves. Tsunamis. In: Stevenson, J.C. (Ed.), Bulletin of the Fisheries Research Board of Canada, vol. 198
- ↑ Bolt, B.A., Horn, W.L., Macdonald, G.A. and Scott, R.F. 1975. Geological hazards. Earthquakes—Tsunamis—Volcanoes—Avalanches—Landslides—Floods. Springer, New York
- ↑ 11.0 11.1 Madsen, P. A., Fuhrman, D. R. and Schäffer, H. A. 2008. On the solitary wave paradigm for tsunamis. J. Geophys. Res. 113, article no. C12012
- ↑ 12.0 12.1 12.2 12.3 12.4 12.5 Larsen, B.E. and Fuhrman, D.R. 2019. Full-scale CFD simulation of tsunamis. Part 1: Model validation and run-up Coastal Engineering 151: 22–41
- ↑ 13.0 13.1 McGovern, D.J., Robinson, T., Chandler, I.D., Allsop, W. and Rossetto, T. 2018. Pneumatic long-wave generation of tsunami-length waveforms and their runup Coastal Engineering 138: 80–97
- ↑ 14.0 14.1 14.2 Madsen, P.A. and Schäffer, H.A. 2010. Analytical solutions for tsunami runup on a plane beach. J. Fluid Mech. 645: 27–57
- ↑ Battjes, J.A. 1974. Surf similarity. Proceedings 14th International Conference on Coastal Engineering, pp. 466–480
- ↑ 16.0 16.1 Synolakis, C.E. and Bernard, E.N. 2006. Tsunami science before and beyond Boxing Day 2004. Phil. Trans. R. Soc. A. 364: 2231–2265
- ↑ Lo, P.H.-Y., Chen, W-Y. and Huang, C-J. 2024. Laboratory investigation on the runup of leading-depression N-waves on a uniform slope. Coastal Engineering 189, 104479
- ↑ National Geophysical Data Center/World Data Service, 2015. Global historical tsunami database. Tsunami event data. <http://www.ngdc.noaa.gov/hazard/tsu_db.shtml>
- ↑ Bryant, E.A., 2008. Tsunami: The Underrated Hazard, second ed. Springer, Berlin
- ↑ Nanayama, F. and Shigeno, K. 2006. Inflow and outflow facies from the 1993 tsunami in southwest Hokkaido. Sed. Geol. 187: 139–158
- ↑ Yeh, H., Sato, S. and Tajima, Y. 2013. The 11 March 2011 East Japan earthquake and tsunami: tsunami effects on coastal infrastructure and buildings. Pure Appl. Geophys. 170: 1019–1031
- ↑ Shinozaki, T., Yamaguchi, N. and Sekiguchi, T. 2020. Flume experiments test grain-size distribution of onshore tsunami deposits. Sedimentary Geology 407, 105750
- ↑ Chagué-Goff, C., Schneider, J.L., Goff, J.R., Dominey-Howes, D. and Strotz, L. 2011. Expanding the proxy toolkit to help identify past events — lessons from the 2004 Indian Ocean Tsunami and the 2009 South Pacific Tsunami. Earth-Science Reviews 107: 107–122
- ↑ Le Roux, J.P. and Vargas, G. 2005. Hydraulic behavior of tsunami backflows: insights from their modern and ancient deposits. Environ. Geol. 49: 65–75
- ↑ Moris, J.P., Kennedy, A.B and Westerink, J.J. 2021. Tsunami wave run-up load reduction inside a building array. Coastal Engineering 169, 103910
- ↑ Lacy, J. R., Rubin, D. M. and Buscombe, D. 2012. Currents, drag, and sediment transport induced by a tsunami. J. Geophys. Res.- Oceans 117 (9), C09028
- ↑ Deep-ocean Assessment and Reporting of Tsunamis, https://www.ndbc.noaa.gov/dart/dart.shtml
- ↑ Schimmels, S., Sriram, V. and Didenkulova, I. 2016. Tsunami generation in a large scale experimental facility. Coast. Eng. 110: 32-41
- ↑ Matsuyama, M., Ikeno, M., Sakakiyama, T. and Takeda, T. 2007. A study of tsunami wave fission in an undistorted experiment. Pure and App. Geophys. 164: 617-631
- ↑ Goring, D. G. 1978. Tsunamis - the propagation of long waves onto a shelf. Ph.D. thesis, California Institute of Technology
- ↑ Synolakis, C. E. 1986. The run-up of long waves. Ph.D. thesis, California Institute of Technology, Pasadena, California
- ↑ Synolakis, C. E. 1987. The run-up of solitary waves. J. Fluid Mech. 185: 523-545
- ↑ Goto, C. and Ogawa, Y. 1997. Numerical method of tsunami simulation with the leapfrog scheme. IUGG/IOC 35, 126)
- ↑ Titov, V. V. and Gonzalez, F. I. 1997. Implementation and testing of the method of splitting tsunami (MOST) model. NOAA Technical Memorandum ERL PMEL- 112
- ↑ Titov, V. V. and Synolakis, C. E. 1998. Numerical modeling of tidal wave runup. J. Waterw. Port C-ASCE 124: 157-171
- ↑ Liu, P. L. F., Woo, S. B. and Cho, Y. S. 1998. Computer programs for tsunami propagation and inundation. Natural Science Foundation
- ↑ Lynett, P. and Liu, P. L.-F. 2002. A numerical study of submarine-landslide-generated waves and run-up. Proc. R. Soc. Lond. A 458: 2885-2910
- ↑ Carrier, G. F. and Greenspan, H. P. 1958. Water waves of finite amplitude on a sloping beach. Jour. Fluid Mech. 4: 97-109
- ↑ Hunt, I.A. 1959. Design of seawalls and breakwaters. J. Waterw. Harbors Division ASCE 85: 123–152
Please note that others may also have edited the contents of this article.
|
