Gravel Beaches
Contents
- 1 Introduction
- 2 Beach Origins
- 3 Sediment classification and properties
- 4 Beach types
- 5 Morphology
- 6 Hydrodynamics
- 7 Barrier beaches
- 8 Sediment transport
- 9 Large scale experimental studies
- 10 Parametric models for equilibrium profiles
- 11 Parametric models for barrier stability
- 12 Modelling cross shore profile development
- 13 Storm erosion and sea level rise
- 14 Suggestions for further research
- 15 Example barrier beaches
- 16 Further reading
- 17 Related articles
- 18 References
Introduction
Gravel beaches are widespread around the world, including the USA, Canada, Japan, Argentina, New Zealand and the wave dominated coastlines of Northern Europe [1]. In the UK, about one third of the coastline is protected by such beaches [2].
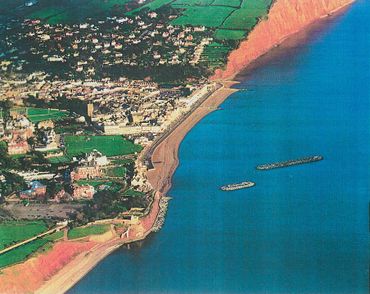
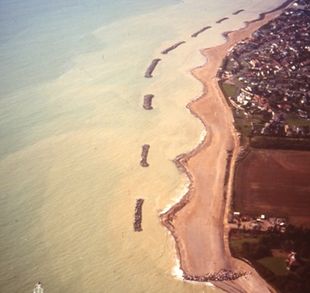
In coastal defence schemes, considerable use is made of coarse-grained (gravel) sediment to replenish eroding beaches, often in conjunction with structures such as rock or wooden groynes or offshore breakwaters. This is because such beaches are known to be an efficient form of natural coastal defence [3][4]. Two examples from the UK are those at Sidmouth, Devon and Elmer, West Sussex.
|
|
| Sidmouth coastal defence scheme | Elmer coastal defence scheme Picture courtesy of the Arun District Council |
Research into the particular characteristics of gravel beaches and their engineering analysis is relatively new, with much of the progress being made recently. In the 1990’s small scale experimental measurements and early field studies lead to the subsequent development of parametric models for profile prediction, longshore transport and the stability of barrier beaches. Since 2002, two major large scale experimental studies and some new comprehensive field studies have been undertaken. Since that time, good progress has also been made in process based numerical modelling systems for long and cross shore transport.
The emphasis of the article is to present in a clear and concise manner the most relevant concepts, basic understanding and insights into the behaviour of gravel beaches, to provide a summary of the available engineering analysis techniques and modelling approaches and to provide guidance to further reading and a list of the most relevant references to work carried out since 1990.
Beach Origins
|
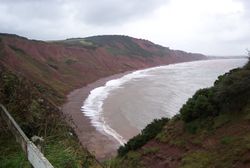
| Sediment supply from soft cliffs © A. J. Chadwick |
The current world’s coastlines were formed as a result of the last ice age, which ended about 10,000 years ago (see the beach management manual [5]). At that time large ice sheets covered more of the world’s land masses than they do at present. As they melted there was a rapid rise of sea level (about 120 m between 20,000 and 6000 years ago). Vast quantities of sediment were carried by rivers to the sea during this period, eventually forming the pre-cursor to our present coastlines as the rate of sea level rise rapidly reduced about 6000 years ago. Much of our beaches today are composed of the remnants of these sediments, composed predominantly of sand and gravel. These sources of beach material have subsequently been supplemented by coastal erosion of soft cliffs and the reduced but continuing supply of sediments from rivers. Material has also been derived from offshore banks left behind by relatively rapid rises of sea level after cold episodes in the earth’s climate.
Sediment classification and properties

|
|

|
|
| all pictures: © A. J. Chadwick | |
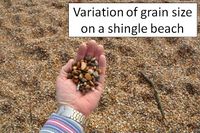
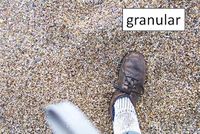
Traditionally sand and gravel sizes have been classified according to the Wentworth scale. This defines sand as being of diameter between 0.0625 mm to 2mm. Material sizes larger than this are classified as gravel, subdivided into granular (2 mm to 4 mm), pebble (4mm to 64 mm), cobble (64 mm to 256 mm) and boulder (>256 mm). Rounded gravel, typical of a significant number of UK beaches, is referred to as shingle.
There are several physical properties of sand and gravel beaches which are important in the study of coastal sediment transport. The first is the sediment density ([math]\rho_s[/math]), typically 2650 kg/m³ for quartz. The rest are required in recognition of the fact that a beach comprises a mixture of the beach material, interspersed with voids which may be filled with air or water. Thus the bulk density ([math]\rho_b[/math]) is defined as the in situ mass of the mixture/volume of the mixture, the porosity ([math]p_s[/math]) as the volume of air or water/volume of the mixture, typically between 0.25 to 0.4 for a gravel beach, the voids ratio ([math]e[/math]) as the volume of air or water/volume of the grains, typically between 0.33 to 0.66 for a gravel beach, and finally the angle of repose ([math]\phi[/math]), which is the limiting slope angle at which the grains begin to roll, typically about 35° in air. In water this reduces to about 30°.
The material sizes on any particular beach will normally comprise a range of grain sizes, thus it is standard practice to measure the grain size distribution by a sieve analysis from which the percentage by weight of material passing through a range of sieve sizes is plotted against particle size. The median size is denoted by [math]D_n[/math], representing the diameter for which [math]n \%[/math] of the grains by mass are finer. The spread of sizes is often indicated by the values of [math]D_{85}[/math] and [math]D_{16}[/math] and their ratio is used to measure the degree of sorting. A well sorted sample is one in which there is a small range of sizes ([math]D_{85}/D_{16} \lt 2 [/math]), whereas a well mixed sample has a large range of sizes ([math]D_{85}/D_{16} \gt 16 [/math]).
Beach types
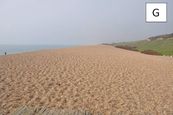
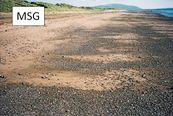
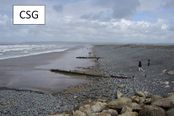
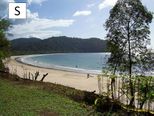
Beaches types may be categorised according to the mixture of sands and gravels present, which has a significant influence on the beach slope and the more general morphological response of the beach to wave action. Four categories are defined as pure gravel (G), mixed sand and gravel (MSG), composite sand and gravel (CSG) and pure sand (S).
Morphology
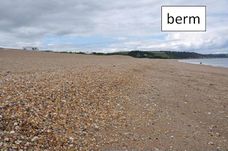
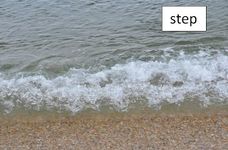
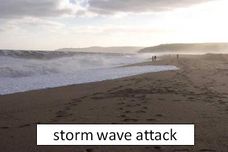
The characteristics of a gravel beach are very different from those of a sand beach. Most notably, gravel can support a steep gradient typically of the order of 1 in 8 with a tendency to form a near vertical berm towards the high water mark and a (submerged) step at the wave break point. Swell wave conditions promote onshore accretion in the swash zone, with storm conditions promoting rapid offshore erosion. Despite the large grain size, the sediment is highly mobile. Changes in the vertical profile of the order of 0.5 m are commonly found over just one tidal cycle for moderate to large waves [6].
|
|
| all pictures: © A. J. Chadwick |
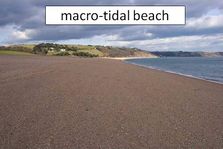
On macro-tidal beaches, the active swash zone continuously re-works the beach face as the tide rises and falls. At low tide, it is common to observe a berm at the high water mark of the beach below which is a beach face of uniform slope, which ends in the step feature at the low water mark.
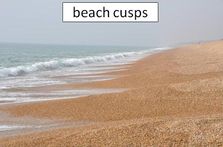
Cusp formation on gravel beaches is another distinctive feature. They can form rapidly when the wave approach is near normal, but are also washed out rapidly when the wave approach changes to an oblique angle. In the literature, two dominant models of cusp formation are recognised, namely edge wave forced and swash circulation/self organisation modes (see Beach Cusps). However, cusp formation on gravel beaches has not been discussed very much in the literature [7].
Hydrodynamics
|
| © A. J. Chadwick |
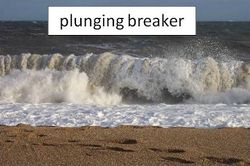
The steep beach gradient allows waves to progress much closer inshore before breaking, often resulting in a single plunging breaker. Consequently, there is minimal generation of Infragravity waves. Even during storms, a wide surf zone is rare. An important consequence of this is that the swash zone can be of similar width to the surf zone and hence the sediment transport within the swash zone is of considerably more significance than on sand beaches. A second effect of the steep beach gradient is that refraction processes are also confined to a narrower zone than is experienced on a sand beach, with the result that refraction is often observed to be incomplete and the waves arrive at the beach face with some considerable angle, resulting in significant longshore transport. Gravel beaches are also much more reflective than sand beaches, with reflection coefficients of up to about 0.2.
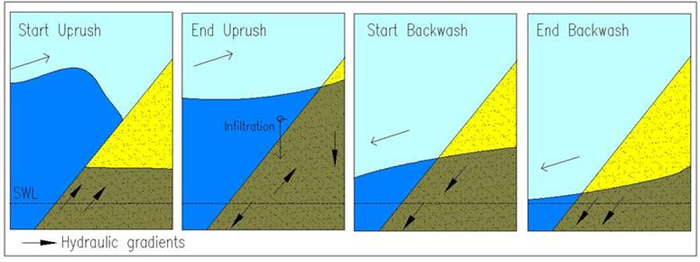
Another distinguishing characteristic is the high permeability of gravel which, compared to a sand beach, increases the potential for infiltration during the swash uprush and exfiltration during the swash downrush. This induces a downward, stabilising force on sediment movement during the uprush and a lift force during backwash. Conversely, there is a thinning of the boundary layer during uprush, leading to increased shear stress on the bed and a thickening during backwash, leading to deceased shear stress on the bed. This latter effect is thought to predominate. On a gravel beach the backwash volume can also be considerably reduced, lowering the backwash velocities (see Swash zone dynamics). It is these processes that lead to the formation of the high water mark berm.
Barrier beaches
|
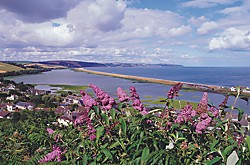
Barrier beaches are a common geomorphological feature across the world, many of which are composed of gravel. Their essential features comprise a narrow, elongated ridge of sand or gravel existing slightly above the high tide level. The ridge generally extends parallel to the shore, but is separated from it by a wetland, lagoon or a tidal flat. Barrier beaches act as natural means of coast protection. In addition, wetlands and lagoons formed behind barrier beaches provide shelter for many coastal habitats and are therefore of considerable environmental significance. One explanation of their formation is that they have been formed by landward migration of submerged sand/shingle banks with rising sea levels since the last ice age.
Barrier beaches are constantly evolving in response to short and long term processes. Short term changes in barrier beaches are related to local wave and current climate, tidal variations, frequency and magnitude of storm events, barrier geometry and type of beach sediment and permeability. Over longer terms, the primary factors for change and modification of barrier beaches are sea level rise, longshore sediment transport and changes in sediment sources and/or sinks according to Orford et al. (1995) [8].
A barrier beach can respond to these factors by landward or seaward migration, reshaping and re-alignment and crest breakdown or build-up [9]. The episodic processes of overwashing and associated breaching are the primary phenomena behind long term evolution.
Sediment transport
Understanding the processes of sediment transport on gravel beaches is important for beach management which requires some quantification of shoreline evolution. The vast majority of coastal engineering projects still rely on one-line models since, as yet, 3D morphodynamic models are restricted to short- and medium-term predictions and none have been validated against coarse-grained field data. Most one-line models make use of empirical total longshore transport equations (see Sand transport). Hence, the formulation of a reliable estimate of longshore sediment transport rate remains of considerable practical importance in coastal engineering applications such as feasibility studies of port extensions, derivation of sediment budgets for coastal areas and the appraisal of long term beach stability.
To some extent, the mechanisms associated with the longshore transport of gravel may be differentiated from that of sand. Generally, for a sand seabed the oscillatory force due to the passage of a (breaking) wave will tend to stir the sediment into motion. The bed shear due to the longshore current can then transport the sand. On gravel beaches the sediment normally moves as bedload and is largely confined to the swash zone. As the flow in the uprush is perpendicular to the wave crest and in the backwash is perpendicular to the beach contours, the gravel describes a 'sawtooth', or zig-zag, path along the beach.
Quantitative estimation of sediment transport rates is extremely difficult on a gravel beach. Direct measurement of longshore transport has been attempted using a variety of techniques, such as deposition of a tracer material (radioactive, dyed or artificial sediment) or installation of traps (see Van Wellan et al. (2000) [6] for a review).
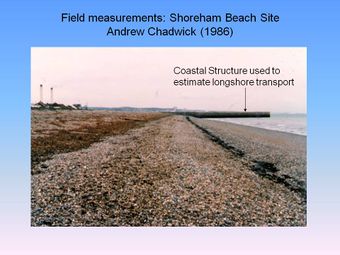
Changes in beach volumes may be calculated from data derived from ground or aerial surveys. If surveys are carried out over several years a trend for accretion or depletion may be discernible. This is not necessarily a direct measure of the longshore transport rate along the coast. Rather it is an indication of any imbalances in the supply of sediment from one point to another. However, where marine structures are constructed which cut of the supply from further up the coast, comparisons of beach volumes before and after construction can give some indication of the longshore transport rates.
|
|
|
| all pictures: © A. J. Chadwick |
The most widely used formula for calculating longshore transport is the CERC equation (US Army Corps of Engineers, 1984). The equation was derived from sand beaches and has been developed over a number of years. The formula is intended to include both bedload and suspended load and is usually given in the form of:
[math]I_{ls} = KP_{ls} [/math]
where
[math]I_{ls} [/math] is the immersed weight sediment transport rate
[math]P_{ls} [/math] is the longshore component of wave power
[math]P_{ls} = (EC_{g})_{b} \sin \theta_{b} \cos \theta_{b}[/math]
where [math]E[/math] is wave energy, [math]C_{g}[/math] is group wave speed, [math]\theta[/math] is wave approach angle, subscript [math]_b[/math] refers to wave break point
and where [math]K[/math] is a dimensionless empirically derived coefficient. The volumetric transport rate, [math]Q_{ls}[/math], is related to [math]I_{ls}[/math] by:
[math]Q_{ls} = \large\frac{I_{ls}}{\tau}[/math]
where
[math]\tau= \large\frac{(\rho_{s}-\rho)g}{1+e}[/math]
where [math]\rho_s[/math] is sediment density, [math]\rho[/math] is sea water density, [math]e[/math] is voids ratio.
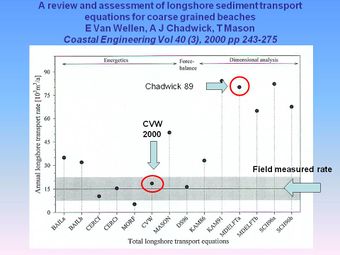
There is no direct inclusion of the influence of grain size in the CERC equation, other than via the coefficient, [math]K[/math]. It should be noted that for random waves, the choice of wave height used in the CERC equation (significant wave height, [math]H_s[/math] or root mean square wave height, [math]H_{rms}[/math], see Statistical description of wave parameters) must be correlated with the [math]K[/math] value. Much confusion can arise, as some authors have used [math]H_s[/math] and others [math]H_{rms}[/math] without explicitly stating which one. For Rayleigh distributed waves, the [math]K[/math] value using [math]H_{rms}[/math] is twice that using [math]H_s[/math]. A suggested value for [math]K[/math] using [math]H_{rms}[/math] is 0.77 for sand sized sediments. For gravel beaches, Chadwick’s (1989) data suggested a [math]K[/math] value of [math]7\%[/math] of that for sand ([math]K=0.053[/math]). This was later found to work well at another beach site, Slapton Sands, Devon,UK (see Alegria-Arzaburu & Masselink (2010) [10]).
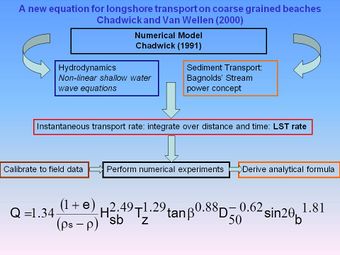
Chadwick (1991) [11][12] also developed a numerical model to predict longshore transport on gravel beaches. The hydrodynamic module uses the non-linear shallow water wave equations, which predict the instantaneous water levels and velocities throughout the surf and swash zones. These are combined with a sediment transport module based on Bagnold's stream power concept. Instantaneous transport rates across the surf and swash zones are subsequently summed in space and time to determine the total longshore transport rate. Thus, this model specifically includes a sediment threshold term and transport in the swash zone, both of which are of importance on shingle beaches. The model required calibration of only the friction coefficient, which was determined from field data. Subsequently, an algebraic formula (the Chadwick-Van Wellen formula) was derived from the numerical model results given by:
This equation was specifically designed for application to gravel beaches but has only been calibrated to the data from one field site. For further details of this and other longshore transport equations, applicable to gravel beaches, see Van Wellen et al (2000) [6].
Large scale experimental studies
|
| © A. J. Chadwick |
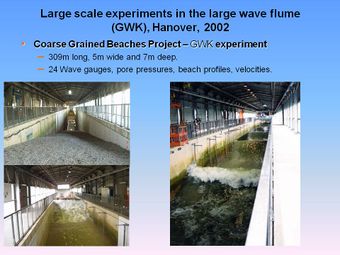
More recent work on coarse grained beaches was undertaken by the EU project “Large Scale Modelling of Coarse Grained Beaches” which was undertaken between March-May 2002. The experiment was conducted at full scale, thus avoiding the sediment scaling issues inherent in small scale models. The measurements included not only the wave field and resultant equilibrium profile development, but also detailed measurements of pore water pressures under the swash face. The experimental results of this work may be found in López de San Román-Blanco et al (2006) [13]. This experiment was used to develop the cross shore profile model of Pedrozo et al (2006) [14], described in more detail in this article.
Subsequently another large scale experimental study of gravel barrier beaches was undertaken in BARDEX (Barrier Dynamics Experiment) in the Delta wave flume, the Netherlands, during June and July 2008. One unique aspect of this work was the inclusion of the effects of a back barrier lagoon in conjunction with a varying tidal level. A special edition of Coastal Engineering has been devoted to papers resulting from this work (see Turner and Masselink (2012)) [15]. These include details of the observations, the effect of the lagoon water level on the beach profile, new measurements of and prediction techniques for wave friction factors, new predictive techniques for assessing barrier overwashing and overtopping and an assessment of the XBeach model used to predict beach profile evolution and the morphological effect of washover.
Parametric models for equilibrium profiles
The prediction of the expected profile for a gravel beach is very different from the concepts used for equilibrium profiles on a sand beach. The problem was first comprehensively addressed by van der Meer (1988) [16] and Powell (1990) [3], based on extensive scaled laboratory flume tests (small scale with anthracite in Powell’s case and large and small scale with gravel in van der Meer’s case). Powell’s work resulted in the development of a parametric profile model, which described the profile as a set of three curves: from the crest to the still water level, from the still water level to a transition point and from the transition point to the base of the profile. This was found to work well using the data from the GWK experiment [13]).
Parametric models for barrier stability
Bradbury (2000) [17] carried out a series of 3-D mobile bed laboratory tests on barrier crest response to hydrodynamic conditions and initial barrier geometry. Based on the model investigations, several categories of barrier response to hydrodynamic conditions were identified and underlying characteristics were qualitatively defined. These included crest raised by overtopping, crest lowered due to undermining of crest but with no overtopping, crest raised by over-washing with roll-back, crest lowered by over-washing with roll-back and finally, no change to the crest elevation with profile contained to seaward of the barrier crest.
He developed an expression for an over-washing threshold of barrier crests, based on regression analysis. It is a function of wave steepness (wave height/wavelength, [math]H_s/L_m[/math]), barrier free board (still water depth above barrier crest, [math]R_c[/math]) and barrier cross-sectional area [math]B_a[/math] (above the still water level), given by:
[math]\large\frac{B_aR_c}{H_s^3}\normalsize \leq 0.0006 (\large\frac{H_s}{L_m})^{-2.54}[/math]
The expression was validated against field data gathered at Hurst Spit, UK and found to be consistent with the field data. In addition, a conceptual model for barrier over-washing was formulated. According to his model, the beach will initially attempt to reach a dynamic equilibrium; if the critical barrier inertia [math](\large\frac{B_aR_c}{H_s^3})[/math] is exceeded then the crest will be lowered by over-washing.
Modelling cross shore profile development
|
| Picture courtesy of A. Pedrozo-Acuna |
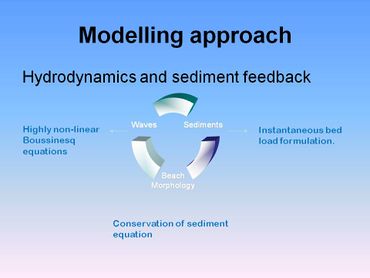
The first of several recent deterministic process based models for predicting the profile response of coarse grained beaches was developed by Lawrence, Chadwick and Fleming (2001) [18]. It was shown that Boussinesq equations coupled with a bed load sediment transport formulation were a useful approach for process-based modelling of gravel beach profile evolution. This model was subsequently extended to model the sediment transport of grain size fractions and thus to predict sediment sorting across the beach face [19]. However, it was found that this numerical model scheme was not stable on steep beaches.
Subsequently, using a newer Boussinesq model, Pedrozo et al (2006) [14] demonstrated that the two principle sediment parameters of friction ([math]f[/math]) and sediment transport efficiency ([math]C[/math]) were controlling the shape of the gravel beach profile. With [math]f[/math] and [math]C[/math] as constant values, accurate prediction of the profile evolution was not possible. The use of bigger friction factors in the uprush slightly improved the prediction. When larger values of the sediment transport efficiency ([math]C[/math] -value) were used in the uprush compared to the backwash, better predictions of the beach profile resulted. The physical processes which dictate the differences between the predicted and measured profiles were hypothesised as being related to infiltration effects on the flow above the beach face and more accelerated flow in the uprush. Further developments coupling the effects of infiltration/exfiltration with sediment movement were still required at that time. The more recent results reported by Jamal et al (2010) [20] and Williams et al (2012) [21] indicate that including this process leads to significant improvements in prediction. Pedrozo et al (2010) [22] have also highlighted the importance of the impulsive pressures induced by plunging breakers on gravel beach sediment transport.
More accurate numerical simulations of the morphodynamics of gravel beaches have become possible with the development of the XBeach-G model[23], an adaptation of the XBeach model[24] specifically tuned to gravel coasts. XBeach-G therefore includes terms for the application of (1) a non-hydrostatic pressure correction term that allows wave-by-wave modelling of the surface elevation and depth-averaged flow; (2) sediment transport relations that account for gravel bed load transport; and (3) a groundwater model that allows infiltration and exfiltration through the permeable gravel bed to be simulated. The capability of the XBeach-G model to simulate observed behaviour of gravel beaches and barriers under storm conditions has been successfully tested in several situations[25] [26] [27].
Storm erosion and sea level rise
Gravel beaches and gravel barriers are often found on storm-dominated coasts; high waves are needed to bring (coarse) gravel ashore. Gravel beaches are therefore adapted to a stormy climate and capable to recover from storm erosion. However, extreme storms can bring gravel out of reach from the energetic but less extreme waves that are needed for beach or barrier recovery. Gravel from the beach is partially lost to depths too large for wave induced onshore transport[28][29]. Gravel from barriers is lost onshore by overwashing, resulting in lowering of the barrier and increased sensitivity to new overwash. Recovery from extreme storms can occur if gravel is naturally supplied from updrift sources by longshore transport. In this case the barrier crest can be rebuilt by slightly overtopping waves[30]. Artificial nourishment is required otherwise.
Sea level rise is a major challenge for gravel coasts. Gravel barriers can retreat by overwashing if sufficient landward space is available - a process called rollover. Keeping the barrier in place by nourishment is only an option if the submarine slope is nourished as well. Otherwise the steepened foreshore undermines the stability of the barrier[31]. The same holds for adapting a gravel beach to sea level rise through nourishment.
Suggestions for further research
For all budding researchers in coastal research, the further study of gravel and mixed beaches offers much opportunity to enhance our knowledge. Longshore transport prediction is still imprecise and cross shore processes very complex and not completely understood. Current parametric design methods leave much to be desired. Further field and large scale experimental studies remain a primary tool for advancing our understanding of long and cross shore processes. These will need to stand on the heads of the previously mentioned studies. Numerical modelling tools can still benefit greatly from improved process representation, including infiltration/exfiltration, interactions with groundwater flows, impulsive pressure forces, the incorporation of grain size fractions and the prediction of sediment sorting across the beach face.
Example barrier beaches
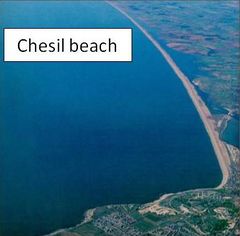
|
Chesil
Chesil Beach, Dorset UK, is a world famous gravel barrier beach. It is approximately 28 kilometres long and, on average, 160 metres wide. The height of the beach is typically 11 metres above mean sea level. The beach stabilised close to its present position around 5000 years ago.
A rent research paper concerning the internal structure of Chesil beach (Bennett et al (2009)) [32] also contains a good summary of the extensive historical literature on this beach. There is an informative web site at www.chesilbeach.org.
Slapton
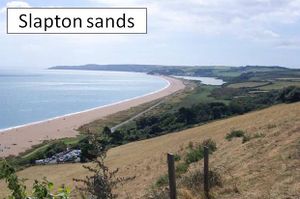
A comprehensive assessment of the historical development and contemporary processes affecting a significant gravel barrier beach system in the UK (Slapton Sands, South Devon UK) may be found in Chadwick et al (2005) [33] and a short summary of these studies is presented elsewhere in the coastal wiki (Slapton barrier beach case study, UK).
The paper includes assessment of the effects of sea level rise on barrier migration and its susceptibility to over-washing and overtopping, inter alia. It was found that the processes at work on the Slapton shoreline included:
|
| © A. J. Chadwick |
- Short-term changes in beach profile due to storms, acting over a period of several days. These storms cause cut-back of the seaward edge of the shingle crest, or changes in crest elevation
- Wave overtopping, in which wave action throws water and sediment onto the crest.
- Overflowing, or overwashing, where extremely high water levels coincident with wave action cause water to flow over the crest of the ridge. This can cause significant changes to the crest and backslope of the ridge.
- Medium-term changes in beach width and profile due to longshore transport, occurring over a period of months or several years.
- Long-term landward retreat; the barrier beach responds to sea level rise by “roll-over” and by increasing its crest height. This process involves overwashing, transferring sediment from the shore-face to the back barrier area. This is an episodic rather than a continuous process.
- Planform change; as the barrier beach is pinned by hard rock cliffs at either end (Strete and Torcross), landward retreat results in a gradual increase in both curvature and length.
In a later comprehensive field study of this site, Alegria-Arzuburu and Masselink (2010) [10] used an ARGUS video system to monitor short and medium term changes. This study confirmed many of the conclusions reached in the Chadwick study and demonstrated the importance of storm sequencing to both long and cross shore processes which affect beach erosion and accretion.
Further reading
An up to date and comprehensive review of gravel beaches and barriers may be found in Anthony (2008) [7]. Gravel beach dynamics are reviewed by Buscombe and Masselink (2006) [1]. Stripling et al (2008) [34] present a good review of barrier beaches and their management.
Finally, the Beach management manual (2010) [5] provides information on state-of-art methods, guidance on beach monitoring and maintenance, evaluation of the state and performance of a beach, design, procurement, execution and the after-care of beach improvement schemes. It also includes case studies to illustrate popular management techniques and draws from experience of existing management approaches.
Related articles
- Characteristics of sedimentary shores
- Coastal and marine sediments
- Swash zone dynamics
- Sand transport
- Sediment transport formulas for the coastal environment
- Littoral drift and shoreline modelling
- Coastal Hydrodynamics And Transport Processes
- Infragravity waves
References
- ↑ 1.0 1.1 Buscome D., Masselink G. (2006). Concepts in gravel beach dynamics. Earth science Reviews 79 33-52.
- ↑ Fuller, R. M. & Randall, R. E. (1988). The Orford Shingles, Suffolk, UK. Classic conflicts in coastline management. Biological conservation.
- ↑ 3.0 3.1 Powell, K. A. (1990). Predicting short term profile response for shingle beaches. HR Wallingford Report SR 219.
- ↑ Diserens, A. P. & Coates, T. T. (1993). UK South Coast shingle beach study: storm response of shingle beaches. HR Wallingford Report SR 323.
- ↑ 5.0 5.1 CIRIA (2010). Beach management manual, Second Edition. Publication no. RP787, London. Available at: http://www.ciria.org/service/free_publications/AM/ContentManagerNet/ContentDisplay.aspx?Section=free_publications&NoTemplate=1&ContentID=17783
- ↑ 6.0 6.1 6.2 Van Wellen, E, Chadwick, A J and Mason, T (2000). A review and assessment of longshore sediment transport equations for coarse grained beaches. Coastal Engineering, 40, 3, 243-275.
- ↑ 7.0 7.1 Anthony E. J. (2008). Gravel beaches and barriers. Developments in Marine Geology, Vol 4, 289-324.
- ↑ Orford, J.D., Carter, R.W.G., Jennings, S.C. and Hinton, A.C. (1995). Processes and time scales by which a coastal gravel dominated barrier respond geomorphologically to sea level rise-Story Head Barrier, Nova-Scotia, Earth Surface process and Land Forms, 20(1), pp.21-37.
- ↑ Carter, R.W.G., Forbes, D.L., Jennings, S.C., Orford, J.D., Shaw, J. and Taylor, R.B., (2003). Barrier and lagoon coast evolution under differing relative sea level regimes-examples from Ireland and Nova-Scotia, Marine Geology, 88, Issue 3-4, pp.221-242.
- ↑ 10.0 10.1 Ruiz de Alegria-Arzaburu, A., Masselink, G. (2010). Storm response and beach rotation on a gravel beach, Slapton Sands, U.K Marine Geology 278, 77–99.
- ↑ Chadwick, A J. (1991). An unsteady flow bore model for sediment transport in broken waves Part 1: The development of the numerical model. Proc. Instn. Civ. Engrs. Part 2, 1991, 91, Dec. 719 - 737.
- ↑ Chadwick, A J. (1991). An unsteady flow bore model for sediment transport on broken waves Part II: The properties, calibration and testing of the numerical model. Proc. Instn. Civ. Engrs. Part 2, 1991, 91, Dec., 739-753.
- ↑ 13.0 13.1 López de San Román-Blanco, B., Coates, T., Holmes, P., Chadwick, A. J., Bradbury, A., Baldock, T., Pedrozo-Acuña, A., Grüne, J. (2006). Large scale experiments on gravel and mixed beaches: experimental procedure, data documentation and initial results. Coastal Engineering 53 (4), 349-363.
- ↑ 14.0 14.1 Pedrozo, A., Simmonds, D.J., Otta, A.K., Chadwick, A.J. (2006). On the cross-shore profile change of gravel beaches. Coastal Engineering, 53 (4), 335-347. Cite error: Invalid
<ref>tag; name "Pedrozo" defined multiple times with different content - ↑ Ian L. Turner, Gerd Masselink (2012). Coastal gravel barrier hydrology — Observations from a prototype-scale laboratory experiment (BARDEX). Coastal engineering, 63, 13-22
- ↑ Van der Meer J. (1988) Rock slopes and gravel beaches under wave attack. Delft Hydraulics Publications n 396.
- ↑ Bradbury, A.P. (2000). Predicting breaching of shingle barrier beaches- recent advances to aid beach management, 35th MAFF (DEFRA) Conf of River and Coastal Engineers.
- ↑ Lawrence, J, Chadwick, A J and Fleming, C A. (2001). A phase resolving model of sediment transport on coarse grained beaches. In: Billy L Edge (ed) Coastal Engineering 2000, 624-636. American Society of Civil Engineers: Reston, Virginia.
- ↑ Lawrence, J, Karunarathna, H, Chadwick, A J and Fleming, C A. (2003). Cross-shore sediment transport on mixed coarse grain sized beaches: modelling and measurements. Proceedings of the International Conference on Coastal Engineering 2002
- ↑ Jamal, M.H., Simmonds, D.J., Magar, V., Pan, S., (2010). Modelling infiltration on gravel beaches with an XBeach variant. Proc.32nd Conf. on Coastal Eng., Shanghai, China, 2010, sediment, p. 41 http://journals.tdl.org/ICCE/issue/view/154/showToc.
- ↑ Williams, J.J., Ruiz de Alegría-Arzaburu, A., McCall, R.T., Van Dongeren, A. (2012). Modelling gravel barrier profile response to combined waves and tides using XBeach: Laboratory and field results. Coastal engineering, 63, 62-80
- ↑ Pedrozo-Acuña, A., Torres-Freyermuth, A., Zou, Q., Hsu, T.-J., Reeve, D.E. (2010). Diagnostic modelling of impulsive pressures induced by plunging breakers. Coastal Engineering 57 (3), 252–266.
- ↑ McCall, R.T., Masselink, G., Poate, T.G., Roelvink, J.A., Almeida, L.P. (2015). Modelling the morphodynamics of gravel beaches during storms with XBeach-G. Coastal Engineering 103, 52–66
- ↑ Roelvink, D., Reniers, A., van Dongeren, A., van Thiel de Vries, J., McCall, R., Lescinski, J. (2009). Modelling storm impacts on beaches, dunes and barrier islands. Coastal Engineering 56, 1133–1152
- ↑ Masselink, G., McCall, R., Poate, T., van Geer, P. (2014). Modelling storm response on gravel beaches using XBeach-G. Maritime Engineering 167, 173–191
- ↑ Suanez, S., Stéphan, P., Floc’h, F., Autret, R., Fichaut, B., Blaise, E., Houron, J., Ammann, J., Grandjean, P., Accensi, M., André, G., Ardhuin, F. (2018). Fifteen years of hydrodynamic forcing and morphological changes leading to breaching of a gravel spit, Sillon de Talbert (Brittany). Geomorphogie 24, 403–428
- ↑ Almeida, L.P., Masselink, G., McCall, R., Paul Russell, P. (2017). Storm overwash of a gravel barrier: Field measurements and XBeach-G modelling. Coastal Engineering 120, 22–35
- ↑ Anthony, E.J., Cohen, O., Sabatier, F. (2011). Chronic offshore loss of nourishment on Nice beach, French Riviera: A case of over-nourishment of a steep beach? Coastal Engineering 58, 374–383
- ↑ Scott, T., Masselink, G., O'Hare, T., Saulter, A., Poate, T., Russell, P., Davidson, M., Conley, D. (2016). The extreme 2013/2014 winter storms: Beach recovery along the southwest coast of England. Marine Geology 382, 224–241
- ↑ Orford, J.D., Carter, R.W.G. (1982). Crestal overtop and washover sedimentation on a fringing sandy gravel barrier coast, Carnsore Point, Southeast Ireland. Journal of Sedimentary Research 52 (1), 265‑278
- ↑ Orford, J., Anthony, E.J. (2022). Treatise of geomorphology. 8.13 Coastal Gravel Systems. Elsevier.
- ↑ Bennett M. R., Cassidy N. J., Pile J. (2009). Internal structure of a barrier beach as revealed by ground penetrating radar (GRP) Chesil beach, UK. Geomorphology 104, 218-229.
- ↑ Chadwick, A. J., Karunarathna, H., Gehrels, R, Massey, A. C.,O’Brien, D. ,Dales, D.(2005). A New Analysis of the Slapton Barrier Beach System. Maritime Engineering 158, 4, 147-161
- ↑ Stripling A., Bradbury, A.P., Brampton, A.H. and Cope S.N. (2008) Understanding Barrier Beaches Joint DEFRA/EA Flood and Coastal Erosion Risk Management R&D Programme. Technical Report FD1924/TR
Please note that others may also have edited the contents of this article.
|
