Littoral drift and shoreline modelling
Littoral drift, the wave-driven longshore transport of sediment, plays a major role in shoreline dynamics. Human-induced modification of littoral drift is a ubiquitous cause of coastal erosion (see Human causes of coastal erosion). Measuring littoral drift in field situations is notoriously difficult and generally subject to great uncertainty. Therefore, model estimates are often used in practice. A simple, popular model is the so-called 1-line model, derived from shallow-water wave theory. In this article a generalized version of this model (called GENESIS [1]) is presented, together with conditions and prescriptions for practical application.
Contents
- 1 The One-Line Concept
- 2 Representation of Currents
- 3 Representation of Offshore Contours
- 4 Representation of Variable Transmission Coefficient for Submerged Breakwaters
- 5 Representation of Tombolos
- 6 Related articles
- 7 Appendix: Derivation of Eq. (2)
- 8 Appendix: Approximate analytical solution
- 9 References
The One-Line Concept
Gradients in longshore sand transport are not the only cause of shoreline change. Changes also arise from cross-shore transport, which can move the shoreline landward or seaward in response to alternating episodes of calm and stormy wave conditions. However, changes in shoreline position usually recover after some time, see for example Shoreline retreat and recovery. Longshore sand transport is therefore the main process determining long-term trends in shoreline change[2].
The 1-line concept rests on a common observation that the beach profile maintains an average shape that is characteristic of the particular coast, apart from times of extreme change as produced by storms. For example, steep beaches remain steep and gently sloping beaches remain gentle in a comparative sense and in the long term; the deviation from an average beach slope over the total active profile is relatively small.
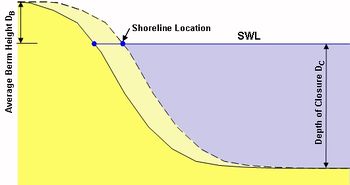
Pelnard-Considere (1956)[3] originated a mathematical theory of shoreline response to wave action under the assumption that the beach profile moves parallel to itself, i.e., that it translates shoreward and seaward without changing shape in the course of eroding and accreting. If the profile shape does not change, any point on it is sufficient to specify the location of the entire profile with respect to a baseline (Fig. 1). Thus, one contour line can be used to describe change in the beach plan shape and volume as the beach erodes and accretes. This contour line is conveniently taken as the readily observed shoreline, and the model is therefore called the "shoreline change" or "shoreline response" model. Sometimes the terminology "one-line" model, a shortening of the phrase "one-contour line" model is used with reference to the single contour line.
[math] \large\frac{\Delta y}{\Delta t}\normalsize + \large\frac{1}{(D_B + D_C)} \frac{\Delta Q}{\Delta x}\normalsize = 0 . \qquad (1) [/math]
The model also requires predictive expressions for the total longshore sand transport rate. For open-coast beaches, the transport rate is a function of the breaking wave height and direction alongshore. The predictive formula for the longshore sand transport rate used in GENESIS is (see the Appendix for a derivation):
[math] Q = (H^2 C_g)_b (a_1 \sin {2 \alpha_{bs}} + a_2 \cos {\alpha_{bs}} \Large\frac {\partial H_b}{\partial x}\normalsize) , \qquad (2) [/math]
in which [math]H[/math]= wave height, [math]C_g[/math]= wave group speed given by linear wave theory, [math]_b[/math]= subscript denoting wave breaking condition, and [math]\alpha_{bs}[/math]= angle of breaking waves to the local shoreline.
The nondimensional parameters [math]a_1[/math] and [math]a_2[/math] are given by
[math] a_1 = \large\frac {K_1}{16 (s - 1)(1 - p)W}\normalsize \qquad (3a) [/math]
and
[math] a_2 = \large\frac {K_2}{8 (s - 1)(1 - p)W \tan \beta}\normalsize \qquad (3b) [/math]
Representation of Currents
By writing the transport rate in terms of immersed weight, [math]I_l [n/s][/math], Eqs. (1) and (2) may be expressed as,
[math] I_l = (E C_g)_b (K_1 \sin { \alpha_{b}} \cos {\alpha_{b}} - K_2 \Large\frac { \cos {\alpha_{b}}}{ \tan {\beta}} \frac {\partial H}{\partial x}\normalsize) \qquad (4) [/math]
where [math]E[/math] is the wave energy density [J/m2]. The classical ‘CERC’-equation for calculating the longshore sediment transport rate is formulated as,
[math] I_l = (E C_g)_b K_1 \sin { \alpha_{b}} \cos {\alpha_{b}} \qquad (5) [/math]
which is identical to the first term in the GENESIS transport relation as given in Eq. (2). Following the formula proposed by Bagnold (1963)[4], Eq. (5) can be modified to explicitly represent a longshore current as,
[math] I_l = K_3 (E C_g)_b \cos {\alpha_{b}} \Large\frac{v_l}{u_m}\normalsize \qquad (6) [/math]
where K3 is a dimensionless coefficient, vl is the average longshore current in the surf zone, and um is the maximum wave-induced near-bottom horizontal velocity at wave breaking which may be written as,
[math] u_m = ( \Large\frac {2 E_b} {\rho h_b} )^{1/2}\normalsize = ( \Large\frac {\gamma g H_b} {4 * 1.416} )^{1/2}\normalsize \qquad (7) [/math]
where [math]h_b[/math] is the breaker depth, [math]\gamma[/math] is the breaker index, and [math]g[/math] is the acceleration due to gravity. By using Eq. (6), the longshore sediment transport rate is no longer restricted to being generated exclusively by breaking waves; the longshore current may originate from other mechanisms as discussed further by Komar and Inman (1970)[5] and Kraus et al. (1982)[6], for example, as generated by the tide or the wind.
Thus, by assuming shallow water conditions at the location of wave breaking, the wave group velocity [math]C_{gb}[/math] may be approximated,
[math] C_{gb} \approx C_b \approx \sqrt {g h_b} \approx \sqrt { g H_b / \gamma} \qquad (8) [/math]
where [math]C_b[/math] is the wave breaking celerity. Inserting Eq. (7) into Eq. (6) yields
[math] I_l = \large\frac {K_3}{4 * 1.416^2}\normalsize ( g / \gamma )^{1/2} \rho H_b^{1.5} C_g v_l \alpha_{bs} \qquad (9) [/math]
If the longshore current [math]v_l[/math] comprise of a wave generated current [math]v_b[/math] alone, it may be calculated as (Lonquet-Higgins 1970[7], see also Shallow-water wave theory)
[math] v_l = v_b = K_4 u_m \sin \alpha_b \qquad (10) [/math]
where [math]K_4[/math] is an empirical coefficient for which Komar and Inman (1970)[5] suggested [math]K_4=2.7[/math]. By combining Eqs. (5), (6), and (10) we obtain [math]K_4=K_1/K_3=0.28[/math]. Thus, with only wave generated currents taken into account, Eqs (6) and (10) together are compatible with the ‘CERC’ equation but are still able to account for currents of different origin.
Along the same lines, Hanson et al. (2001)[8] proposed a generalized version of Eq. (9) which includes the effect of longshore gradients as,
[math] v_b = K_4 u_m \sin \alpha_b - K_5 u_m \large\frac {4}{ \gamma g} \frac {\partial u_m^2}{\partial x} \frac {1}{ \tan \beta}\normalsize \qquad (11) [/math]
where [math]K_5[/math] is an empirical coefficient ([math]=K_2/K_3[/math]). It can easily be shown that Eq. (11) inserted into Eq. (6) reduces back to Eq. (4). Thus, the proposed relationship expressed in Eq. (11) is equivalent to the ‘original’ transport relationship used in GENESIS with only wave-generated transport accounted for.
Representation of Offshore Contours
If a 2D external wave transformation model is not used in the present Corps of Engineers version of GENESIS, the offshore contour orientation, upon which the incoming waves are refracted, is calculated as a smoothed rendering of the shoreline orientation. This is to assure that the incident waves are realistic while preserving some feedback from the shoreline change to a change in the transformation of the waves (Kraus and Harikai 1983 [9]). However, this methodology has two limitations: 1) dominant local or regional bathymetric features are not well represented, and 2) an open coast without structures or sources or sinks of sediment will evolve to a straight line if the model is run a sufficiently long time. These limitations can be remedied by specifying a fixed representative or effective contour (Hanson and Kraus 1993[10]) which is appended to the feed-back contour associated with local changes in the shoreline (Fig. 4). Correctly specified, the waves transformed over this contour within the GENESIS will maintain a desired overall shoreline curvature, e.g. preserving a bay shape without the presence of structures, even if the model is run for very long time periods.Representation of Variable Transmission Coefficient for Submerged Breakwaters
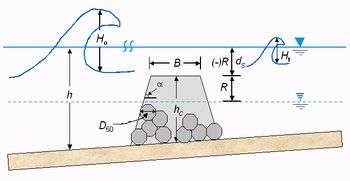
The transmission coefficient is a leading parameter in controlling beach response to detached breakwaters (Hanson and Kraus 1990[11]). Previously the GENESIS model only represented a constant transmission coefficient ([math]K_t=H_t/H_0[/math] in Fig. 5) for detached breakwaters. To improve the predictive capability of the GENESIS model, several published empirical formulae for the wave transmission coefficient were evaluated. In the revised GENESIS, the user may choose either a constant value of [math]K_t[/math] for each structure or allow the model to calculate appropriate values based on time-varying water level and wave height, and structure characteristics. If the variable-[math]K_t[/math] option is selected, water level is read from an input file at a specified input time interval. For each structure, the user specifies geometric properties (crest height and width, slopes on seaward and landward sides, and median rock size) and can select between the calculation methods of Ahrens (2001)[12], Seabrook and Hall (1998)[13], and d'Angremond et al. (1996)[14]. The method selected should be based upon structure type and configuration.Based on the input values describing the structure, water level, and calculated wave properties, a corresponding [math]K_t[/math] is calculated for each structure at each time step. The calculated [math]K_t[/math] will have a strong influence on the wave field behind and adjacent to the structure as it influences wave transmission and diffraction. Through an iterative procedure for calculating wave breaking, [math]K_t[/math] also influences the breaking wave height and direction alongshore, thereby determining the associated shoreline response to the structure (Hanson and Kraus 1989[1], 1990 [11], 1991a[15], 1991b[16]).
Representation of Tombolos
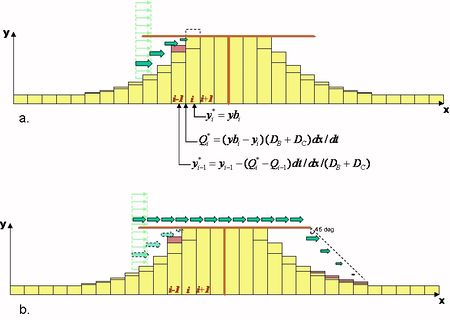
The boundary condition for representing tombolo formation at T-head groynes and detached breakwaters (DBWs) is formulated analogously to that of a seawall in GENESIS as discussed in Hanson and Kraus (1985)[17]. However, implementation of the tombolo constraint is more complex as it includes wave diffraction, blocking of previously open calculation cells, and transport of sediment on both the landward and the seaward sides of the structure. The tombolo concept implies that the beach can reach the structure but not further. As a calculation cell makes contact with the structure, the transport rate into that cell is adjusted to allow the excess sediment to remain in updrift cells. The procedure to do this must conserve sediment volume and preserve the direction of its transport.The procedure is illustrated in Fig. 6, a plan view of an idealized beach protected by a DBW at an arbitrary moment in time. A tombolo has developed in Cell [math]i+1[/math] in a previous time step. In the adjacent Cell [math]i[/math], allowing the calculated influx [math]Q_i[/math] from Cell [math]i-1[/math] to enter, the shoreline would advance beyond the DBW (Fig. 6a), which is not allowed.
Thus, the initially calculated transport rate [math]Q_6[/math] must be adjusted to [math]Q_6^*[/math] (Fig. 6b) to cause the shoreline to advance up to the detached breakwater but no further, giving [math]y_6^*=y_t[/math]. With the new transport now going out of Cell 5, the shoreline location in this cell will be adjusted from [math]y_5[/math] to [math]y_5^*[/math]. In this particular case, only two cells were recalculated. In the general case, the correction may be carried through any number of cells until the criterion that the shoreline may not advance beyond the DBW is not violated.
Related articles
- Stability Models: Linear and nonlinear A. Falques
- Shallow-water wave theory A. Chadwick
- Rhythmic shoreline features A. Falques
- Human causes of coastal erosion K. Mangor
- Coastal Hydrodynamics And Transport Processes K. Mangor
- Typical examples of structural erosion J. van de Graaff
- Dealing with coastal erosion J. van de Graaff
- Accretion and erosion for different coastal types K. Mangor
- Port breakwaters and coastal erosion M. Belorgey
- Sand spit J. Dronkers
- How to apply models I. Broker
Appendix: Derivation of Eq. (2)
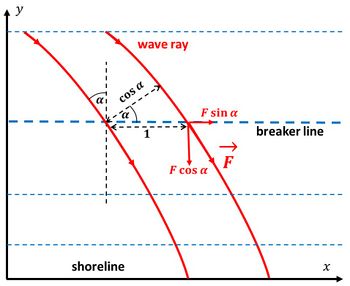
The amount of transmitted wave energy along a wave ray is given by [math]F=C_g E[/math], where [math]C_g[/math] is the wave group speed and [math]E=\frac{1}{8} \rho g H^2[/math] the wave energy. Since depth contours are assumed parallel to the shoreline and the wave incidence angle is [math]\alpha[/math], the wave energy flux through a depth contour of unit length is given by [math]F \cos \alpha[/math] (see Fig. A1). The alongshore component of the transmitted wave energy is obtained by multiplying by [math]\sin \alpha[/math]. The product [math]2 \cos \alpha \sin \alpha = \sin 2 \alpha[/math]. Eq. (2) is based on the assumption that the longshore sediment transport is proportional to the alongshore component of the wave energy received at the breaker depth contour per unit contour length.
Breaking waves generate an elevation of the mean water level, the so-called wave set-up. This wave set-up is proportional to the wave height [math]H[/math] at the breaker contour, according to shallow-water wave theory. If the wave height is variable along the breaker depth contour (the [math]x[/math]-direction), the variable wave set-up will induce a mean longshore current proportional to [math]\partial H / \partial x[/math]. It is assumed that the resulting sediment transport (the second term in Eq. (2)) is proportional to this mean longshore current and the wave energy received per unit contour length.
Appendix: Approximate analytical solution
The one-line littoral drift model Eq. (1) can be simplified in the case of small wave incidence angles, in such a way that it can be solved analytically. A key assumption underlying Eq. (1) is that cross-shore sediment exchange processes occur on a much smaller time scale than the longshore processes, meaning that on the time scale of the longshore processes the beach profile is always close to equilibrium. It is assumed that alongshore sand transport occurs uniformly along the beach profile down to the closure depth. With these assumptions, the entire coastal profile down to the closure depth moves onshore or offshore, depending on the local coastline position [math]y(x,t)[/math]. The breaker contour line remains parallel to the coastline.
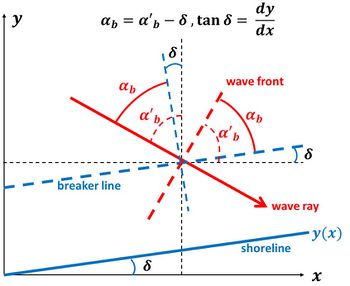
For wave incidence angles [math]\alpha \equiv \alpha_{bs}[/math] (the angle between the wave front and the breaker line, Fig. A2) smaller than about 30o we approximate [math]\sin \alpha \approx \alpha[/math] and [math]\cos \alpha \approx 1[/math]. The approximate expression of the longshore sediment transport Eq. (2) is (neglecting the contribution of longshore gradients in the wave height [math]H \equiv H_b[/math])
[math]Q = Q_0 \cos \alpha \sin \alpha \approx Q_0 \, \alpha , \quad Q_0 = 2 a_1 (H^2 C_g)_b . \qquad (A1)[/math]
The wave incidence angle [math]\alpha_0[/math], the angle between the wave front and the [math]x-[/math]axis, is assumed constant. The gradient of the longshore transport is then given by (see Fig. A2)
[math]\Large\frac{\partial Q}{\partial x}\normalsize = Q_0 \Large\frac{\partial \alpha}{\partial x}\normalsize =- Q_0 \Large\frac{\partial \delta}{\partial x}\normalsize \approx - Q_0 \Large\frac{\partial^2 y}{\partial x^2}\normalsize . \qquad (A2) [/math]
The one-line littoral drift model Eq. (1) then becomes
[math]\Large\frac{\partial y}{\partial t}\normalsize = \epsilon \Large\frac{\partial^2 y}{\partial x^2}\normalsize , \quad \epsilon = \Large\frac{Q_0}{D}\normalsize ,\qquad (A3) [/math]
where [math]D=D_B+D_C[/math] is the sum of berm height and closure depth. Equation (A3) is a diffusion equation: initial deviations from a straight shoreline will be gradually spread along the coast. If the initial shoreline position [math]y(x,0)[/math] is known, the solution of Eq. (A3) for the shoreline position [math]y(x,t) , \, t\gt 0 [/math] is given by
[math]y(x,t) = \Large\frac{1}{2 \sqrt{\pi \epsilon t}}\normalsize \int_{-\infty}^{\infty} y(x+\xi, 0) \exp\big(-\large\frac{\xi^2}{4 \epsilon t}\normalsize \big) d \xi . \qquad (A4)[/math]
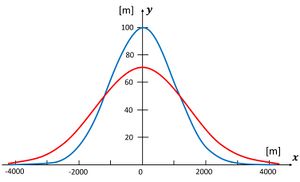
This expression can be integrated analytically for simple shapes of the initial shoreline. An example is the evolution of an initial Gaussian-distributed sand nourishment with cross-shore amplitude [math]a[/math] and longitudinal spread [math]\sigma_0[/math],
[math]y(x,0) = a \exp \big(-\large\frac{x^2}{2 \sigma_0^2} \normalsize \big) . \qquad (A5)[/math]
We assume [math]a \lt \lt \sigma_0[/math], to ensure that the wave incidence angle [math]\alpha[/math] is small over the entire nourishment. We also assume that the cross-shore profile of the nourishment is in morphological equilibrium (no cross-shore sediment transport). The shoreline will then evolve according to
[math]y(x,t) = a \Large\frac{\sigma_0}{\sigma}\normalsize \exp \big(-\large\frac{x^2}{2 \sigma^2}\normalsize \big) , \quad \sigma^2 = 2 \epsilon t +\sigma_0^2 .\qquad (A6) [/math]
The nourishment is not displaced along the shoreline, despite the unidirectional longshore sediment transport [math]Q = Q_0 \, \cos \alpha \sin \alpha[/math] (Fig. A3). It retains its symmetric Gaussian shape, while the squared spread increases linearly with [math]Q_0 t / D[/math]. It does not depend on the wave incidence angle [math]\alpha_0[/math], due to the assumption that this angle is constant and small.
Eq. (A4) can provide estimates of shoreline evolution for many other initial shapes. Several examples are shown in Larson et al. (1987)[18]. This report also provides analytical expressions for situations where the longshore sediment transport is not constant, but is modified by the presence of groynes and detached breakwaters. Analytical expressions for the case of beaches of finite length (embayed beaches) are given by Ciccaglione et al. (2023)[19].
References
- ↑ 1.0 1.1 Hanson, H. and Kraus, N. C. 1989. GENESIS: Generalized model for simulating shoreline change, Report 1: Technical Reference. Tech. Rep. CERC-89-19, U.S. Army Engineer Waterways Experiment Station, Coastal Engineering Research Center, Vicksburg, MS.
- ↑ Kahl, D.T., Vulis, L.M., Schubert, J.E. and Sanders, B.F. 2024. Characterizing longshore transport potential and divergence of drift to inform beach loss trends. Coastal Engineering 189, 104473
- ↑ Pelnard-Considere, R. 1956. “Essai de Theorie de l’Evolutio des Form de Rivage en Plage de Sable et de Galets,” 4th Journees de l’Hydaulique, Les Energies de la Mer, Question III, No. 1, 289-298.
- ↑ Bagnold, R.A. 1963. Mechanics of Marine Sedimentation, in The Sea, Vol. 3, 507-528, (ed. Hill, M.N.), Interscience, NY.
- ↑ 5.0 5.1 Komar, P.D. and Inman, D.L. 1970. Longshore sand transport on beaches, J. Geoph. Res., 75(30), 5914-5927.
- ↑ Kraus, N.C., Isobe, M., Igarashi, H., Sasaki, T. and Horikawa, K. 1982. Field Experiments on Longshore Sand Transport in the Surf Zone, Proceedings 18th Coastal Engineering Conference, ASCE, 969-988.
- ↑ Longuet-Higgins, M.S. 1970. Longshore Currents Generated by Obliquely Incident Sea Waves, 1, Journal of Geophysical Research, 75(33), 6778-6789.
- ↑ Hanson, H., Larson, M., and Kraus, N.C. 2001. “A New Approach to Represent Tidal Currents and Bathymetric Features in the One-Line Model Concept,” Proc. Coastal Dynamics '01, ASCE, 172-181.
- ↑ Kraus, N.C., and Harikai, S. 1983. Numerical Model of the Shoreline Change at Oarai Beach. Coastal Engineering, 7(1), 1-28.
- ↑ Hanson, H. and Kraus, N.C. 1993. "Optimization of Beach Fill Transitions," in "Beach Nourishment Engineering and Management Considerations," Stauble, D.K. and Kraus, N.C. (Vol.Eds.), Proc. Coastal Zone '93, ASCE, 103-117.
- ↑ 11.0 11.1 Hanson, H., and Kraus, N. C. 1990. "Shoreline response to a single transmissive detached breakwater." Proceedings 22nd Coastal Engineering Conference, ASCE, 2034-2046.
- ↑ Ahrens, J. P. 2001. "Wave transmission over and through rubble-mound breakwaters." Draft Contract Report submitted to the U.S. Army Engineer Research and Development Center., Coastal and Hydraulics Laboratory, Vicksburg, MS.
- ↑ Seabrook, S., and Hall, K. 1998. "Wave transmission at submerged rubble mound breakwaters." Proceedings 26th Coastal Engineering Conference, ASCE, 2000- 2013.
- ↑ d'Angremond, K., van der Meer, J., and De Jong, R. 1996. "Wave transmission at low-crested structures." Proceedings 25th Coastal Engineering Conference, ASCE, 2418-2427.
- ↑ Hanson, H., and Kraus, N. C. 1991a. “Numerical simulation of shoreline change at Lorain, Ohio,” J. Waterway, Port, Coastal and Ocean Engineering, 117(1), 1-18.
- ↑ Hanson, H., and Kraus, N. C. 1991b. "Comparison of shoreline change obtained with physical and numerical models," Proceedings Coastal Sediments '91, ASCE, 1785-1813.
- ↑ Hanson, H. and Kraus, N.C. 1985. "Seawall Constraint in the Shoreline Numerical Model," Journal of Waterway, Port, Coastal and Ocean Eng., ASCE, Vol. 111, No. 6, 1079 1083.
- ↑ Larson, M., Hanson, H. and Kraus, N.C. 1987. Analytical Solutions of the One-Line Model of Shoreline Change, Technical Report CERC-87-15, U.S. Army of Engineer Waterways Experiment Station. Coastal Engineering Research Center
- ↑ Ciccaglione, M.C., Buccino, M. and Calabrese, M. 2023. On the evolution of beaches of finite length. Continental Shelf Research 259, 104990
Please note that others may also have edited the contents of this article.
|
