Tidal flats from space
Contents
Introduction
The objective of our research was to classify the different surface types of the tidal flat areas with satellite data in combination with ground truth measurements. Remote sensing has many advantages such as large coverage and the recording of multi-temporal data. Both are useful for monitoring conditions in near real time as well as detecting changes of the environment when analysing historical data. Tidal flats are unique ecosystems because of the water cover, which changes permanently with the tidal phase. They play an important role as a cleansing site for North Sea water, as a nursery for young fish and as a feeding ground for many bird species. They form a transitional zone between land and ocean. Traditional monitoring techniques of larger areas are limited by the factor time. This means that they are time- dependent and time-consuming. Due to the expanse of the tidal flat of nearly 10,000 km2, the variability of water cover and the variability of the sediment, remote sensing has become an indispensable technique. The whole German Wadden Sea can be detected under the same environmental conditions with only two scenes of the Landsat satellite, which has been an operational satellite system since 1972. Remote sensing data support mapping and monitoring programmes. They support the identification of proxi-parameters and indicators and fill the temporal gap between in-situ data and field measurements.
Fundamentals
The main information comes from the spectral signature of the surface materials. Different types of materials can be distinguished on the basis of differences in their spectral reflectivity. Fig. 2 shows different surface types of tidal flats. The corresponding spectral reflectances are illustrated in Fig. 3. Due to the variation of the reflectances the diverse surface types of the tidal flat can be distinguished and classified. At present we are using satellite data from the Landsat series (Landsat 5 and 7) and ASTER. The coverage of both systems is shown in Fig. 1.
Remote Sensing (RS) Data

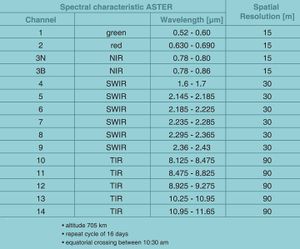
The first multispectral satellites for land remote sensing, the Landsat series, were launched during the 1970s and have delivered data up to the present. The Landsat Programme is the longest running mission for the collection of multispectral digital data of the earth's surface from space. Current and historical data are very useful for research in the field of change detection and monitoring. Presently, the data from Landsat 5 (launched in March 1984) and Landsat 7 (launched in April 1999) are used for worldwide data analysis (Table 1). The ASTER sensor is part of NASA’s Terra spacecraft, which was launched in December 1999 (Table 2).
Methods & Techniques
The use of different methods and techniques depends on the information the user is interested in. If the analyst is interested in the documentation of morphological changes of the tidal flat, simple classification methods can be used for analysing multitemporal data sets. If the focus is on vegetation (seagrass, macroalgae) common vegetation indices can be used. For a more detailed analysis of the different surface types, and, in particular, of the sediment properties, additional data like spectral reflectance measurements on ground and in-situ samples are necessary.
Pre-processing

At the beginning, some general pre-processing steps are necessary, like atmospheric correction (Fig. 4) and separation of the tidal flat areas from other surface types such as water and meadows (Fig. 5). The atmospheric correction is very important, because scattering and absorption processes in the atmosphere modify the spectral signature. When working with scenes of different acquisition dates we need comparable values for each pixel. The product of the atmospheric correction are surface reflectances at the bottom of the atmosphere (BOA) for each pixel. The corrected data are the input for extracting the tidal flat areas, because the main processing will be based only on these pixels; the data from land and water will be ignored.
Main analysis
After pre-processing, different methods can be used to analyse the spectral information of the tidal flats.
General aspects
All analysis methods are based on the spectral diversity of the single pixels, which form a multidimensional spectral space, the dimension of which is defined by the available bands of the sensor system.
The spatial resolution of the data plays an important role for the interpretation of the results and also for the selection of a method. We have to keep in mind that the reflectance value of a single pixel of a defined resolution (30 m Landsat and 15 m ASTER) might represent a mixture of different surface types.
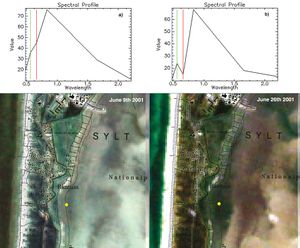
This depends on the homogeneity of the surface. The tidal flat can be characterised by regions of very inhomogeneous and homogeneous areas; therefore some pixels represent a mixture of objects with different spectral reflectivity while other pixels include only one type of surface material. Tidal flat sediments have no sharp boundaries like those on land, in most cases they are distributed along a continuum between mud and sand. The short term temporal variability of the tidal flat surface is shown in Fig. 6. This is also documented by the changing reflectance spectra.
Classification methods
The principle of image classification is to group pixels with similar patterns of brightness values in the available spectral bands. Two general approaches exist: a) Unsupervised (common is the K-means algorithm): This method uses statistical parameters of the input data. The analyst has no control over the nature of the resulting classes, but he can define the number of resulting classes. This method is useful for exploring different surface types. b) Supervised (common is the Maximum-Likelihood algorithm): This is a knowledge based algorithm, because the analyst has to define training areas at the beginning of the calculation. On the basis of these training areas the statistical information is calculated. All pixels are then compared to the spectral signatures of each predefined class and assigned to the class for which the pixel has the highest degree of similarity.
Linear spectral unmixing (LSU)
As mentioned above, the reflectance at each pixel is assumed to be a linear combination of the reflectivity of all surface types which are present within that pixel. The LSU method analyses the sub-pixel percentage (portion) of surface types within each pixel, based on the spectral reflectance of each surface type (endmember spectra). That means that this technique models an image pixel as a linear mixture of a specified number of materials with known spectral reflectances but unknown abundance fractions. The results are maps for each endmember with pixel values between 0 and 1, where for example 0.7 means that 70% of the pixel is covered by the endmember of that map (Richards & Xiuping, 2006[1]).
PCA and unsupervised classification
The Principle Component Analysis (PCA) is a powerful method of analysing correlated multidimensional data. The PCA is known as compression and transformation technique and can be used if correlations between the spectral bands exist. Principal component analysis determines the eigenvectors of a variance-covariance or a correlation matrix. The analysis consists of a linear transformation of n original variables to n new variables, where each new variable is a linear combination of the original. The first PC band contains the largest percentage of data variance and the second PC band contains the second largest data variance, and so on. Depending on the spectral properties of the image and the frequency distribution of different pixel types, some of the last PC bands may contain only noise (Richards & Xiuping, 2006[1]). In a following step an unsupervised classification is performed, based on the calculated PC bands, in our case with the K-means algorithm.
Factor analysis
Factor analysis is another multivariate statistical analysis method, which extends the PCA to find factors which can be better interpreted in terms of -in our case- geophysical variables. The resulting factor scores calculated for each single pixel describe the relationship between the original data (reflectances) and the resulting factors, which can be the water content of the sediment or the coverage by diatoms. The pixel values can then be correlated with the in-situ data, like grainsize parameters. However, the result of this method also depends on the frequency distribution of pixels with different properties.
kNN-Method
The k-nearest-neighbour-method (kNN), a nonparametric method, can be used to estimate unknown values by means of similarity to reference units with known values. It requires a large amount of in-situ data to attain acceptable results.
Vegetation analysis & sediment classification
One result of multispectral analysis is the detection of the spatial distribution of vegetation on the tidal flat. This distribution is changing over the year and is sometimes very different from year to year, depending on the seasonal weather development. Since a low level in 1996, the seagrass beds are growing epecially in the North Frisian Wadden Sea (Essink et al., 2005[2]). Using satellite data, maps of the present distribution can be generated and changes can be documented. The result of an unsupervised classification, which is based on the transformed channels (PCA- bands), is illustrated in Fig. 7. In this case the date of acquisition is July 15th 2002. In this month a great expansion of seagrass could be detected. The results correspond with data evaluated by the National Park Authorities, Tönning (Schanz & Reise, 2005[3]). The sediment classification is based on satellite and ground truth data. The resulting sediment map is shown in Fig. 8.
Related articles
- Large scale mapping of intertidal areas
- The HIMOM and OFEW approaches to monitoring intertidal flats
- HyMap: Hyperspectral seafloor mapping and direct bathymetry calculation in littoral zones
- Principal Component Analysis
- Satellite-derived shoreline and nearshore bathymetry
References
- ↑ 1.0 1.1 Richards, R. & Xiuping, J. 2005. Remote Sensing and Digital Image Analysis: An Introduction. New York: Springer-Verlag.
- ↑ Essink, K., Dettmann, C., Farke, H., Laursen, K., Lüerßen, G., Marencic, H. & Wiersinga, W. (Eds.), 2005. Wadden Sea Quality Status Report 2004. Wadden Sea Ecosystem No. 19. Trilateral Monitoring and Assessment Group. Wilhelmshaven (Germany): Common Wadden Sea Secretariat.
- ↑ Schanz, A. & Reise, K., 2005. Seegras-Monitoring im Schleswig-Holsteinischen Wattenmeer - Forschungsbericht zur Bodenkartierung ausgewählter Seegraswiesen im Schleswig-Holsteinischen Wattenmeer 2003. Flintbek: Landesamt für Natur- und Umwelt des Landes Schleswig-Holstein.
Please note that others may also have edited the contents of this article.
|
Please note that others may also have edited the contents of this article.
|


