Plankton remote sensing North Sea
Contents
Introduction
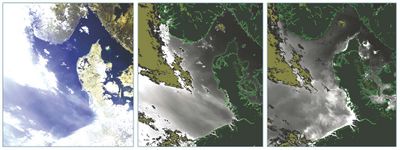
Coastal seas are highly dynamical areas. In particular, the water of the shallow soft-bottom coast of the North Sea, with its strong tidal currents, continuously changes its *properties. Monitoring these properties, such as suspended particulate matter with all its components and phyto- plankton, is a very demanding challenge. Ocean colour remote sensing is one possibility to determine some of the key variables and to provide weekly or monthly maps of their distribution with a high spatial resolution. In contrast to the open ocean, the optically complex coastal waters, with different classes of substances, pose a number of problems for optical remote sensing. With the launch of the Medium Resolution Imaging Spectrometer MERIS on the European earth observing satellite ENVISAT in 2002, a new generation of instruments became available, which allows also remote sensing of turbid coastal water.
The sensor has a spatial resolution of 300 m, a revisit period of 1-2 days at mid latitudes and 15 spectral bands. For using this instrument for coastal water remote sensing, special procedures are necessary to derive the in-water optical properties and concentrations from the reflectance spectra. At the Institute for Coastal Research of GKSS, the required algorithms have been developed, which are based on artificial neural networks, and which are implemented in the ground segment for the routine processing of MERIS data at the European Space Agency ESA (Schiller & Doerffer, 2005[1], Doerffer & Schiller, 2007[2]). In this chapter we provide an overview of the steps which are necessary to compute a concentration map from the level 1 data of MERIS, i.e. the spectral radiances at the top of the atmosphere (TOA) .
Methods and techniques

Ocean colour remote sensing requires two major steps (Fig. 1). First, the influence of the atmosphere and the reflectance at the water surface have to be computed to get the radiance reflectance leaving the water, i.e. the sunlight, which is backscattered by the water molecules and all water constituents, including phytoplankton (Fig. 2). This atmospheric correction step is extremely critical, because the atmosphere, in most cases, causes more than 90 percent of the radiance at the top of the atmosphere. As the second step, the inherent optical properties, which are the absorption and scattering coefficients, as well as the concentrations of the substances in water have to be derived from the radiance reflectance spectrum leaving the water. For this purpose, different kinds of procedures have been developed, which are partly empirical, but for coastal waters they are based on radiative transfer models in most cases.
For the correction of the atmosphere, an aerosol optical model has to be defined, because scattering by different aerosols, including thin cirrus clouds, is the most variable optical component in the atmosphere within the visible spectrum. The properties are selected according to measurements of the sun photometer network AERONET. GKSS operates one of these instruments on the island of Helgoland. A Monte Carlo photon tracing model is then used to simulate TOA radiance reflectances, which are the basis to train a neural network. Finally, this neural network is included into the processor to determine the radiances leaving the water from the TOA radiances as measured by MERIS.
For the second step, a bio-optical model of the water constituents is necessary. This model is derived from various optical measurements in coastal waters, which have been performed by GKSS and partner institutes during the past years.
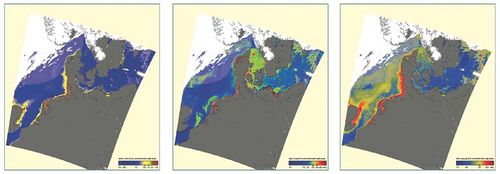
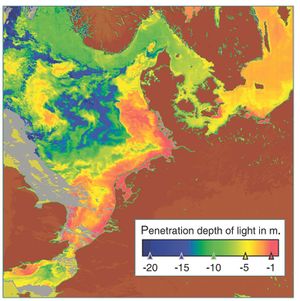
Based on this model, radiance spectra leaving the water are simulated which cover the range of concentrations found in most coastal waters. This set of spectra again is used to train a neural network, which determines the optical properties and the concentrations from the radiance spectra leaving the water. The result are maps of absorption and scattering coefficients, of the concentrations of suspended matter and phytoplankton and of the water transparency (Fig. 3).
Seasonal patterns of phytoplankton in the North Sea
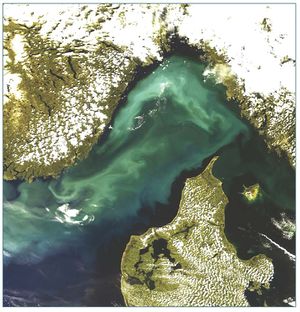
One application of ocean colour remote sensing is investigation of the horizontal distribution patterns of phytoplankton in the North Sea at different seasons. It might change in the future due to climate change, with possibly significant consequences for the North Sea ecosystem including its fish stocks. In springtime, when the water is rich in nutrients, light is the most important factor which controls the development of phytoplankton growth (Fig. 4). During winter conditions, the days are too short combined with a low sun elevation and the water column is well mixed in most parts of the North Sea. Since a phytoplankton cell can be everywhere in the water column, including the dark depths, it will not get sufficient light during 24 hours to grow. When the days become longer, phytoplankton growth starts in the shallow water, where the light per day is sufficient even when the water column is well mixed. In the surface layers of deep waters growth can start only when calm and sunny weather with sufficient heating produces a stratification of the water column. Under these conditions the phytoplankton can stay in the upper mixed layer without sinking into the dark deeper layers. It gets enough light and starts to grow rapidly. In the deep northern North Sea water the growing season normally begins around mid April. The growing phase is interrupted or stops when strong winds destroy the stratification or when the nutrients are depleted. Also, grazing by zooplankton, which follows the phytoplankton development, reduces the phytoplankton biomass. A special case exists in the Skagerrak and the Norwegian Trench. Here, stratification can be caused by less saline light water from the Balitc Sea, which flows into the North Sea as an upper layer and follows the Norwegian coast due to the normally anticlockwise circulation in the North Sea. Thus, the phytoplankton growing season starts much earlier due to the better light conditions in this upper layer (Fig. 5).
These algae make the water extremely bright because of the high scattering coefficient of their coccoliths. These are plates which form quasi a shield of calcium carbonate around the cell. During the summer period, other phytoplankton blooms occur in the southern North Sea, which are summarised under "red tides", because - due to their pigments - they discolour the water from green to red (Fig. 6). Some of these blooms are harmful to other marine organisms, e.g. to mussels or fish, and can severely damage maricultures.
Along the coast of the Netherlands and in the German Bight, high phytoplankton concentrations can be observed throughout the summer, due to the high nutrient concentrations, which are collected by the coastal current from all the rivers which discharge into the North Sea and which are transported to the north. In contrast in the central and northern North Sea, the chlorophyll concentration decreases during the summer period due to nutrient depletion and grazing by zooplankton. In autumn stronger winds and less insolation causes a breakdown of the stratification so that fresh nutrients are mixed up from deeper layers to the surface. A second phytoplankton bloom can briefly develop until the decreasing light ends the growing season.
Another factor which limits the growth of phytoplankton and thus controls the distribution pattern is turbidity, i.e. the attenuation of light by suspended matter. This factor can also be estimated from the spectral reflectance data of MERIS.
Maximum chlorophyll concentration in the North Sea
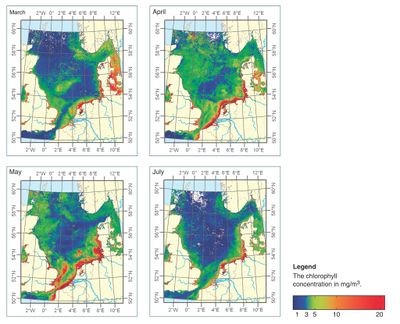
In March maximum values are found along the coasts of the southern North Sea. Also, the shallow Dogger Bank shows higher values due to the better light conditions. In the deeper northern part of the North Sea values are low. Obvious are the high concentrations in the Skagerrak and around the southern part of Norway.
In April we see the whole North Sea with chlorophyll concentration around 5 mg/m3 except for the Dogger Bank where the nutrients ar now depleted.
In May we see maximum concentrations also in the northern North Sea, while they have dropped in the southern central part.
In July the chlorophyll concentrations are low in the central part, but high along the coasts including the Skagerrak (Fig. 7).
Related articles
- Plankton remote sensing
- Interpolation of remote sensing images
- Light fields and optics in coastal waters
- Remote sensing
- Optical remote sensing
- The Baltic Algae Watch System - a remote sensing application for monitoring cyanobacterial blooms in the Baltic Sea
References
- ↑ Schiller, H. & Doerffer, R. (2005). Improved Determination of Coastal Water Constitutent Concentrations from MERIS data. IEEE Transactions of Geoscience and Remote Sensing, 43, 1585-1591.
- ↑ Doerffer, R. & Schiller, H. (2007). The MERIS Case 2 water algorithm. Int. Journal of Remote Sensing, 28 (3-4), 517-535.
Please note that others may also have edited the contents of this article.
|
Please note that others may also have edited the contents of this article.
|
Please note that others may also have edited the contents of this article.
|
Please note that others may also have edited the contents of this article.
|
Please note that others may also have edited the contents of this article.
|
Please note that others may also have edited the contents of this article.
|
