File:StratificationETM.jpg
From Coastal Wiki
Size of this preview: 800 × 179 pixels. Other resolutions: 320 × 71 pixels | 4,090 × 913 pixels.
Original file (4,090 × 913 pixels, file size: 533 KB, MIME type: image/jpeg)
Summary
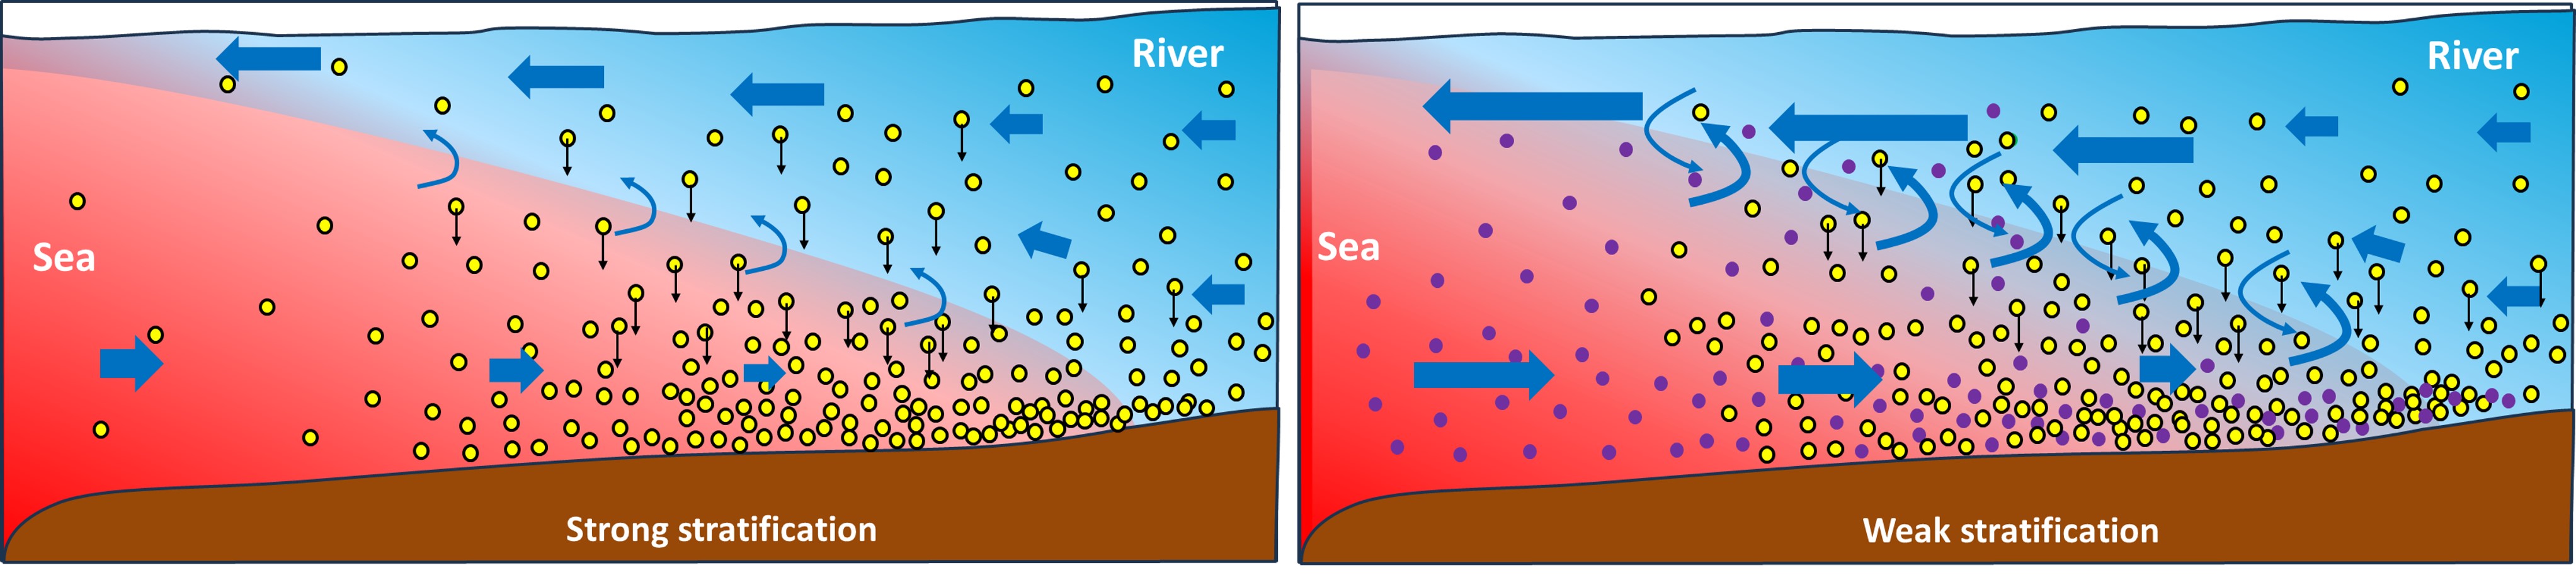
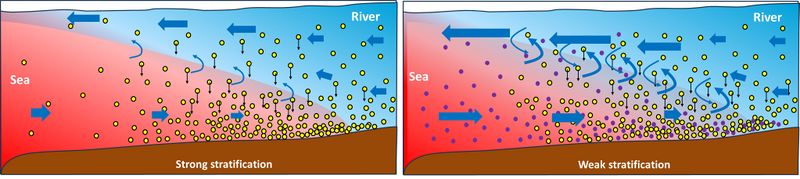
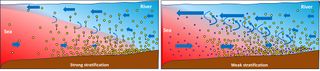
Cartoon explaining the effect of density stratification on the estuarine turbidity maximum (ETM). Red = sea water, blue = river water. Yellow dots = fluvial sediment, violet dots = marine sediment. Left panel: Strong stratification. Right panel: Weak stratification.
File history
Click on a date/time to view the file as it appeared at that time.
| Date/Time | Thumbnail | Dimensions | User | Comment | |
|---|---|---|---|---|---|
| current | 21:14, 1 July 2023 | 4,090 × 913 (533 KB) | Dronkers J (talk | contribs) | Cartoon explaining the effect of density stratification on the estuarine turbidity maximum (ETM). Red = sea water, blue = river water. Yellow dots = fluvial sediment, violet dots = marine sediment. Left panel: Strong stratification. Right panel: Weak s... |
- You cannot overwrite this file.
File usage
The following page links to this file:
