Interpolation of remote sensing images

Introduction
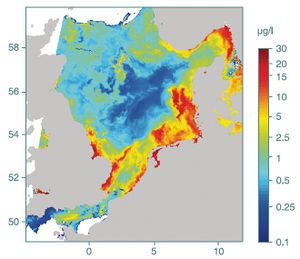
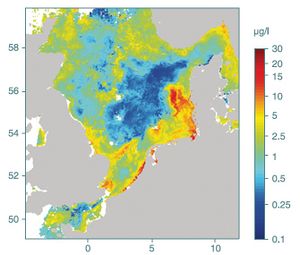
Satellite images can reveal spatial patterns of e.g. the distribution of phytoplankton. Its abundance is represented by the chlorophyll concentration, which is one of the standard products of MERIS (Medium Resolution Imaging Spectrometer). The images have a temporal resolution of approximately one per day, the spatial resolution is 1.2 km, which corresponds to unprojected "Reduced Resolution" scenes (compared to 300 m Full Resolution mode). The concentrations of three colour-defining substances in the water are derived from the monitored bands in the visual spectral range. The pigments of the phytoplankton -for the most abundant species that is chlorophyll - change the spectral characteristics of the backscattered light mainly by absorption; the total amount of anorganic particles (total suspended matter) accounts mainly for scattering and organic matter for absorbtion (yellow substance). Because of the dependence on the visual spectral range clouds are responsible for missing data. To study the spatial and temporal variability of phytoplankton in the North Sea by satellite images, geo- statistical methods are applied to cope with the missing data, e.g. the Kriging technique (for an overview consult Wackenagel, 2003[1] or Olea, 1999[2]). For further investigations the ESA standard product algal_2 is used which represents algal concentrations in case2 waters.
Estimation of missing data values
The most commonly used method to avoid the correction for missing data and to gathering information about the whole area of interest is the calculation of the monthly mean (or median). By sacrificing temporal resolution, gaps can be filled by accumulating successive satellite images. To illustrate the kriging technique, an exceptionally cloud-free satellite image of the North Sea (Fig. 2) is chosen (May 10th 2006) and overlaid with a cloud mask (February 2nd 2008) (Fig. 4). To estimate the missing data values several steps in data processing are arranged (Fig. 1). For the applicability of Kriging technique the trend - i.e. the pattern of the expected value over the area - has to be negligible. The North Sea cannot be regarded as an area without spatial trend, because it exhibits almost all-the-year high chlorophyll concentrations in the coastal areas and shows recurring patterns of algal blooms in the spring season. To correct for the time-dependent, dominant spatial trend a weighted monthly mean (Fig. 3) is calculated from any data which has been collected two weeks before and after the day of interest. Data close to the day of interest receive the higher weights. After removal of the trend the residuals, which are less spatially patterned than the original chlorophyll data, are used for geostatistical prediction. The estimates can be considered as corrections to the weighted monthly mean. These results will cover the area where the trend has been calculated, and therefore this process might not be sufficient to fill all missing data points. In a second step, the remaining missing values can be calculated relying on the original data and the newly estimated values. The variogram, which measures the variance of pairs of points within certain distance classes, is calculated from the residuals and used in the ordinary Kriging procedure. This estimates the residuals at locations that are covered by the cloud mask and where a data point is available for comparison. In combination with the weighted monthly mean the (estimated) residuals function as corrections to the spatial trend. Remaining gaps persist at locations where no trend data is available (Fig. 4). The difference between estimates and original data is small (Fig. 6 and 7). Major differences occur at locations where the trend has been calculated from a single sample which is distant in time to the original image and lies in a region of high temporal variability.
Related articles
- Data interpolation with Kriging
- Remote sensing
- Plankton remote sensing
- Plankton remote sensing North Sea
References
Please note that others may also have edited the contents of this article.
|


