Difference between revisions of "Dynamics and structure of the water and matter ex-change between the Wadden Sea and the German Bight"
(New page: ===Introduction=== The coupling between the German Bight and the Wadden Sea is of high importance for the cycles of matter in this area and significantly affects the state and ecosystem ke...) |
Dronkers J (talk | contribs) |
||
| (17 intermediate revisions by 2 users not shown) | |||
| Line 2: | Line 2: | ||
The coupling between the German Bight and the Wadden Sea is of high importance for the cycles of matter in this area and significantly affects the state and ecosystem key processes within the Wadden Sea: Sediments in the Wadden Sea are imported from the adjacent areas of the German Bight and overturned and decomposed there, and dissolved nutrients are exported from the Wadden Sea, depending on the nature and the time scale of internal and exchange processes. | The coupling between the German Bight and the Wadden Sea is of high importance for the cycles of matter in this area and significantly affects the state and ecosystem key processes within the Wadden Sea: Sediments in the Wadden Sea are imported from the adjacent areas of the German Bight and overturned and decomposed there, and dissolved nutrients are exported from the Wadden Sea, depending on the nature and the time scale of internal and exchange processes. | ||
The German Bight and the Wadden Sea are highly dynamic natural environments characterised by strongly varying physical impact from tidal currents and waves and significant changes in water temperature, salinity, and suspended matter concentration, to name a few parameters. This temporal and spatial variability requires long-term observations to understand the exact nature of exchange processes and to determine the direction of fluxes and the relevant time scales on which they occur. It is, for example, still unknown whether the Wadden Sea seafloor will grow, by accumulating suspended matter and sand, with sea level rise, or not. | The German Bight and the Wadden Sea are highly dynamic natural environments characterised by strongly varying physical impact from tidal currents and waves and significant changes in water temperature, salinity, and suspended matter concentration, to name a few parameters. This temporal and spatial variability requires long-term observations to understand the exact nature of exchange processes and to determine the direction of fluxes and the relevant time scales on which they occur. It is, for example, still unknown whether the Wadden Sea seafloor will grow, by accumulating suspended matter and sand, with sea level rise, or not. | ||
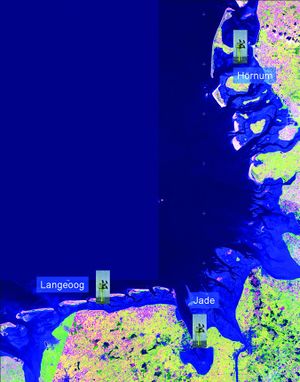
| − | [[Image: | + | [[Image:Floeser_1.jpg|thumb|right|'''Figure 1''':Location of the pile stations in the German Wadden Sea.]] |
| + | The ideal observational tool would be a continuous monitoring of the exchanged water bodies including the dissolved and suspended matter and the bedload transport of the sand over a full cross-section of a tidal inlet connecting the Wadden Sea with the open North Sea. This was partly achieved in the Dutch Wadden Sea, implementing an acoustic doppler current profiler (ADCP) and a conductivity temperature depth sensor (CTD) onboard the ferry connecting Den Helder and Texel. For the German Wadden Sea, a comparable infrastructure is not yet available. As an alternative, GKSS is using fixed piles as permanent multiparameter measuring platforms, complemented by ship cruises checking the representativity of the pile positions. | ||
| + | |||
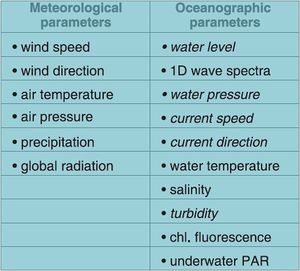
| + | [[Image:Floeser_T1.jpg|thumb|left|'''Table 1''': Meteorological and oceanographic parameters measured at the pile stations.]] | ||
| − | |||
===Methodology=== | ===Methodology=== | ||
The method comprises three elements: continuous automated measurements at pile stations, ship surveys to assess the representativity of the pile location and repeated sampling at the piles and during ship surveys. | The method comprises three elements: continuous automated measurements at pile stations, ship surveys to assess the representativity of the pile location and repeated sampling at the piles and during ship surveys. | ||
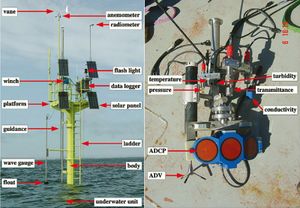
| − | Since 1996, GKSS has operated pile stations at several locations in the German Wadden Sea (Fig. 1 and 2). For practical operation, the position of the piles has to be selected according to the following criteria: limited exposure to waves, allow regular maintenance work, water depth at low water of about 3 m, an optimum between pile stability and water coverage of the sensors at extreme low water. The piles are assembled out of several iron tubes with an outer diameter of 40 cm. A cage is mounted on top which carries solar panels for energy supply, data logger, telemetry units and standard | + | Since 1996, GKSS has operated pile stations at several locations in the German Wadden Sea (Fig. 1 and 2). For practical operation, the position of the piles has to be selected according to the following criteria: limited exposure to waves, allow regular maintenance work, water depth at low water of about 3 m, an optimum between pile stability and water coverage of the sensors at extreme low water. The piles are assembled out of several iron tubes with an outer diameter of 40 cm. A cage is mounted on top which carries solar panels for energy supply, data logger, telemetry units and standard meteorological sensors (Table 1). The overall length of the system amounts to some 15 metres, depending on the tidal range of the particular area. To assure stable fixing the tubes are flushed into the ground by seven metres.[[Image:Floeser_2.jpg|thumb|right|'''Figure 2''':Pile station as it is operated at three locations in the German Wadden Sea. On the left, the “above-water-unit” is shown, on the right the underwater unit. The meteo- rological and oceanographic instruments are indicated.]] |
| + | An underwater sensor unit (Table 1) is mounted on an elevator bar to raise it regularly for cleaning and to lower it into the operational position. Water level and 1D-wave spectra are measured by means of a floater attached to a readout-rod. All parameters are transmitted by mobile phone to the research centre as 10 min averages (Fig. 4), some parameters (e.g. water level to derive wave spectra) in parallel as five-minute long 2-Hz-time series (parameters in italics in Table 1). For long-term storage they are saved in a data base and published automatically within half an hour on the website of the institute. The piles are operated fully automatically with remote control. Personnel are required on the piles for maintenance work and to collect water samples for calibration. In order to protect the measurement equipment against ice forcing in winter, the observation period usually starts in early spring and ends in late autumn. | ||
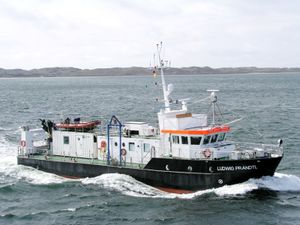
"Calibration/representativity campaigns" with a cruising research vessel (Fig. 3) are occasionally conducted close to the time series stations in order to convert the point-measurements of water properties to volume fluxes in the tidal channel. These campaigns with the GKSS-owned research vessels “Ludwig Prandtl” and “Storch” are carried out every year in order to extrapolate the point observations taken at the piles to the full channel cross-section at the pile location or even to a larger part of the tidal basin. | "Calibration/representativity campaigns" with a cruising research vessel (Fig. 3) are occasionally conducted close to the time series stations in order to convert the point-measurements of water properties to volume fluxes in the tidal channel. These campaigns with the GKSS-owned research vessels “Ludwig Prandtl” and “Storch” are carried out every year in order to extrapolate the point observations taken at the piles to the full channel cross-section at the pile location or even to a larger part of the tidal basin. | ||
| − | [[Image: | + | [[Image:Floeser_3.jpg|thumb|left|'''Figure 3''': Research vessel “Ludwig Prandtl”, equipped among many other instruments with a downward-looking ADCP for the measurement of water flow and a multibeam echosounder for the obser- vation of the seafloor.]] |
| + | Continuous time series of suspended particulate matter concentration (SPMC) and chlorophyll fluorescence are derived by combination of indirect optical and acoustical detection methods with repeated sampling. SPMC of water samples is determined by gravimetric methods. To use chlorophyll fluorescence as a proxy to follow the development of phytoplankton biomass over time, concomitant measurements of PAR (photosynthetic active radiation) irradiance (400-700 nm) allow correcting for photochemical quenching. Fluorescence records are then converted into chlorophyll concentrations on the basis of regular water sample analysis for phytoplankton pigments by High-Performance Liquid Chromatography (HPLC). | ||
| + | |||
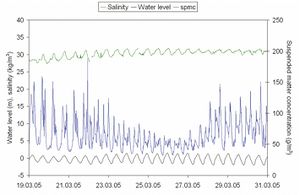
| + | [[Image:Floeser_4.jpg|thumb|right|'''Figure 4''': Typical time series for salinity, water level and suspended matter concentration, measured at the pile station close to the East Frisian Island Langeoog. Salinity oscillates with the water level because the Wadden Sea water is usually fresher than the North Sea water. The reason is not the (small) freshwater inflow from the mainland but rainwater that has a larger influence here than in the deeper North Sea. The suspended matter concentration depends on flow velocity: during the periods with high current speed (half tide), the suspended matter concentration is also elevated, and at [[slack water]] the concentration is comparatively low.]] | ||
| − | |||
===Problems=== | ===Problems=== | ||
A problem common to all automated instruments in seawater is biofouling. Organisms of various sizes settle on the instruments and modify the measuring values. Regular maintenance is therefore of utmost importance to clean the instruments, in particular the optical surfaces (window for light transmission) and the cables where barnacles eat away the cable protection. The maintenance frequency depends on the seasons: in early spring and late autumn, a cleaning once in two weeks is sufficient, in late spring and summer this interval has to be reduced to 4-5 days. | A problem common to all automated instruments in seawater is biofouling. Organisms of various sizes settle on the instruments and modify the measuring values. Regular maintenance is therefore of utmost importance to clean the instruments, in particular the optical surfaces (window for light transmission) and the cables where barnacles eat away the cable protection. The maintenance frequency depends on the seasons: in early spring and late autumn, a cleaning once in two weeks is sufficient, in late spring and summer this interval has to be reduced to 4-5 days. | ||
Floc- and grain-size of the suspended matter changes with tidal phase and season, as does the relationship between sample SPMC and the optical and acoustical detection signals. This creates additional uncertainty in the SPMC-time-series, as sampling can occur only at widely scattered times. | Floc- and grain-size of the suspended matter changes with tidal phase and season, as does the relationship between sample SPMC and the optical and acoustical detection signals. This creates additional uncertainty in the SPMC-time-series, as sampling can occur only at widely scattered times. | ||
In wintertime, when suspended sediment dynamics is expected to be highest, the stations must be removed because on the one hand ice may damage the pole, and on the other hand the energy supply of the solar panels may not be sufficient to operate the instruments. | In wintertime, when suspended sediment dynamics is expected to be highest, the stations must be removed because on the one hand ice may damage the pole, and on the other hand the energy supply of the solar panels may not be sufficient to operate the instruments. | ||
| + | |||
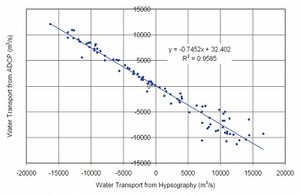
| + | [[Image:Floeser_5.jpg|thumb|left|'''Figure 5''': Correlation of the water flow measured from shipboard using ADCP to the flow determined by using the gauge level and calculating the difference of corresponding water volumes. The dots contain all four experiments in the year 2000; thus the connection of the two data types may be considered typical - at least for the year 2000 and for the pile station’s position.]] | ||
===Applications=== | ===Applications=== | ||
| − | |||
====1. Calculation of water exchange in the Langeoog-Baltrum bight using gauge level and hypsographic data==== | ====1. Calculation of water exchange in the Langeoog-Baltrum bight using gauge level and hypsographic data==== | ||
From the water level measured at the pole station we calculate for every time step the total water content of the backbarrier area (for this purpose, the system’s topography must be known). Taking two subsequent volumes, a water flux in the respective time span can be calculated. In order to correlate this point measurement to a flux representative for the entire area, ship-based ADCP measurements of the water fluxes in the tidal inlet must be performed. This has been done, e.g., in the bight between the East Frisian Islands Langeoog and Baltrum, on four occasions in May and August 2000. | From the water level measured at the pole station we calculate for every time step the total water content of the backbarrier area (for this purpose, the system’s topography must be known). Taking two subsequent volumes, a water flux in the respective time span can be calculated. In order to correlate this point measurement to a flux representative for the entire area, ship-based ADCP measurements of the water fluxes in the tidal inlet must be performed. This has been done, e.g., in the bight between the East Frisian Islands Langeoog and Baltrum, on four occasions in May and August 2000. | ||
| Line 25: | Line 31: | ||
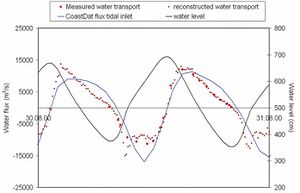
These reconstructed water fluxes can be compared to the fluxes derived from the CoastDat database which contains results from a current and sea state model (Fig. 6) and thus serve as valuable boundary information in the highly dynamic Wadden Sea zone. The combination of these pieces of information will eventually lead to a better understanding of the suspended matter transport, settling and resuspension, processes that are very sensitive to water flow velocity. | These reconstructed water fluxes can be compared to the fluxes derived from the CoastDat database which contains results from a current and sea state model (Fig. 6) and thus serve as valuable boundary information in the highly dynamic Wadden Sea zone. The combination of these pieces of information will eventually lead to a better understanding of the suspended matter transport, settling and resuspension, processes that are very sensitive to water flow velocity. | ||
| − | [[Image: | + | [[Image:Floeser_6.jpg|thumb|left|'''Figure 6''': Time series from August 2000 with ADCP measurements of water flow (red dots), water level (black curve), reconstructed water flow derived from water level and topography (brown dots), and the inflow through the tidal inlet as calculated from the CoastDat database. Considering the poor resolution of the model from which the CoastDat values were derived and the temporal resolution of one hour, the consistence between the reconstructed flow and the CoastDat curve is acceptable.]] |
| − | ====2. Estimation of residence times from salinity signal decay==== | + | |
| + | ====2. Estimation of residence times </br>from salinity signal decay==== | ||
Exchange times of the Wadden Sea water bodies are an important factor determining water quality. In enclosed and semi-enclosed water bodies like the Baltic Sea, oxygen depletion is much more common than in well-mixed waters like the North Sea. Thus, a large exchange time decouples the Wadden Sea water from the German Bight whereas a smaller exchange time reduces the danger of oxygen depletion phenomena. The exchange times are estimated from hydrodynamic models but not measured. | Exchange times of the Wadden Sea water bodies are an important factor determining water quality. In enclosed and semi-enclosed water bodies like the Baltic Sea, oxygen depletion is much more common than in well-mixed waters like the North Sea. Thus, a large exchange time decouples the Wadden Sea water from the German Bight whereas a smaller exchange time reduces the danger of oxygen depletion phenomena. The exchange times are estimated from hydrodynamic models but not measured. | ||
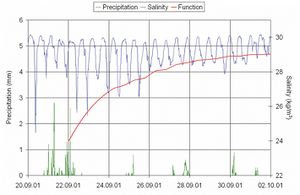
| − | [[Image: | + | [[Image:Floeser_7.jpg|thumb|right|'''Figure 7''': Salinity, precipitation (10 min values) and a fitted curve for the decay of the salinity signal. In the 2001 case, the decay time is 2.5 days, for the 2003 values it is 1.5 days. Changing wind conditions and the spring and neap cycle modify the decay time.]]A large part of the water in the tidal prism leaving the Wadden Sea comes back during the next tide. This means that a small part (5-20 %) of the water body is replaced by “fresh” North Sea water. As a consequence, any sudden influence on the water quality inside the Wadden Sea will decay with a characteristic decay time. We consider precipitation as such a signal: rainfall has a much larger influence on Wadden Sea salinity than that of the North Sea, simply due to the low average water depth. For an average water depth of 2 m, a precipitation event of 20 mm changes salinity by 1%, whereas the same event would influence the Southern North Sea water (average depth 20 m) only by 0.1 %. |
If a stronger precipitation event in the Wadden Sea is followed by some days without rain, the signal (lower salinity) created by the freshwater input should decay with the characteristic “Wadden Sea time scale” that can be derived from the measurements (Fig. 7). This measured exchange time is altered by wind (high wind speed enhances exchange processes) and the spring/neap tidal cycle (at spring tide, flow velocities are twice as fast as during neap tide). | If a stronger precipitation event in the Wadden Sea is followed by some days without rain, the signal (lower salinity) created by the freshwater input should decay with the characteristic “Wadden Sea time scale” that can be derived from the measurements (Fig. 7). This measured exchange time is altered by wind (high wind speed enhances exchange processes) and the spring/neap tidal cycle (at spring tide, flow velocities are twice as fast as during neap tide). | ||
It is planned to compare the time scales derived from this method to numerical tracer experiments and thus to extend the determination of characteristic residence time scales at the location of the piles to the entire *Wadden Sea. | It is planned to compare the time scales derived from this method to numerical tracer experiments and thus to extend the determination of characteristic residence time scales at the location of the piles to the entire *Wadden Sea. | ||
| − | |||
| − | |||
| − | |||
<br/> | <br/> | ||
<br/> | <br/> | ||
| − | + | ||
| + | |||
| + | ==Related articles== | ||
| + | :[[The heat budget of tidal flats]] | ||
| + | :[[The backbarrier tidal flats in the southern North Sea - A multidisciplinary approach to reveal the main driving forces shaping the system]] | ||
| + | |||
| + | |||
{{author | {{author | ||
|AuthorID=12975 | |AuthorID=12975 | ||
| Line 63: | Line 73: | ||
| − | [[Category: | + | [[Category:Physical coastal and marine processes]] |
| − | [[Category: | + | [[Category:Coastal and marine observation and monitoring]] |
| − | [[Category: | + | [[Category:Hydrodynamics]] |
Latest revision as of 13:59, 2 July 2023
Contents
Introduction
The coupling between the German Bight and the Wadden Sea is of high importance for the cycles of matter in this area and significantly affects the state and ecosystem key processes within the Wadden Sea: Sediments in the Wadden Sea are imported from the adjacent areas of the German Bight and overturned and decomposed there, and dissolved nutrients are exported from the Wadden Sea, depending on the nature and the time scale of internal and exchange processes. The German Bight and the Wadden Sea are highly dynamic natural environments characterised by strongly varying physical impact from tidal currents and waves and significant changes in water temperature, salinity, and suspended matter concentration, to name a few parameters. This temporal and spatial variability requires long-term observations to understand the exact nature of exchange processes and to determine the direction of fluxes and the relevant time scales on which they occur. It is, for example, still unknown whether the Wadden Sea seafloor will grow, by accumulating suspended matter and sand, with sea level rise, or not.
The ideal observational tool would be a continuous monitoring of the exchanged water bodies including the dissolved and suspended matter and the bedload transport of the sand over a full cross-section of a tidal inlet connecting the Wadden Sea with the open North Sea. This was partly achieved in the Dutch Wadden Sea, implementing an acoustic doppler current profiler (ADCP) and a conductivity temperature depth sensor (CTD) onboard the ferry connecting Den Helder and Texel. For the German Wadden Sea, a comparable infrastructure is not yet available. As an alternative, GKSS is using fixed piles as permanent multiparameter measuring platforms, complemented by ship cruises checking the representativity of the pile positions.
Methodology
The method comprises three elements: continuous automated measurements at pile stations, ship surveys to assess the representativity of the pile location and repeated sampling at the piles and during ship surveys.
Since 1996, GKSS has operated pile stations at several locations in the German Wadden Sea (Fig. 1 and 2). For practical operation, the position of the piles has to be selected according to the following criteria: limited exposure to waves, allow regular maintenance work, water depth at low water of about 3 m, an optimum between pile stability and water coverage of the sensors at extreme low water. The piles are assembled out of several iron tubes with an outer diameter of 40 cm. A cage is mounted on top which carries solar panels for energy supply, data logger, telemetry units and standard meteorological sensors (Table 1). The overall length of the system amounts to some 15 metres, depending on the tidal range of the particular area. To assure stable fixing the tubes are flushed into the ground by seven metres.An underwater sensor unit (Table 1) is mounted on an elevator bar to raise it regularly for cleaning and to lower it into the operational position. Water level and 1D-wave spectra are measured by means of a floater attached to a readout-rod. All parameters are transmitted by mobile phone to the research centre as 10 min averages (Fig. 4), some parameters (e.g. water level to derive wave spectra) in parallel as five-minute long 2-Hz-time series (parameters in italics in Table 1). For long-term storage they are saved in a data base and published automatically within half an hour on the website of the institute. The piles are operated fully automatically with remote control. Personnel are required on the piles for maintenance work and to collect water samples for calibration. In order to protect the measurement equipment against ice forcing in winter, the observation period usually starts in early spring and ends in late autumn. "Calibration/representativity campaigns" with a cruising research vessel (Fig. 3) are occasionally conducted close to the time series stations in order to convert the point-measurements of water properties to volume fluxes in the tidal channel. These campaigns with the GKSS-owned research vessels “Ludwig Prandtl” and “Storch” are carried out every year in order to extrapolate the point observations taken at the piles to the full channel cross-section at the pile location or even to a larger part of the tidal basin.
Continuous time series of suspended particulate matter concentration (SPMC) and chlorophyll fluorescence are derived by combination of indirect optical and acoustical detection methods with repeated sampling. SPMC of water samples is determined by gravimetric methods. To use chlorophyll fluorescence as a proxy to follow the development of phytoplankton biomass over time, concomitant measurements of PAR (photosynthetic active radiation) irradiance (400-700 nm) allow correcting for photochemical quenching. Fluorescence records are then converted into chlorophyll concentrations on the basis of regular water sample analysis for phytoplankton pigments by High-Performance Liquid Chromatography (HPLC).
Problems
A problem common to all automated instruments in seawater is biofouling. Organisms of various sizes settle on the instruments and modify the measuring values. Regular maintenance is therefore of utmost importance to clean the instruments, in particular the optical surfaces (window for light transmission) and the cables where barnacles eat away the cable protection. The maintenance frequency depends on the seasons: in early spring and late autumn, a cleaning once in two weeks is sufficient, in late spring and summer this interval has to be reduced to 4-5 days. Floc- and grain-size of the suspended matter changes with tidal phase and season, as does the relationship between sample SPMC and the optical and acoustical detection signals. This creates additional uncertainty in the SPMC-time-series, as sampling can occur only at widely scattered times. In wintertime, when suspended sediment dynamics is expected to be highest, the stations must be removed because on the one hand ice may damage the pole, and on the other hand the energy supply of the solar panels may not be sufficient to operate the instruments.
Applications
1. Calculation of water exchange in the Langeoog-Baltrum bight using gauge level and hypsographic data
From the water level measured at the pole station we calculate for every time step the total water content of the backbarrier area (for this purpose, the system’s topography must be known). Taking two subsequent volumes, a water flux in the respective time span can be calculated. In order to correlate this point measurement to a flux representative for the entire area, ship-based ADCP measurements of the water fluxes in the tidal inlet must be performed. This has been done, e.g., in the bight between the East Frisian Islands Langeoog and Baltrum, on four occasions in May and August 2000. The flux values are compared to the values obtained from the ADCP measurements during the ship cruises (Fig. 5). The correlation is satisfactory; thus water fluxes through the tidal inlet can be calculated from the pole gauge data for the entire operation time of the station (Fig. 6). These reconstructed water fluxes can be compared to the fluxes derived from the CoastDat database which contains results from a current and sea state model (Fig. 6) and thus serve as valuable boundary information in the highly dynamic Wadden Sea zone. The combination of these pieces of information will eventually lead to a better understanding of the suspended matter transport, settling and resuspension, processes that are very sensitive to water flow velocity.
2. Estimation of residence times from salinity signal decay
Exchange times of the Wadden Sea water bodies are an important factor determining water quality. In enclosed and semi-enclosed water bodies like the Baltic Sea, oxygen depletion is much more common than in well-mixed waters like the North Sea. Thus, a large exchange time decouples the Wadden Sea water from the German Bight whereas a smaller exchange time reduces the danger of oxygen depletion phenomena. The exchange times are estimated from hydrodynamic models but not measured.
If a stronger precipitation event in the Wadden Sea is followed by some days without rain, the signal (lower salinity) created by the freshwater input should decay with the characteristic “Wadden Sea time scale” that can be derived from the measurements (Fig. 7). This measured exchange time is altered by wind (high wind speed enhances exchange processes) and the spring/neap tidal cycle (at spring tide, flow velocities are twice as fast as during neap tide).
It is planned to compare the time scales derived from this method to numerical tracer experiments and thus to extend the determination of characteristic residence time scales at the location of the piles to the entire *Wadden Sea.
Related articles
- The heat budget of tidal flats
- The backbarrier tidal flats in the southern North Sea - A multidisciplinary approach to reveal the main driving forces shaping the system
Please note that others may also have edited the contents of this article.
|
Please note that others may also have edited the contents of this article.
|
Please note that others may also have edited the contents of this article.
|
Please note that others may also have edited the contents of this article.
|
Please note that others may also have edited the contents of this article.
|
