Difference between revisions of "Wave energy converters in coastal structures"
(→Introduction) |
(→Introduction) |
||
| Line 9: | Line 9: | ||
|'''Fig 1: Construction of a coastal structure.''' | |'''Fig 1: Construction of a coastal structure.''' | ||
|} | |} | ||
| − | Coastal works along European coasts are composed of very diverse structures. Many coastal structures are ageing and facing problems of stability, sustainability and erosion. Moreover climate change and especially sea level rise represent a new danger for them. [[Sea dikes|Coastal dykes]] in Europe will indeed be exposed to waves with [[Wave height|heights]] that are greater than the dykes were designed to withstand, in particular all the structures built in shallow water where the depth imposes the maximal amplitude because of wave breaking. | + | Coastal works along European coasts are composed of very diverse structures. Many coastal structures are ageing and facing problems of stability, sustainability and erosion. Moreover climate change and especially sea level rise represent a new danger for them. [[Sea dikes|Coastal dykes]] in Europe will indeed be exposed to [[waves]] with [[Wave height|heights]] that are greater than the dykes were designed to withstand, in particular all the structures built in shallow water where the depth imposes the maximal amplitude because of wave breaking. |
<p> | <p> | ||
These structures need therefore to be modernized and adapted to [[climate change]] on one hand and to increase of [[Maritime_Traffic|maritime traffic]] and size of container carriers on the other hand. | These structures need therefore to be modernized and adapted to [[climate change]] on one hand and to increase of [[Maritime_Traffic|maritime traffic]] and size of container carriers on the other hand. | ||
Revision as of 13:21, 29 August 2012

|
Introduction
|
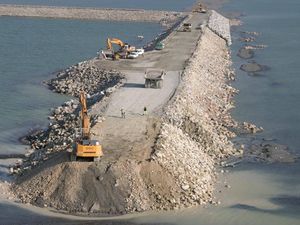
| Fig 1: Construction of a coastal structure. |
Coastal works along European coasts are composed of very diverse structures. Many coastal structures are ageing and facing problems of stability, sustainability and erosion. Moreover climate change and especially sea level rise represent a new danger for them. Coastal dykes in Europe will indeed be exposed to waves with heights that are greater than the dykes were designed to withstand, in particular all the structures built in shallow water where the depth imposes the maximal amplitude because of wave breaking.
These structures need therefore to be modernized and adapted to climate change on one hand and to increase of maritime traffic and size of container carriers on the other hand.
This necessary adaptation will be costly but will provide an opportunity to integrate converters of sustainable energy in the new maritime structures along the coasts and in particular in harbours. This initiative will contribute to the reduction of the greenhouse effect. Produced energy can be directly used for the energy consumption in harbour area and will reduce the carbon footprint of harbours by feeding the docked ships with green energy. Nowadays these ships use their motors to produce electricity power on board even if they are docked. Integration of wave energy converters (WEC) in coastal structures will favour the emergence of the new concept of future harbours with zero emissions.
Contents
Wave energy and wave energy flux
In a sea state, the time-mean wave energy density E per unit horizontal area on the water surface (J/m²) is the sum of kinetic and potential energy density per unit horizontal area. The potential energy density is equal to the kinetic energy [1] both contributing half to the time-mean wave energy density E that is proportional to the wave height squared according to linear wave theory [1]:
(1)
[math]E= \frac{1}{8} \rho g H_{m0}^2[/math]
g is the gravity and [math]H_{m0}^2[/math] the spectral estimate of significant wave height. As the waves propagate, their energy is transported. The energy transport velocity is the group velocity. As a result, the time-mean wave energy flux per unit crest length (W/m) perpendicular to the wave propagation direction, is equal to [1]:
(2)
[math] P= Ec_{g}[/math]
with [math]c_{g}[/math] the group velocity (m/s). Due to the dispersion relation for water waves under the action of gravity, the group velocity depends on the wavelength λ (m), or equivalently, on the wave period T (s). Further, the dispersion relation is a function of the water depth h (m). As a result, the group velocity behaves differently in the limits of deep and shallow water, and at intermediate depths:
[math](\frac{\lambda}{20} \lt h \lt \frac{\lambda}{2})[/math]
Application for wave energy converters
For regular waves in deep water:[math]c_{g} = \frac{gT}{4\pi} [/math] and [math]P_{w1} = \frac{\rho g^2}{32 \pi} H_{m0}^2 T[/math]
The time-mean wave energy flux per unit crest length is used as one of the main criteria to choose a site for wave energy converters. If local data are available ([math]H_{m0}^2 [/math], T) for a sea state through in-situ wave buoys for example, satellite data or numerical modelling, the last equation giving wave energy flux [math]P_{w1}[/math] gives a first estimation. Averaged over a season or a year, it represents the maximal energetic resource that can be theoretically extracted from wave energy. If the directional spectrum of sea state variance F (f,[math]\theta[/math]) is known with f the wave frequency (Hz) and [math]\theta[/math] the wave direction (rad), a more accurate formulation is used:
[math]P_{w2} = \rho g\int\int c_{g}(f,h)F(f,\theta) dfd \theta[/math]
|
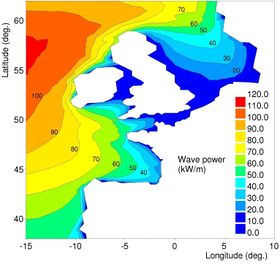
| Fig 2: Time-mean wave energy flux along West European coasts [2]. |
It can be shown easily that equation (4) can be reduced to (3) with the hypothesis of regular waves in deep water. The directional spectrum is deduced from directional wave buoys, SAR images or advanced spectral wind-wave models, known as third-generation models, such as WAM, WAVEWATCH III, TOMAWAC or SWAN. These models solve the spectral action balance equation without any a priori restrictions on the spectrum for the evolution of wave growth.
From TOMAWAC model, the near shore wave atlas ANEMOC along the coasts of Europe and France based on the numerical modelling of wave climate over 25 years has been produced [3]. Using equation (4), the time-mean wave energy flux along West European coasts is obtained (see Fig. 2). This equation (4) still presents some limits like the definition of the bounds of the integration. Moreover, the objective to get data on the wave energy near coastal structures in shallow or intermediate water requires the use of numerical models that are able to represent the physical processes of wave propagation like the refraction, shoaling, dissipation by bottom friction or by wave breaking, interactions with tides and diffraction by islands.
The wave energy flux is therefore calculated usually for water depth superior to 20 m. This maximal energetic resource calculated in deep water will be limited in the coastal zone:
- at low tide by wave breaking;
- at high tide in storm event when the wave height exceeds the maximal operating conditions;
- by screen effect due to the presence of capes, spits, reefs, islands,...
Technologies
According to the International Energy Agency (IEA), more than hundred systems of wave energy conversion are in development in the world. Among them, many can be integrated in coastal structures. Evaluations based on objective criteria are necessary in order to sort theses systems and to determine the most promising solutions.
Criteria are in particular:
- the converter efficiency : the aim is to estimate the energy produced by the converter. The efficiency gives an estimate of the number of kWh that is produced by the machine but not the cost.
- the converter survivability : the capacity of the converter to survive in extreme conditions. The survivability gives an estimate of the cost considering that the weaker are the extreme efforts in comparison with the mean effort, the smaller is the cost.
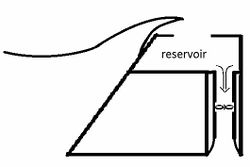
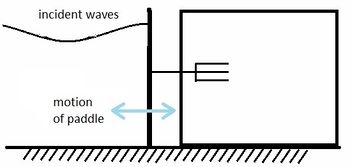
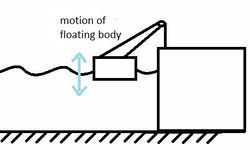
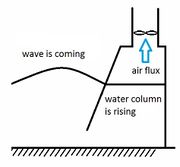
Unfortunately, few data are available in literature. In order to determine the characteristics of the different wave energy technologies, it is necessary to class them first in four main families [2].
An interesting result is that the maximum average wave power that a point absorber can absorb [math]P_{abs} [/math](W) from the waves does not depend on its dimensions [4]. It is theoretically possible to absorb a lot of energy with only a small buoy. It can be shown that for a body with a vertical axis of symmetry (but otherwise arbitrary geometry) oscillating in heave the capture (or absorption) width [math]L_{max}[/math](m) is as follows [4]:
[math]L_{max} = \frac{P_{abs}}{P_{w}} = \frac{\lambda}{2\pi}[/math] or [math]1 = \frac{P_{abs}}{P_{w}} \frac{2\pi}{\lambda}[/math]
|
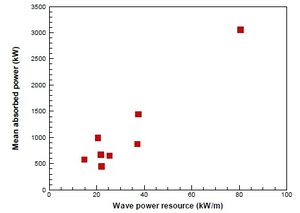
| Fig 4: Upper limit of mean wave power absorption for a heaving point absorber. |
where [math]{P_{w}}[/math] is the wave energy flux per unit crest length (W/m). An optimally damped buoy responds however efficiently to a relatively narrow band of wave periods.
Babarit et Hals propose [5] to derive that upper limit for the mean annual power in irregular waves at some typical locations where one could be interested in putting some wave energy devices. The mean annual power absorption tends to increase linearly with the wave power resource. Overall, one can say that for a typical site whose resource is between 20-30 kW/m, the upper limit of mean wave power absorption is about 1 MW for a heaving WEC with a capture width between 30-50 m.
In order to complete these theoretical results and to describe the efficiency of the WEC in practical situations, the capture width ratio [math]\eta[/math] is also usually introduced. It is defined as the ratio between the absorbed power and the available wave power resource per meter of wave front times a relevant dimension B [m].
[math]\eta = \frac{P_{abs}}{P_{w}B} [/math]
The choice of the dimension B will depend on the working principle of the WEC. Most of the time, it should be chosen as the width of the device, but in some cases another dimension is more relevant. Estimations of this ratio [math]\eta[/math] are given [5]: 33 % for OWC, 13 % for overtopping devices, 9-29 % for heaving buoys, 20-41 % for pitching devices. For energy converted to electricity, one must take into account moreover the energy losses in other components of the system.
Civil engineering
Never forget that the energy conversion is only a secondary function for the coastal structure. The primary function of the coastal structure is still protection. It is necessary to verify whether integration of WEC modifies performance criteria of overtopping and stability and to assess the consequences for the construction cost.
Integration of WEC in coastal structures will always be easier for a new structure than for an existing one. In the latter case, it requires some knowledge on the existing coastal structures. Solutions differ according to sea state but also to type of structures (rubble mound breakwater, caisson breakwaters with typically vertical sides). Some types of WEC are more appropriate with some types of coastal structures.

|

|

|

|
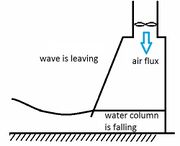
| Fig 5: Several OWC (Oscillating water column) configurations (by Wavegen – Voith Hydro). | |
Environmental impact
Wave absorption if it is significant will change hydrodynamics along the structure. If there is mobile bottom in front of the structure, a sand deposit can occur. Ecosystems can also be altered by change of hydrodynamics and but acoustic noise generated by the machines.
|
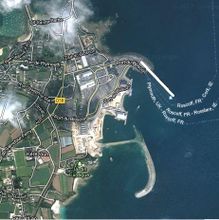
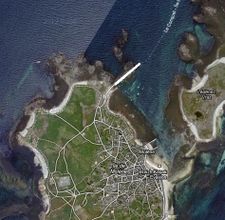
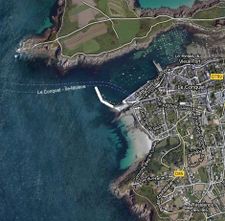
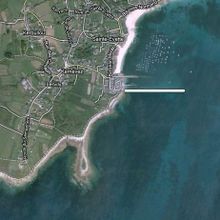
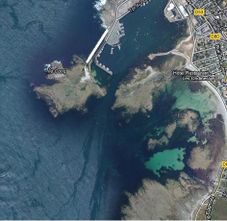
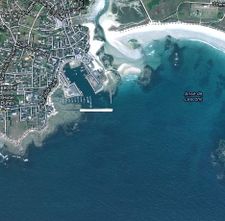
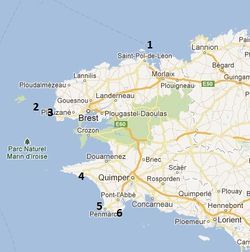
| Fig 6: Finistere area and locations of the six sites (google map). |
Study case: Finistere area
Finistere area is an interesting study case because it is located in the far west of Brittany peninsula and receives in consequence the largest wave energy flux along the French coasts (see Fig.2). This area with a very ragged coast gathers moreover many commercial ports, fishing ports, yachting ports. The area produces a weak part of its consumption and is located far from electricity power plants. There are therefore needs for renewable energies that are produced locally. This issue is important in particular in islands. The production of electricity by wave energy will have seasonal variations. Wave energy flux is indeed larger in winter than in summer. The consumption has peaks in winter due to heating of buildings but the consumption in summer is also strong due to the arrival of tourists.
Six sites are selected (see figure 7) for a preliminary study of wave energy flux and capacity of integration of wave energy converters. The wave energy flux is expected to be in the range of 1 – 10 kW/m. The length of each breakwater exceeds 200 meters. The wave power along each structure is therefore estimated between 200 kW and 2 MW. Note that there exist much longer coastal structures like for example Cherbourg (France) with a length of 6 kilometres.
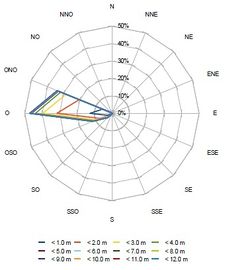
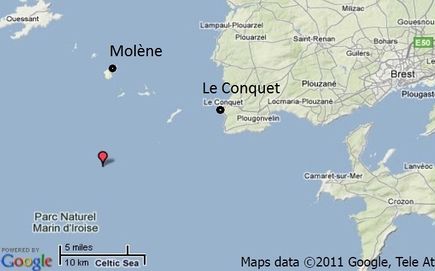
Wave power flux along the structure depends on local parameters: bottom depth that fronts the structure toe, the presence of caps, the direction of waves and the orientation of the coastal structure. See figure 8 for the statistics of wave directions measured by a wave buoy located at the Pierres Noires Lighthouse. These measurements show that structures well-oriented to West waves should be chosen in priority. Peaks of consumption occur often with low temperatures in winter coming with winds from East- North-East directions. Structures well-oriented to East waves could therefore be also interesting even if the mean production is weak.
|
|
| Fig 8: Wave measurements at the Pierres Noires Lighthouse. | |
Conclusion
Wave energy converters (WEC) in coastal structures can be considered as a land renewable energy. The expected energy can be compared with the energy of land wind farms but not with offshore wind farms whose number and power are much larger. As a land system, the maintenance will be easy. Except the energy production, the advantages of such systems are :
- a “zero emission” port ;
- industrial tourism ;
- test of WEC for future offshore installations.
Acknowledgement
This work is in progress in the frame of the national project EMACOP funded by the French Ministry of Ecology, Sustainable Development and Energy.
References
- ↑ 1.0 1.1 1.2 Mei C.C. (1989) The applied dynamics of ocean surface waves. Advanced series on ocean engineering. World Scientific Publishing Ltd
- ↑ 2.0 2.1 Mattarolo G., Benoit M., Lafon F. (2009), Wave energy resource off the French coasts: the ANEMOC database applied to the energy yield evaluation of Wave Energy, 10th European Wave and Tidal Energy Conference Series (EWTEC’2009), Uppsala (Sweden)
- ↑ Benoit M. and Lafon F. (2004) : A nearshore wave atlas along the coasts of France based on the numerical modeling of wave climate over 25 years, 29th International Conference on Coastal Engineering (ICCE’2004), Lisbonne (Portugal), 714-726.
- ↑ 4.0 4.1 De O. Falcão A. F. (2010) Wave energy utilization: A review of the technologies. Renewable and Sustainable Energy Reviews, Volume 14, Issue 3, April 2010, Pages 899–918.
- ↑ 5.0 5.1 Babarit A. and Hals J. (2011) On the maximum and actual capture width ratio of wave energy converters – 11th European Wave and Tidal Energy Conference Series (EWTEC’2011) – Southampton (U-K).
With contributions by: François Bouttes, Bertrand Michard, Alain Clément, Aurélien Babarit, Virginie Baudry, Michel Benoit and Giovanni Mattarolo
|
