File list
This special page shows all uploaded files.
| Date | Name | Thumbnail | Size | Description | Versions |
|---|---|---|---|---|---|
| 16:16, 3 September 2012 | Eez.jpg (file) |  |
218 KB | 1 | |
| 16:14, 3 September 2012 | Zonesmaritimes.jpg (file) |  |
231 KB | 1 | |
| 16:14, 3 September 2012 | Imo states.png (file) |  |
98 KB | 1 | |
| 16:12, 3 September 2012 | Unclos states.png (file) |  |
138 KB | 1 | |
| 16:11, 3 September 2012 | Imo logo.png (file) |  |
66 KB | 1 | |
| 16:11, 3 September 2012 | Unclos logo.png (file) |  |
7 KB | 1 | |
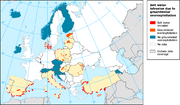
| 17:39, 1 February 2008 | Saltwater intrusion.png (file) |  |
195 KB | 1 | |
| 17:38, 1 February 2008 | Input oil pollution.png (file) |  |
10 KB | 1 | |
| 17:38, 1 February 2008 | Cost oil spill.png (file) |  |
6 KB | 1 | |
| 17:38, 1 February 2008 | Volume oil spills.png (file) |  |
8 KB | 1 | |
| 17:37, 1 February 2008 | Number oil spills.png (file) |  |
7 KB | 1 | |
| 17:16, 12 July 2007 | Anthracene.png (file) |  |
2 KB | 1 | |
| 16:03, 12 July 2007 | Alachlor.png (file) |  |
5 KB | 1 | |
| 09:01, 12 July 2007 | Thick oil on rocky beach.JPG (file) |  |
41 KB | 1 | |
| 09:39, 24 April 2007 | Exchange fluxes with mixing.PNG (file) |  |
14 KB | 1 | |
| 09:39, 24 April 2007 | Exchange fluxes for sharp interface.PNG (file) |  |
10 KB | 1 | |
| 13:45, 12 April 2007 | Definition of subareas.PNG (file) |  |
12 KB | 1 | |
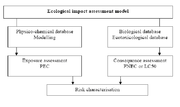
| 13:45, 12 April 2007 | Ecological impact assessment model.PNG (file) |  |
20 KB | 1 | |
| 13:44, 12 April 2007 | Sensitivity score map.PNG (file) |  |
40 KB | 1 | |
| 13:43, 12 April 2007 | Sensitivity analysis methodology.PNG (file) |  |
13 KB | 1 | |
| 13:43, 12 April 2007 | Cargo spill risk in BPNS.PNG (file) |  |
10 KB | 1 | |
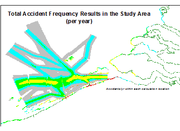
| 13:43, 12 April 2007 | Accident Frequency in BPNS2.PNG (file) |  |
12 KB | 1 | |
| 13:42, 12 April 2007 | Accident Frequency in BPNS.PNG (file) |  |
10 KB | 1 | |
| 13:42, 12 April 2007 | Ship movements in BPNS.PNG (file) |  |
54 KB | 1 | |
| 13:42, 12 April 2007 | Users of the Belgian Part of the North Sea.PNG (file) |  |
65 KB | 1 | |
| 13:41, 12 April 2007 | Belgium Part of the North Sea.PNG (file) |  |
48 KB | 1 | |
| 10:03, 12 April 2007 | Key tasks in environmental risk assessment.PNG (file) |  |
40 KB | 1 | |
| 17:05, 30 March 2007 | Dimi biomarkers5.jpg (file) |  |
40 KB | 1 | |
| 17:05, 30 March 2007 | Dimi biomarkers4.jpg (file) | 24 KB | 1 | ||
| 17:05, 30 March 2007 | Dimi biomarkers3.jpg (file) |  |
15 KB | 1 | |
| 17:05, 30 March 2007 | Dimi biomarkers2.jpg (file) |  |
31 KB | 1 | |
| 17:04, 30 March 2007 | Dimi biomarkers1.jpg (file) |  |
22 KB | 1 | |
| 13:22, 26 March 2007 | Broc mixing4.jpg (file) |  |
6 KB | Illustration of the influence of macrovortices in the nearshore - transport of passive tracers. | 1 |
| 13:22, 26 March 2007 | Broc mixing3.jpg (file) |  |
4 KB | Illustration of the influence of macrovortices in the nearshore - picture of the beach landscape. | 1 |
| 13:21, 26 March 2007 | Broc mixing2.jpg (file) |  |
7 KB | Illustration of the influence of macrovortices in the nearshore - quantitative description of the macrovortices forcing the transport. | 1 |
| 13:20, 26 March 2007 | Broc mixing1.jpg (file) |  |
4 KB | Illustration of the influence of macrovortices in the nearshore - modelled water surface elevation of the storm event | 1 |