Optical measurements in coastal waters
This article gives an introduction of the instruments available (and the application of these instruments) to measure optical properties in coastal waters. Attention is paid to optical measurements in general, regional characteristics and implications for remote sensing.
Contents
Introduction
Optical measuments using satellite and airborne sensors is a powerful, operational tool for monitoring coastal zones. This technology can provide accurate, large-scale, synoptic environmental information essential for understanding and managing marine ecosystems. Optical sensor data allows the assessment of in-water properties, such as suspended matter or phytoplankton concentration, benthic substrate type, vegetation composition, and bathymetry. Optical sampling methods enable for example the continuous and contactless measurement of sediment concentrations, which is an important advantage compared to the mechanical sampling methods.
Theoretical background and terminology
Optical characteristics of a light-transmitting medium can be specified in terms of its inherent optical properties (IOPs). The main IOPs are:
- the absorption coefficient (a) (m-1)
- the scattering coefficient (b) (m-1)
- the attenuation coefficient (c), with c = a + b (m-1)
- the scattering phase function (β) (sr-1)
The total IOPs of a body of seawater can be considered as the sum of the partial contributions from water itself and a number of optically significant constituents. Four classes of constituents can be distinguished:
- Phytoplankton cells and colonies (Phyt)
- Mineral suspended solids (MSS)
- Coloured dissolved organic matter (CDOM)
- Organic suspended solids or detritus (OSS)
For more information, see Light fields and optics in coastal waters.
Sensor deployment issues
Instruments
Submersible instruments are available from several specialist manufacturers, generally small companies established by researchers who have themselves made significant contributions to the field. Examples include WET Labs, HobiLabs and Bioshperical Instruments in the US, Satlantic in Canada and Trios in Germany. See also the articles: Optical Laser diffraction instruments (LISST), Optical backscatter point sensor (OBS) and Use of Lidar for coastal habitat mapping.
Autonomous operation
Many instruments can be configured for autonomous operation with a data logger or for direct readout through a connecting cable. Autonomous operation usually makes deployment from ships more convenient and is obviously required on moorings. On the other hand, a connecting cable provides real-time monitoring and control of measurements and can also be used to provide electrical power.
Profiling measurements
Sensors mounted in an open protective frame can be lowered on a cable from a research vessel, but it can be difficult to maintain depth and orientation with sufficient precision when the ship moves in a swell. For radiometric measurements, it is particularly important to avoid the perturbing effects of the shadow of the ship or mooring structure on the underwater light field. These effects can be minimised by positioning the vessel so that the lowering location is facing into the sun, and by using an extended boom where possible. Free-fall packages connected to the ship by a loose cable have a number of advantages: they can be adjusted to fall at a predetermined velocity, are decoupled from ship motions, and can usually be moved some distance from the ship by relative motion imparted by tide or wind.
Moorings
Optical sensors generally have low power requirements and can be deployed for long periods from fixed moorings. However in coastal waters problems with fouling of optical windows and light paths are frequently encountered. Some manufacturers supply sensors fitted with copper shields or intake tubes, and occasionally with mechanical wipers for windows, but a fully reliable solution has yet to be demonstrated.
Radiometric measurements
Submersible sensors are available for planar and scalar irradiance measurements, using flat and spherical diffusers, and for radiance measurements with typical acceptance angles of 5-10°. It is useful to distinguish between different classes of radiance and irradiance meters based on their spectral resolution. PAR sensors have a single detector and a filter whose absorption characteristics are adjusted to provide the required quantum response from 400-700 nm. Multi-waveband sensors use individual photodiode and filter combinations for each channel, and typically have bandwidths of the order of 10 nm. High resolution (sometimes called hyperspectral) sensors employ miniature spectrographs and silicon detector arrays, and can have spectral resolutions of the order of a few nanometers. The sensitivity of a radiometric sensor is largely determined by size of the detecting element, typically square millimetres for a multi-waveband sensor and square microns for a high resolution sensor. Consequently high resolution sensors generally have limited sensitivity, which can limit their use as profiling instruments in coastal conditions.
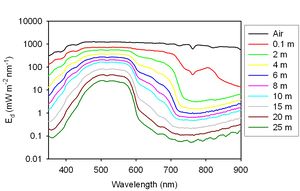
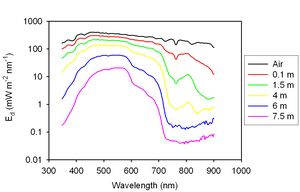
Figures 1 and 2 show typical measurements of light field profiles in the Bristol Channel and Irish Sea. The most obvious feature of both plots is the rapid loss with depth of blue wavelengths due to absorption by CDOM and MSS and of red wavelengths due to absorption by water. The increased attenuation in the Bristol Channel is due mainly to mineral particles in suspension.
The constituent concentrations were:
- Figure 1: Chl = 0.86 mg m-3, CDOM = 0.16 m-1, MSS = 0.33 g m-3
- Figure 2: Chl = 0.2 mg m-3, CDOM = 0. 11 m-1, MSS = 9.2 g m-3
|
Inherent Optical Property (IOP) measurements
Instrumentation
The total coefficients of absorption (a) and attenuation (c) can be obtained using dual tube spectrophotometers which come in 9-waveband and continuous spectral versions (Wetlabs). Total scattering coefficients are then calculated from the difference of the two measured variables. Several instruments for measuring backscattering coefficients are available, including the Hydroscat series from Hobilabs and the ECO BB and VSF series from WET Labs. Backscattering measurements are made at one or more fixed angles and extrapolated using an assumed phase function to give a value for the entire backward hemisphere. The effect of attenuation on the signals measured by backscattering meters has to be explicitly taken into account. Nearly all instruments have limitations in their range of linear response, and this can pose problems in turbid coastal waters.
IOP Partitioning
Partitioning of in situ measurements of total IOPs into the contributions of different classes of optically significant material usually requires ancillary measurements. The proportion of the total absorption coefficient due to dissolved material can be determined by filtering water samples through a 0.2 μm membrane filter. Phytoplankton pigment absorption can be separated from detrital absorption by collecting suspended material on a glass fibre filter and bleaching or extracting the pigments. The greatest difficulty is the partitioning of the scattering and backscattering coefficients between phytoplankton and mineral particles. Since the two constituents cannot be physically separated, their contribution to scattering is usually estimated using statistical regression techniques. The calculation of absorption coefficients for materials collected on glass fibre filters requires the determination of a ‘path length amplification factor’. There are several published approaches to determining this factor, and the most widely adopted is probably that of Bricaud and Stramski (1990[1]). It is also possible to determine the conversion factors empirically by direct comparison with ac-9 measurements carried out at the position from which the sample was taken. Figures 3 and 4 show the results obtained using these procedures for an extensive data set from the Irish Sea, British Channel and coastal waters of SW Scotland. The data points show average values in ac-9 wavebands, and the error bars indicate standard deviations.
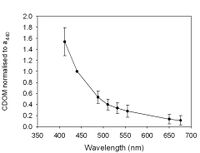
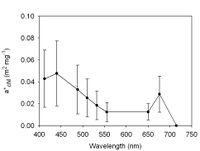
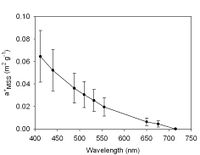
Figure 3: Specific absorption cross sections for the three main classes of optically significant materials.
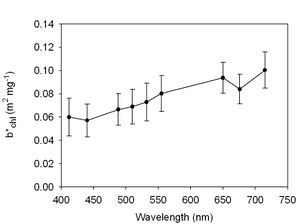
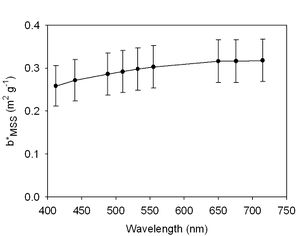
Figure 4: Specific scattering cross sections for Phyt and MSS solids.
Regional characteristics
There are strong regional variations in the light fields of coastal waters, and also temporal patterns which may arise from enhanced mixing during the winter months or seasonal changes in freshwater run-off. Estuaries and shallow tidal areas often have optical properties dominated by suspended sediment, with shallow euphotic depths and high blue light attenuation. Areas with high freshwater inputs, including fjords and the Baltic Sea, generally have high CDOM levels. This has interesting consequences for phytoplankton growth, since the reduced salinity creates a buoyant layer which promotes surface bloom development while the loss of light due to CDOM absorption inhibits growth deeper in the water column. In spite of relatively high turbidity levels, eutrophicated areas with sufficient tidal stirring such as the Dutch coast may support intense phytoplankton blooms for most of the spring and summer seasons.
Implications for remote sensing
In Case 1 waters, which are usually deep and free of terrestrial influence, variations in optical properties are linked to chlorophyll concentration. In Case 2 waters, which include most coastal regions, the concentrations of the optically significant constituents can vary independently of each other. Interpreting optical remote sensing signals from Case 2 waters is particularly challenging (see for example IOCCG Report No 3[2] and Miller et al, 2005[3]) and standard band ratio algorithms frequently produce erroneous results. The problem is exacerbated by the fact that the atmospheric correction algorithms used for marine remote sensing often assume zero reflectance in the near infra-red, and this may not be valid for turbid waters.
In optically shallow coastal areas (where the physical depth is less than 1/Kd), the reflectance of the sea bed can be detected by radiometers or lidar systems mounted on aircraft (see also Use of Lidar for coastal habitat mapping). This opens up possibilities of optical bathymetric mapping in regions which are not easily accessible to surface craft, and of habitat classification by optical remote sensing. In general, however, both shallow-water surveying and deep-water remote sensing in the coastal region require a more sophisticated approach than is employed in standard band-ratio algorithms. This is currently a very active research area. One promising approach is the development of spectral matching techniques, in which an observed water-leaving radiance spectrum is compared to a library of spectra calculated for different constituent concentrations and bottom reflectivity using radiative transfer modelling. The success of this approach depends on more extensive studies of the variability of specific IOPs in coastal waters.
See also
Internal links
- Light fields and optics in coastal waters
- Optical remote sensing
- General principles of optical and acoustical instruments
- Satellite-derived nearshore bathymetry
- Oil spill monitoring
- Optical Laser diffraction instruments (LISST)
- Optical backscatter point sensor (OBS)
- Use of Lidar for coastal habitat mapping
- Ships of opportunity and ferries as instrument carriers
- Instruments and sensors to measure environmental parameters
- Satellite-derived nearshore bathymetry
- HyMap: Hyperspectral seafloor mapping and direct bathymetry calculation in littoral zones
- Differentiation of major algal groups by optical absorption signatures
Further reading
- Babin M and Stramski D 2002 Light absorption by aquatic particles in the near-infrared spectral region. Limnology and Oceanography 47:911-915
- Babin, M, Morel A, Fournier-Sicre V, Fell F and Stramski D 2003. Light scattering properties of marine particles in coastal and oceanic waters as related to the particle mass concentration. Limnology and Oceanography, 48, 843-859
References
- ↑ Bricaud A and Stramski D 1990 Spectral absorption coefficients of living phytoplankton and nonalgal biogenous matter: A comparison between the Peru upwelling area and the Sargasso Sea. Limnol. Oceanogr., 35(3), 1990, 562-582
- ↑ IOCCG 2000 Remote sensing of ocean colour in coastal, and other optically complex waters. Sathyendranath, S (ed) Reports of the International Ocean-Colour Coordinating Group No. 3, IOCCG, Dartmouth, Canada.
- ↑ Miller R, Del-Castillo C and McKee B (eds) 2005 Remote sensing of coastal aquatic environments. Springer, Dordrecht 347p
Please note that others may also have edited the contents of this article.
|
