Shoreface nourishment
Definition of Shoreface nourishment:
Artificial sand supply in the subtidal active zone of the coastal profile with sand imported from a source outside the active coastal zone.
This is the common definition for Shoreface nourishment, other definitions can be discussed in the article
|
Contents
Why shoreface nourishment
Shoreface nourishment is mainly intended to halt shoreline retreat. It is less effective for beach widening. If offshore sand borrow locations are abundant and not far away, the price per m3 is substantially lower than for beach nourishment. Sand can be deposited by split barges or through rainbowing. Shoreface nourishment programmes contribute to the long-term sand balance of the coastal zone if the volume of nourished sand is on average much larger than sand losses to deep water, beyond the seaward boundary of the active coastal zone where almost no wave-induced sand transport occurs. Accurate estimates of the net sand transport to deep water are beyond the possibilities of present measurement techniques. However, model simulations provide evidence that net sand transport across the seaward boundary of the active coastal zone (estimated depth of 20 m on the Dutch coast) is very small and more likely to be landward than seaward directed[1]. This probably also holds for other gently sloping coastal zones situated on wide continental shelves[2]. The long-term positive sand balance of shoreface nourishments thus creates a sand buffer that is progressively spread over the active coastal zone by longshore and cross-shore transport processes and so contributes to raising the seafloor and mitigating the effect of sea level rise.
Experience from shoreface nourishments on the Dutch coast
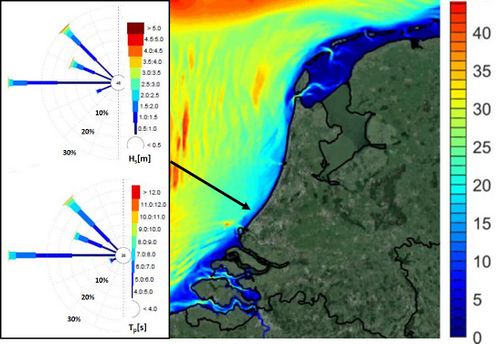
In 1990, the Dutch government has adopted a coastline maintenance policy by means of sand nourishments. From that time, more than 300 nourishments have been carried out, of which 90 shoreface nourishments with a total volume of about 160 Mm3. From the experience of these nourishments some rules of thumb have been derived to optimize the effectiveness of shoreface nourishments. These rules pertain to the Dutch coastal conditions, shown in Fig. 1. Similar characteristics are found at sandy coasts along many other shelf seas.

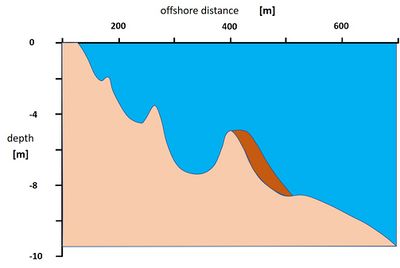
Along the Dutch coast, long-term net shoreline retreat is related to the long-term net offshore migration of nearshore sandbars (see the article Nearshore sandbars). Most shoreface nourishments are applied as an artificial bar just seaward of the outer bar (Fig. 2); some other nourishments have been placed in the trough between the outer and inner bar. The lifetime of the artificial nourished bar is the time from nourishment until integration of the artificial bar into the original bar pattern and the resumption of the offshore migration cycle.
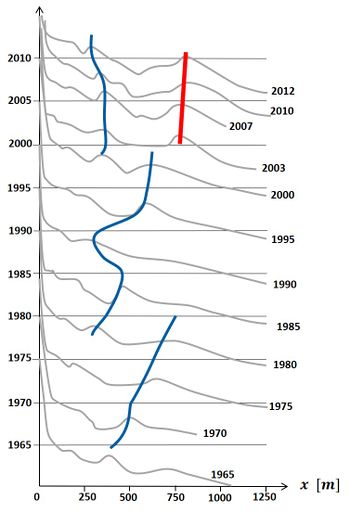
The evaluation of the nourishments brought forward the following observations about the effects and effectiveness[4][3][5][6], see also Fig. 3:
- The nourishments were effective to stop the offshore bar cycle during the lifetime of the nourishment;
- The lifetime of the nourishments increased with increasing nourishment concentration (the sand volume nourished per meter);
- The lifetime of the nourishments increased with increasing grainsize;
- The lifetime of the nourishments increased with increasing placement depth;
- The lifetime of the nourishments increased with increasing bar cycle period (the time it takes for an offshore moving bar to reach the position of the preceding bar);
- A more landward position of the nourishment reduced dune erosion during storms;
- A small fraction (less than 10%) of the nourished sand was lost offshore;
- The nourishments developed a trough at the shoreward flank;
- The bar shoreward of the nourishments migrated onshore;
- Part of the nourished sand was distributed alongshore to neighbouring coastal stretches;
- The "feeder effect" of the nourishments (sand supply from the nourishment to the beach) did not reach the supratidal beach;
- Accretion of the supratidal beach occurred in some cases by the "lee effect" of the nourishments – the convergence of longshore sediment transport at the nourishment site due to local reduction of wave heights, with downdrift erosion as a consequence.
Design rules shoreface nourishments[7]

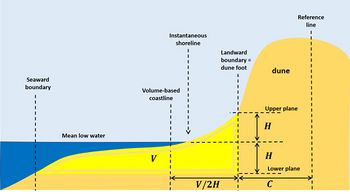
Shoreface nourishments are applied where longshore sandbars are present on the shoreface. The preferred nourishment location is at the seaward side of the outer sandbar (Fig. 2). The average volume of shoreface nourishments is 400-500 m3/m, similar to the volume of the outer bar; the average length is 4 km. This not only stops seaward bar migration, but may even initiate a landward migration of the inner sandbars (Fig. 3). The result is an increase of the sand volume of the subtidal and intertidal beach and a corresponding seaward advance of the coastline (the Dutch definition of shoreline position is related to the supratidal, intertidal and subtidal beach volume, see Fig. 4). Shoreface nourishments are generally most effective in terms of feeding the subtidal beach when their crest is at approximately NAP -5 m. It takes a few years before a shoreface nourishment has an effect on the shoreline position. Shoreface nourishments have an average lifespan of 4–10 years, which is the time that the shoreline resumes its pre-nourishment position.
Related articles
- Shore nourishment
- Beach nourishment
- Experiences with beach nourishments in Portugal
- Shoreface profile
- Nearshore sandbars
- Dealing with coastal erosion
References
- ↑ Grasmeijer, B., Huisman, B., Luijendijk, A., Schrijvershof, R., van der Werf, J., Zijl, F., de Looff, H. and de Vries, W. 2022. Modelling of annual sand transports at the Dutch lower shoreface. Ocean and Coastal Management 217, 105984
- ↑ Anthony, E.J. and Aagaard, T. 2020. The lower shoreface: Morphodynamics and sediment connectivity with the upper shoreface and beach. Earth-Science Reviews 210, 103334
- ↑ 3.0 3.1 Van der Spek, A.F.J. and Elias, E., 2013. The effects of nourishments on autonomous coastal behaviour. Procs. Coastal Dynamics Conf. 2013, pp. 1753-1762
- ↑ Ojeda E., Ruessink, B.G. and Guillen, J. 2008. Morphodynamic response of a two-barred beach to a shoreface nourishment. Coastal Engineering 55: 1185-1196
- ↑ Gijsman, R., Visscher, J. and Schlurmann, T. 2019. The lifetime of shoreface nourishments in fields with nearshore sandbar migration. Coastal Engineering 152, 103521
- ↑ Atkinson, A.L. and Baldock, T.E. 2020. Laboratory investigation of nourishment options to mitigate sea level rise induced erosion. Coastal Engineering 161, 103769
- ↑ Brand, E., Ramaekers, G. and Lodder, Q. 2022. Dutch experience with sand nourishments for dynamic coastline conservation – An operational overview. Ocean and Coastal Management 217, 106008
Please note that others may also have edited the contents of this article.
|

