Fishing past and present: Belgium
Fishing past and present: Belgium
Contents
Introduction
The historical role and importance of inshore waters and Inshore Fisheries in the livelihoods of our coastal communities is undeniable. Today, coastal or inshore waters continue to play a major role for vital processes in the life cycle of fishing resources. At the same time Inshore Fisheries – as a source of income for coastal communities - are subject to major pressures and changes. Until recently in Belgium, there was no quantitative historical assessment of the small-scale fisheries (vessels <12m) within 12 nm or of the fishing activities in the territorial sea or inshore waters of Belgium. The present report aims to improve the understanding of current and historical levels of fishing activity in inshore waters.
In 2010, the Belgian fleet landed a total of 22,000 t. After a maximum of 81,000 t reported landings in 1947, annual landings declined steadily to only 26% of this peak today. Over the last century, 20% of all landed and reported species originated from the coastal shallow waters. The legal framework for commercial Inshore Fisheries activities in Belgium has been defined by different criteria over time. However, since 2006, the legal definition of inshore/coastal fisheries concerns all fishing vessels that have an engine power of 221 kW or less, a tonnage of no more than 70 Gross Tonnage GT, and undertake trips of typically 24 hours with a maximum period of 48 hours. The ‘inshore fleet’ (based on the definition <70GT) represented approximately 63% of the entire fleet in 1960, decreasing to less than 25% of the entire fleet in recent times. Today, less than 20 vessels remain in this category of vessel type. However, today only 7 vessels are officially registered in the ‘coastal fleet segment’. Over the last century, reported landings from the ‘inshore’ waters amount to 841,700t. The median of annual reported landings was 8,100t with a peak value of 60,500t in 1943 and a minimum of 1900t in recent times (2007). In terms of the species composition of the landings, the trends in Inshore Fisheries are quite similar to that of the overall fleet: a first period (1929-1940) characterized by pelagic and shrimp fisheries, is followed by a peak in landings of pelagic species during and after World War II (1942-1964). Cod is the dominant species in the reported landings from 1965-1987. After the mid 1980s the composition of the reported landings is less dominated by a single species. Herring and sprat (49%), brown shrimp (12%), cod (9%), plaice (6%), whiting (4%) and sole (3%) represent an important proportion over the entire period. Direct employment in commercial Inshore Fisheries has decreased by 94% between 1954 and 2012 (from 680 to 37 Full Time Equivalent, FTE), compared to a decrease of approximately 75% in the total commercial fleet. The economic value of the landings originating from inshore waters, has represented approximately 25% of the overall economic value of the sector (data 1935-2007). Unlike the increase and decline of economically important fishing grounds over the last centuries, the coastal or inshore waters have been a stable source of food for the population and employment and income for the industry.
This present report provides an overview of the results of the GIFS project study on ‘Inshore Fisheries past and present’, for the particular case of Belgium. The purpose of this research is to provide a longer-term perspective on the importance of Belgian Inshore Fisheries to coastal communities and shed a light on its future potential as a sustainable source of local food, employment and as an economic resource. The work reconstructs time-series on inshore fishing activities (fleet, landings, economic value, employment, unaccounted catches). It contributes to the knowledge of fishing activities in inshore waters, past and present, based on the best available scientific data and information. The time-series and trends demonstrate the historical importance of inshore fiseries, but also underline the challenging social economic and environmental conditions in which the inshore fleet is operating, within the fishing industry. The results help to better inform the public on current and historical levels of fishing activity in inshore waters and suggest its potential role in the future. They can support informed decision making towards more sustainable fishing in particular for the inshore waters. The report also provides an overview of relevant historical sources that can be of use for similar exercises in other countries.
Objectives
The GIFS approach aimed to construct a common view of Inshore Fisheries throughout the project study area (Figure 1), and their relative importance in the sector as a whole (all fishing activities including offshore and large-scale fisheries). By means of an inventory of data sources and subsequent digitization, quality control, standardization and integration of historical data, this approach aimed to answer:
- How did the inshore fleet and its activities change over time?
- How did economic value, volume and composition of landings of Inshore Fisheries change over time?
- How did employment in Inshore Fisheries change over time?
- How do the trends and issues above relate to those in the fisheries sector as a whole?
What information sources are available to document the historical relevance of Inshore Fisheries in the study area from the parameters described above?
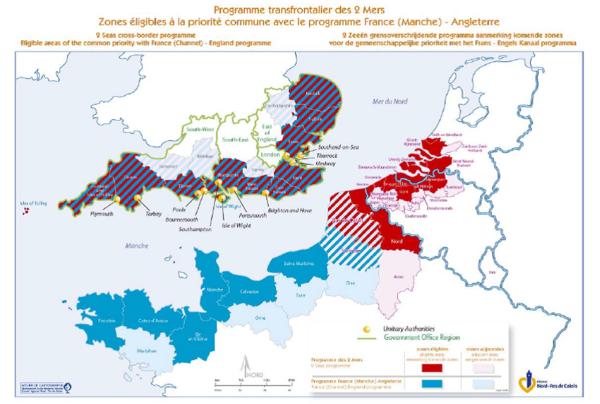 Figure: Eligible areas of the INTERREG 2 SEAS cross-border programme Historical time-series that address the above questions are scarce and data collections date from after the start of intensive exploitation. In Belgium, centralized reporting on landings of sea fisheries at the species level started in 1929 (Lescrauwaet et al. 2010). Besides the gaps in historical information, there is no quantitative assessment of the small-scale fisheries (vessels <12m) within 12 nm or the fishing activities in the territorial sea of Belgium. Method & MaterialsResultsReconstructed time-series and results for Inshore fisheriesEntire FleetThe data integration covers the period from 1830 to 2010. In spite of the data gaps (1865-1871 and 1915-1918, see Annex B) the time-series reconstructs the overall trend in total number of fishing vessels. From the beginning of reporting, the total number of vessels increased from 145 in 1832 to 274 in 1864, nearly duplicating in 3 decades (Figure 3). This increase is explained as a direct effect of the system of subsidies (De Zuttere 1909). Oostende remained the most important port throughout this period and the next period of reporting (1892-1911.), as it was more apt to receive larger vessels. The facilities of the new port of Zeebrugge were inaugurated in 1907. The fishing port of Nieuwpoort, the settlements of Heist and Blankenberge to the east, and De Panne/Adinkerke and Oostduinkerke/Koksijde to the west also harboured an important number of vessels. Most of these vessels were inshore vessels that stranded on the beaches to disembark the produce, or used the neighbouring ports of Nieuwpoort, Blankenberge and later Zeebrugge to do so. By the end of the 19th century, Oostende increasingly focused on ‘fresh fish’ catches during winter, in particular with the appearance of steam trawlers from 1884-1887 onwards. De Panne/Adinkerke, Oostduinkerke/Koksijde, Heist and Blankenberge were home to vessels of coastal fisheries and fishing areas at shorter distances. A maximum total number of 630 fishing vessels was reported in 1913 (Commissie voor Zeevisscherij 1913), at the outbreak of the First World War (WWI, 1914-1918). At the eve of WWI, the new port infrastructure of Zeebrugge was harbour to 20 sailing vessels, Oostende to 327 of which 29 steamers, followed by De Panne (87), Heist (67), Blankenberge (67), Nieuwpoort (37) and Oostduinkerke/Koksijde (26). While the fleet size quickly recovered from the destruction suffered during WWI, a revolution took place in fishing power of the fleet as they moved from sail or steam as driving power, to motor engines during the inter-war period (1919-1939). Motors were first installed as donkeys (to lift the nets) and as auxiliary power (propelling power) on sailing vessels and progressively as central driving power (Commissie voor Zeevisscherij 1912, 1913, 1919-1931). These shifts also required considerable investments and after WWII, fishing moved from a more family-oriented business to shipping companies. Fishing activities became concentrated around only 4 (Oostende, Zeebrugge, Nieuwpoort, Blankenberge) of the previously mentioned ports or fishing communities. The sector was severely hit by an economic crisis in 1948 and in only 10 years’ time, the fleet size decreased from approximately 550 to 450 vessels (-20%). The larger otter trawling vessels were forced to shift their fishing activities to the Icelandic waters to ensure profitability. By 1958, the landings from the Icelandic Sea represented 40% of all fish disembarked by Belgian fishermen (Lescrauwaet et al. 2010a). Another segment of the fleet targeted the rich concentrations of flatfish (mainly sole) on the White Bank (eastern part of the central North Sea). When the catches of sole decreased on the White Bank after 1955 the Belgian fisheries returned to the western fishing grounds (South-West Ireland, Bristol Channel), which they had left 10 years before in favour of the North Sea. 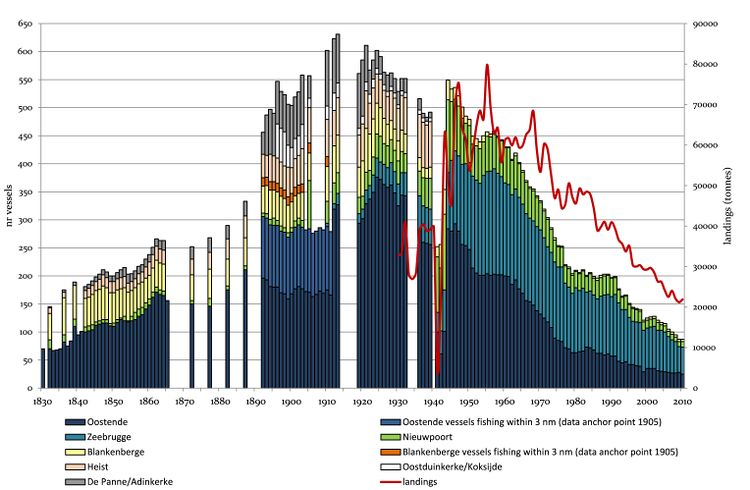 Figure: Trend in number of vessels of the Belgian fishing fleet in the period 1830-2010. Source: VLIZ HIFIDatabase, reconstructed from historical sources Annex B In the 1960s, major structural changes took place in the Belgian sea fisheries fleet. The large shipping companies which had invested in steam trawlers disappeared (e.g. the Ostend Shipping Company): the last Belgian steam trawler sailed out to England on the 14th of January 1964 exactly eighty years after the first steam trawler entered in the port of Oostende. Between 1961 and 1969, governmental subsidies were issued for the renewal of the fleet with bounties for the demolition of older ships and for the purchase of new steel hulled medium-sized motor trawlers (Poppe 1977). Although the beam-trawl was introduced in 1822 in Oostende, it went nearly unnoticed until the 1960s. In 1959, the paired beam-trawl fishery (‘bokkenvisserij’, a ship pulling one beam-trawl on each side of the vessel) was implemented from the port of Zeebrugge: first for the brown shrimp (Crangon crangon) fisheries that typically take place in inshore waters, and later also for the sole fisheries. Also from Zeebrugge, succesful ventures for pair-otter trawl (‘spanvisserij’, two ships pulling one otter trawl) fisheries for cod were implemented which increased the relative importance of Zeebrugge as fishing port. Whereas the port of Oostende had kept its reputation of first fishing port since at least the 18th century (Cloquet 1842, De Zuttere 1909) Zeebrugge definitely took over in 1968 as the most important port in terms of fleet size and in 1985 in terms of landings. Inshore FleetReporting on the fleet that targets species (e.g. brown shrimp, whelk) that are closely related to inshore waters or ecosystems (e.g. depth, sediment) is fragmented and discontinuous. For the ‘brown shrimp’ fisheries – typically inshore - reported data are too fragmented or incomplete to construct time-series. Shrimp fishing is also a seasonal activity (mainly summer) and shrimp fishers generally shift to target flatfish during other seasons. The best-fit approach to reconstruct long-term time-series for the size of the inshore fleet, is to select the subset of vessels with engine power <221 kW and/or vessels with < 70GT (after 1996) or 35GT (between 1971 and 1994).
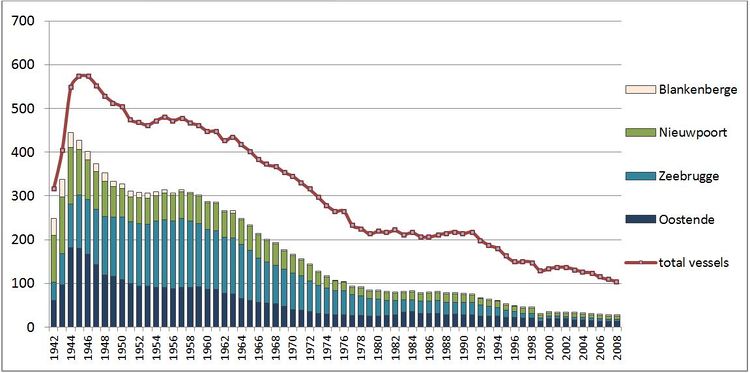 Figure: Trend in number of vessels of the Belgian ‘inshore fishing fleet’ for 1942-2010 (bar columns), based on the criteria of <70GT definition, compared to overall fleet size (red line). Source: VLIZ HIFIDatabase, reconstructed from historical sources see Annex B. The ‘inshore fleet’, based on the definition <70GT, represented approximately 63% of the entire fleet in 1960, decreasing to less than 25% of the entire fleet, in recent times. If defined by criteria of engine power, the ‘inshore fleet’ (<221kW) has fluctuated around 20% of the entire fleet, since the 1990s. Today, less than 20 vessels remain in this category of vessel type, and are mainly registered in the ports of Nieuwpoort and Oostende. However, since the Ministerial Resolution MR of 26/12/2005, these vessels need to actively register to the ‘coastal fleet segment’ to operate under the legally distinctive framework of ‘coastal fisheries’, cfr. MR of 26/12/2005, Art. 8 § 4 (see GIFS Governance Report). Today, the vessels in the ‘coastal fleet segment’ are 7; the N86 RUDY in Nieuwpoort, and the O101 FISTON, the O116 CAROLINE, the O152 ARAN, the O190 RENILDE, the O62 DINI and the O82 NAUTILUS in Oostende (communication 28/02/2014 of the Flanders Fisheries Service). This is a drastic decline compared to 2012, when 20 vessels were registered as part of the ‘coastal fleet segment’. LandingsTrends in landings per unit of effort in Belgian Inshore watersSince the Middle Ages, Flemish fisheries have targeted a variety of fishing grounds, many of which were distant fishing areas. Still, in spite of its limited extension, the Belgian part of the North Sea BNS has been historically the most important fishing area for Belgian fisheries, representing over 20% of the total Belgian landings (Lescrauwaet et al. 2010a). The waters of the BNS are considered as the most important fishing area in terms of source of food for local population, but also as the most stable provider of food. The BNS and in particular the ecosystem of shallow underwater sandbanks is also important as (post)spawning and nursery area (Leloup and Gilis 1961, Gilis 1961, Leloup and Gilis 1965, Rabaut et al. 2007). Recent studies also suggest that since the 2000s, approximately 50% of all Belgian removals from the BNS are unreported landings and discards (IUU) and total fish discarded by the Belgian fisheries on the BNS may range between 30-40% of all Belgian landings from the BNS. These numbers do not take into account the non-commercial benthic species (e.g. crab, algae) and the catches by the French and Dutch fleets that also have a long-standing tradition of fishing in the BNS (Depestele et al. 2011). Commercial catch per unit of effort (CPUE) - and its variant LPUE - is widely used as an index of abundance of fish, although the factors that may potentially bias this index are well documented and the index may be less suitable for pelagic species that display schooling behaviour (Hilborn and Walters 1992). The index needs to be used for specific métiers and particular fishing areas, in order to be interpreted as a relative index of abundance. This analysis is conducted for the demersal fisheries in the BNS, targeting mainly flatfish. Similar as for the overall Belgian sea fisheries, the time-series for LPUE of the demersal (flatfish) fisheries shows a period of higher LPUE just after WWII, with a decrease of 50% in the decade after WWII, suggesting a decrease in biomass of targeted species (Figure below, Lescrauwaet et al. in prep.). From the beginning of the 1960s until 1967, in the period coinciding with the transition from the otter trawl to the more efficient beam trawl and an increase in fishing effort, the LPUE remain around 0.35 kg/HP*Fishing Hour with a slight increase to 0.4 kg/HP*FH in 1967. During the 1970s the fishing effort increases, however the LPUE remains at lower levels (0.15-0.25 kg/HP*FH). As a reference, the analysis conducted for the Belgian fisheries in Iceland, indicated that LPUE values decreased from 0.95 kg/HP*FH in 1946 to 0.24kg/HP*FH in 1983. 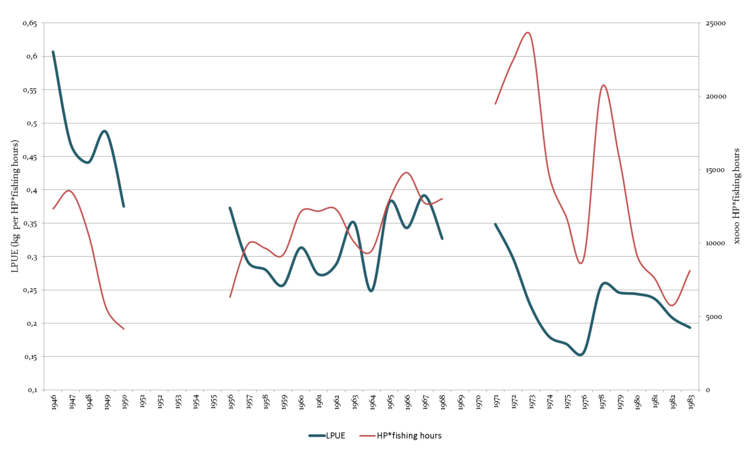 Figure: Landings per unit of effort (kg/kW*fishing hour), left-hand axis and total fishing effort (kW*fishing hours) by the demersal trawl fisheries on the Belgian part of the North Sea, 1946-1983. EmploymentLittle work is conducted on the socio-economic aspects of fisheries and changes in fishing communities. Effects of climate change (change in distribution patterns of target species) or in legal frameworks (quota restrictions) and technical measures (mesh size, change of gear, etc.) can have a profound impact in fishing communities, especially where strong traditions persist to use particular fishing gear and target specific - economically interesting – species. 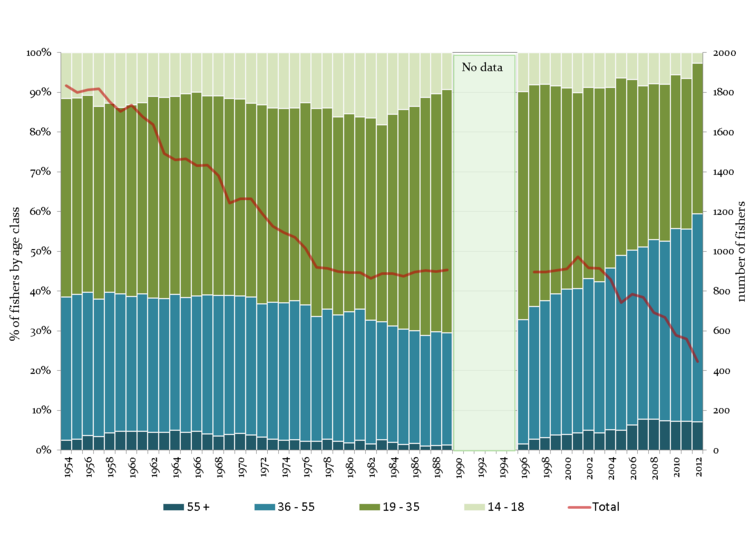 Figure: Direct employment in fisheries in Belgium: absolute number of fishers, and proportion by age class, 1954-2012. 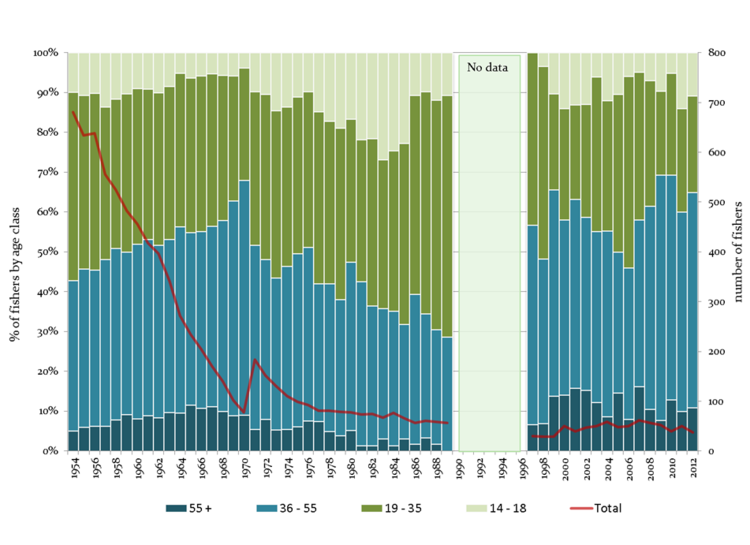 Figure: Direct employment in coastal fisheries in Belgium: absolute number of coastal fishers, and proportion by age class, 1954-2012. Note: The sudden increase of coastal fisheries in 1971 is largely due to the change in the definition of ‘coastal fisheries’. Whereas this contained the vessel classes I and II (up to 120HP) before 1971, it was modified to contain all vessels smaller than 35GT in 1971 and later expanded to vessels with engine power <221kW and 70GT that conduct fishing trips of 24 hours maximum (recently expanded to 48 hours) |