Application of radar hydrography in the German Wadden Sea
Introduction
Significant changes in bathymetry are the result of waves, tidal currents and storm events. In the area of the ‘Lister Tief’ (Fig. 1) the bathymetry is highly variable. Here, we introduce a system called ‘Radar Doppler Current Profiler’ (RDCP) that, combined with Acoustic Doppler Current Profiler (ADCP) measurements and bathymetric data, can be used to assess areas with high potential of erosion or accumulation with a presentation of the results in a high resolution map.
Radar Doppler Current Profiler
The method to scan the surface current field horizontally has been developed in the Radar Hydrography group. It uses two coherent radar devices to produce high resolution current vector maps. In analogy to ADCP, this method is named Radar Doppler Current Profiler (RDCP). It consists of two radar systems, where the one antenna is permanently looking 45° ahead and the other 45° backward.

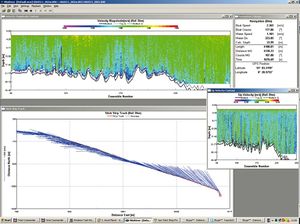
While no long waves are acting, the radial Doppler speeds are the sum of the wind friction and the surface current. By the Doppler relation we calculate the radial velocities from the backscattered signal for each range bin (length ~7.5m). Integrating the radar observations over one second, the radial speed results in an accuracy of 1.5 cm/s. The ship’s move- ments are compensated with a precise differential GPS. The local impact of the actual wind friction is compensated by additional measurements from the stopped ship with the antenna looking in all wind directions with 10° steps. An automatic quality control rejects routinely faulty data. The post processing procedure is to compose the full surface current vector by merging the two components into a geo-coded grid with the grid distance up to 10m. Fig. 2 shows an example of a geo-coded RDCP current map with a grid resolution of 100 m during ebb tide. An eddy with a diameter of about one nautical mile shows the outflow directed westward on the northern side of the gully and a counter current directed eastward on the south side. Comparison of the ADCP currents (Fig. 3), which were acquired during the same ship track, and the RDCP calculated vectors close by the ship demonstrates that this new scanning method fits. Fig. 4 a and b show the speed and direction of the surface current field within the tidal gully ‘Lister Tief’. This is overlaid by a current modulation due to the change in the cross section over submerged sand dunes, which interact with the ebb current in a way that we observe acceleration over the crest of the dunes and slowing down where the cross section is widening. The ADCP profile in Fig. 3 confirms these features in a vertical cross section map. The mentioned areas with acceleration and deceleration over the sand dunes are visible horizontally as well as in the vertical (upper and lower slide) speed components.
Bottom shear stress
A model to estimate the bottom shear stress (BSS) was developed to assess the impact of the current field on the sand regime. As input this model needs the surface current, the bathymetry and the grain size of the sediment. Under the condition of a homogeneous water column, rough sea floor and no swell the impact of the tidal currents on the sea bottom is obtained. The homogeneous water column was verified by repeated CTD measurements in the area. The base of the model is the Taylor Law which shows that we can calculate the current velocity at any depth of the water column if the velocity at another certain depth is known. By the knowledge of the surface current vector field the velocity within the water layer down to the bottom can be deduced. The RDCP provides the surface water speed in a broad stripe parallel to the ship course. The ADCP provides a vertical section to show the rotation of the current vector with increasing depth. The bathymetry data provides the local water depth and the terrain slope. The slope is important for the form drag component of the shear stress equation, which dominates the resulting stress. The rough sea floor condition is necessary for the calculation of the near bottom current. Over a smooth bed the change of the current velocity would be linear instead of logarithmic. Two options to display the bottom shear stress have been chosen: the absolute value of the resulting shear stress (Fig. 5) and the difference between this value and the critical bottom shear stress (Fig. 6). The second option is helpful in localising areas where bed motion is initialised with high probability. Up to now we can show the initiation but no suggestion can be made about the transposition of the material. By this procedure, areas with potential erosion or deposition can be detected (further reading: Senet et al., 2001[1], Ziemer et al., 2006[2], Braun et al., 2008[3]).
References
- ↑ Senet, C.M., Seemann, J. & Ziemer, F. (2001). The Near-Surface Current Velocity Determined from Image Sequences of the Sea Surface. IEEE Transactions on Geoscience and Remote Sensing, 39 (3), 492-505.
- ↑ Ziemer, F. & Cysewski, M. (2006). High Resolution Sea Surface Current Maps produced by Scanning with Ground Based Doppler Radar. 2006 IEEE International Geoscience & Remote Sensing Symposium & 27 Canadian Symposium on Remote Sensing, 31 July - 04 August 2006, Proceedings (pp. 1864-1866), Denver, Colorado USA. doi: 10.1109/IGARSS.2006.481.
- ↑ Braun N., Ziemer, F., Bezuglov, A., Cysewski, M. & Schymura, G. (2008). Sea-Surface Current Features Observed by Doppler Radar. IEEE Transactions on Geoscience and Remote Sensing, 46 (4). 1125-1133. doi: 10.1109/TGRS.2007.910221.
Please note that others may also have edited the contents of this article.
|
Please note that others may also have edited the contents of this article.
|
Please note that others may also have edited the contents of this article.
|


