File:Fig 3.JPG
From Coastal Wiki
Revision as of 11:08, 5 September 2012 by Laura A (talk | contribs) (Figure 3: Illustration of tide-surge interaction. Undisturbed tide (predicted tide, T) is solid black line, phase advanced tide (T’) is solid blue line, meteorological surge (S) is dashed black line, tide-surge interaction (S’) is dashed blue line, ne)
Fig_3.JPG (449 × 316 pixels, file size: 20 KB, MIME type: image/jpeg)
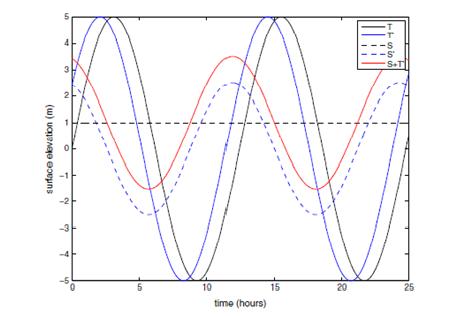
Figure 3: Illustration of tide-surge interaction. Undisturbed tide (predicted tide, T) is solid black line, phase advanced tide (T’) is solid blue line, meteorological surge (S) is dashed black line, tide-surge interaction (S’) is dashed blue line, net residual is solid red line ( Wolf, 2009)
File history
Click on a date/time to view the file as it appeared at that time.
| Date/Time | Thumbnail | Dimensions | User | Comment | |
|---|---|---|---|---|---|
| current | 11:08, 5 September 2012 |  | 449 × 316 (20 KB) | Laura A (talk | contribs) | Figure 3: Illustration of tide-surge interaction. Undisturbed tide (predicted tide, T) is solid black line, phase advanced tide (T’) is solid blue line, meteorological surge (S) is dashed black line, tide-surge interaction (S’) is dashed blue line, ne |
- You cannot overwrite this file.
File usage
The following page links to this file:
