Observing small scale morphodynamic processes during storm events

Introduction
A particular challenge for management of sandy coasts is erosion during storm events. Wind waves and swell transport a high amount of energy towards the coastline, which has to be dissipated within a short distance when arriving at the beach. This energy leads to a short but heavy increase in erosion, transport and re-deposition of sand. To protect the coast, measures such as “beach nourishment” have been established for the stabilization and conservation of the shoreline sediment. To observe the processes during a storm event and to monitor the success of any measures requires knowledge of the local interactions of waves and currents within the near shore area. Furthermore, longterm observations are necessary to study the change of the coast and the transfer of sediment.
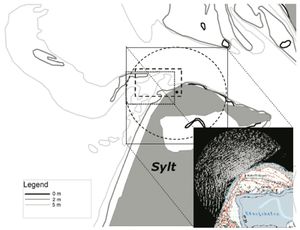
Here we present the use of an area covering observation method which is based on RADAR technology that allows a continuous survey of the morphodynamical forcing by currents and waves as well as the response of the bathymetry even during storm events. The area of investigation (covering about 5 km²) lies at the north end of the Island of Sylt in the German Bight (Fig. 1).
Methodology
The local water depths and the local current vectors (velocity and direction) are deduced from the Radar backscatter signal by an inverse modelling technique. During 10 minutes of radar observation the radar detects and tracks wave crests in space and time, from which the local change of the dispersive wave propagation is computed (for the physical background see next section). The dispersion describes the propagation speed of the different wave components. For this procedure a national and international patent was awarded in 2003. The method was developed at the Department of Radar Hydrography of the Institute for Coastal Research/GKSS and is licensed as a commercial product (DiSC) by Vision 2 Technology GmbH (www.v2t.de), partner of the Geesthachter Innovations- und Technologie- Zentrum (GITZ).The dispersion relation for sea surface gravity waves is derived from the Eulerian equations of motion, the continuity equation and from the dynamic kinematic boundary conditions at the sea surface and the sea floor. A detailed description is given in Senet et al. (2008)[1]. As the wave height does not influence the dispersion, the positions of the wave crests as they are tracked by the radar can be used for the inversion of the local water depths directly from the radar. The three dimensional Fourier decomposition of the radar images gives the actual effective dispersion of the waves, which is controlled by the local water depth and current. Deviations from the undisturbed dispersion are used to determine the spatial distribution of these two hydrographic parameters, which then are composed into a grid, and used to construct a map of water depth (bathymetry) and current.
Bathymetry
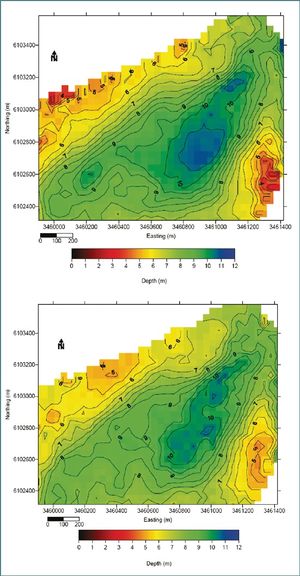
The examples in Fig. 2 and 3 show the water depth map as derived from Radar observations and the current fields observed during flood and ebb phases. Furthermore, the depth measurements have been averaged over a full tidal cycle before and after a storm (wind speed 8-9 Bft.) to estimate the change in sediment mass of the observed area. First, by using gauge measurements, the two maps have been set to a common reference. The difference of the sediment volume between the beginning and the end of the storm is estimated to be + 50.000 m³. It is considered to be the sediment net increase of the area under investigation. Following Flampouris et al. (2008), the accuracy for each grid cell lies within ±10%. However, the uncertainty of the assumption that the mean sea level remains constant during the two observations decreases the accuracy of the calculation.
Current
While the main impact of waves on the shore is erosion, currents mainly determine sediment transport and deposition. Fig. 3 illustrates an example of a current field observation acquired on February 25th 2002. Although the radar coverage is the same as for the cases shown in Fig. 2 the current field was computed for an area which was slightly shifted north - eastward (Fig. 1). The wind speed during acquisition was about 5 Bft. In addition to the current field a time series of current vectors is given in the upper part of Fig. 3. The position where the time series has been captured is marked with a magenta dot in the vector field. From the two dimensional vector field and the time series special features of the flood phase become evident. At the beginning of the flood phase the northward directed current is blocked by the pressure of the current, which flows along the main gully in the North, where the water depth increases to 20 m and more. Due to the rise of the water level during flood this effect diminishes and the water transport rotates toward the north, following more and more the morphology of the side gully.
References
- ↑ Senet, C.M. Seemann, J. Flampouris, S. Ziemer, F. (2008). Determination of Bathymetric and Current Maps by the Method DiSC Based on the Analysis of Nautical X-Band Radar Image Sequences of the Sea Surface. IEEE Transactions oGeoscience and Remote Sensing, 46 (8), 2267-2279. doi: 10.1109/TGRS.2008.916474
