File list
This special page shows all uploaded files.
| Date | Name | Thumbnail | Size | User | Description | Versions |
|---|---|---|---|---|---|---|
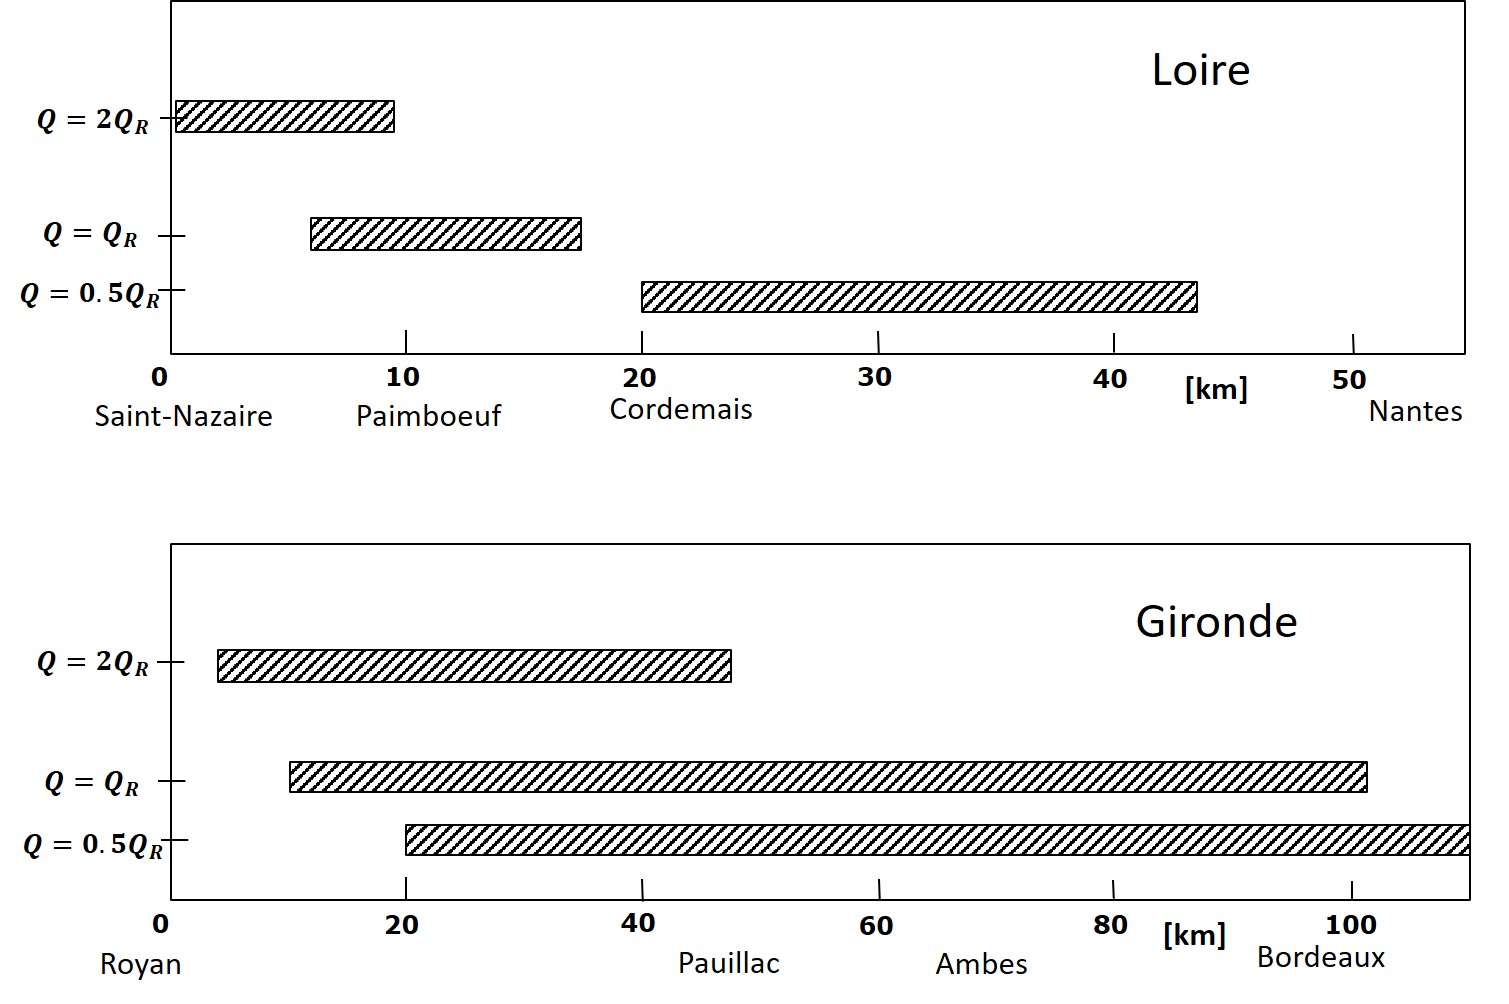
| 22:52, 9 February 2020 | DischargeLoireGirondeTurbidityMax.jpg (file) |  |
197 KB | Dronkers J | Position of the turbidity maximum in the Loire and Gironde estuaries for different fluvial discharges. | 1 |
| 22:52, 9 February 2020 | LandVanSaeftinghe.jpg (file) |  |
157 KB | Dronkers J | View of the Land van Saeftinghe. Photo credit Anita Eijlers | 1 |
| 22:50, 9 February 2020 | FluidMudLoireEstuary.jpg (file) |  |
233 KB | Dronkers J | Fluid mud in the Loire estuary during neap tide and low fluvial discharge. | 1 |
| 22:50, 9 February 2020 | TurbidityMaximumLoireEstuary.jpg (file) |  |
206 KB | Dronkers J | Turbidity maximum in the Loire estuary at low fluvial discharge. | 1 |
| 16:56, 5 February 2020 | WaterAssessmentAmsterdam.jpg (file) |  |
153 KB | Dronkers J | Assessment of policy objectives related to urban water management for the city of Amsterdam. | 1 |
| 16:34, 5 February 2020 | RoomForWaterCoastalCities.jpg (file) |  |
445 KB | Dronkers J | Examples of room for water in Dutch cities. | 1 |
| 16:31, 5 February 2020 | KatwijkCoastalProtection.jpg (file) |  |
24 KB | Dronkers J | The coastal village Katwijk (Netherlands) has been protected by an artificial dune built in front of the seashore boulevard with sand extracted far offshore. | 1 |
| 18:25, 1 February 2020 | ExpansionCoastalCities.jpg (file) | 100 KB | Dronkers J | Schematic representation of the characteristic geographical setting of coastal towns that were built in delta plains, close to estuaries or lagoons. | 1 | |
| 17:34, 1 February 2020 | SlumsMonrovia.jpg (file) |  |
268 KB | Dronkers J | Slums on a sandspit at the coast of Monrovia (Liberia). | 1 |
| 17:33, 1 February 2020 | SubsidenceCoastalCities.jpg (file) |  |
106 KB | Dronkers J | Subsidence in a few coastal megacities. | 1 |
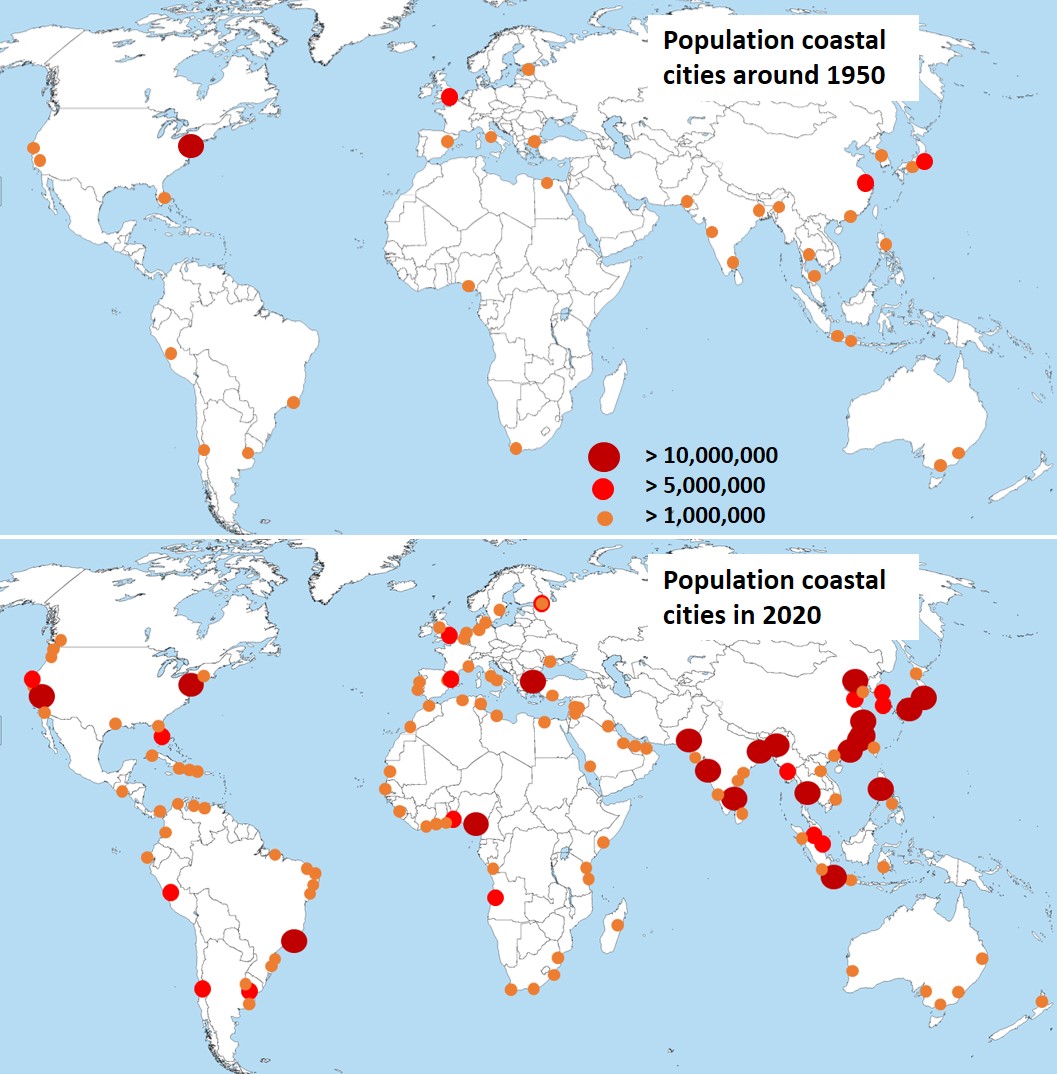
| 17:28, 1 February 2020 | PopulationCoastalCities.jpg (file) |  |
209 KB | Dronkers J | Population of coastal cities around 1950 and in 2020. | 1 |
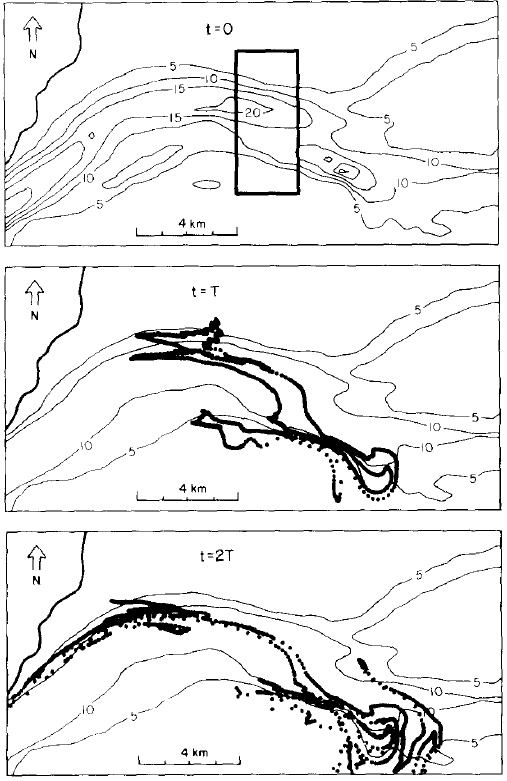
| 21:29, 19 January 2020 | ChaoticDispersion.jpg (file) |  |
137 KB | Dronkers J | Stretching of an initially rectangular patch of dye, according to a 2D numerical hydrodynamic model of the central part of the Western Wadden Sea. | 1 |
| 15:06, 19 January 2020 | DeadZoneDispersion.JPG (file) | 123 KB | Dronkers J | Dispersion by an intertidal "dead zone" along a tidal channel. | 2 | |
| 19:27, 13 January 2020 | TsunamiScheme.jpg (file) |  |
74 KB | Dronkers J | Schematization of the shoreface and beach used in the tsunami runup model of Madsen and Schäfer (2010). | 1 |
| 19:25, 13 January 2020 | TsunamiMonitoringNetwork.jpg (file) |  |
243 KB | Dronkers J | The global tsunami monitoring network. | 1 |
| 19:24, 13 January 2020 | TsunamiWarningDARTsystem.png (file) |  |
807 KB | Dronkers J | The DART monitoring system. Image NOAA. | 1 |
| 19:23, 13 January 2020 | Tsunami Japan 2011 S.Yoshida.jpg (file) |  |
220 KB | Dronkers J | Destruction at the Honshu coast, Japan, by the tsunami of March 11, 2011. Image Y. Yoshida, Flickr creative commons. | 1 |
| 19:23, 13 January 2020 | Tsunami Japan 2011 Flickr J.Teramoto.jpg (file) |  |
207 KB | Dronkers J | Destruction at the Honshu coast, Japan, by the tsunami of March 11, 2011. Image J. Teramoto, Flickr creative commons. | 1 |
| 19:22, 13 January 2020 | Tsunami Phuket 2004 S.Kennedy.jpg (file) |  |
183 KB | Dronkers J | Impact of the Indian Ocean tsunami of December 26, 2004 at Phuket, Thailand. Image S. Kennedy, Flickr creative commons. | 1 |
| 19:20, 13 January 2020 | Tsunami Phuket 2004.png (file) |  |
114 KB | Dronkers J | The Indian Ocean tsunami of December 26, 2004, invading the coast at Phuket Thailand as a breaking bore. | 1 |
| 19:18, 13 January 2020 | RingofFireUSGS.jpg (file) |  |
135 KB | Dronkers J | Ring of fire around the Pacific. | 1 |
| 15:22, 29 December 2019 | SouthForkDamFailure1889.jpg (file) |  |
182 KB | Dronkers J | Breach of the earth-filled South Fork Dam on Lake Conemaugh (Pennsylvania, US) in 1889. | 1 |
| 15:18, 29 December 2019 | DamBreakWaveProfiles.jpg (file) |  |
78 KB | Dronkers J | Wave profile after dam break. Red line: frictionless solution. Blue band: experimental lab data. | 1 |
| 15:17, 29 December 2019 | DamBreakFlowPrinciple.jpg (file) |  |
74 KB | Dronkers J | Left panel: Schematic representation of water retention behind a dam. Right panel: Positive downstream and negative upstream surges following instantaneous dam removal. | 1 |
| 17:58, 14 December 2019 | WaveHeightDirectionalSpreading.jpg (file) |  |
114 KB | Dronkers J | Wave height directional distribution, a so-called wave rose. | 1 |
| 17:57, 14 December 2019 | ScatterDiagramWavePeriodWaveHeight.jpg (file) |  |
151 KB | Dronkers J | Scatter diagram of <math>T_p</math> vs. <math>H_{m0}</math>. | 1 |
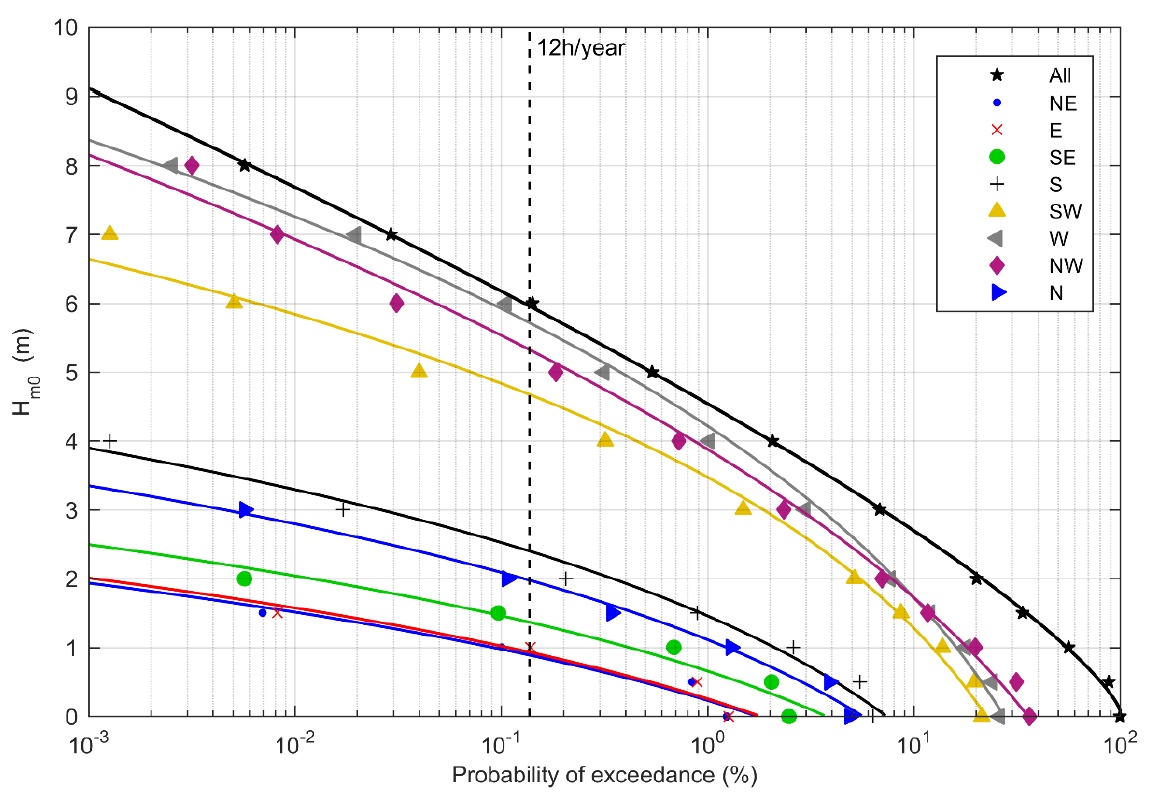
| 17:56, 14 December 2019 | WaveHeightExceedanceDistribution.jpg (file) |  |
261 KB | Dronkers J | Wave height exceedance distribution for various wave directions. | 1 |
| 15:04, 23 November 2019 | NarrabeenCollaroyBeachShorelineRecovery.jpg (file) |  |
89 KB | Dronkers J | Variation of the shoreline position in a transect of Narrabeen-Collaroy Beach (East Australia, near Sidney) over the period October 2004-May 2005. | 1 |
| 15:03, 23 November 2019 | DuneFootRecovery1953.jpg (file) |  |
81 KB | Dronkers J | Variation of the dune foot position in a beach transect of the island Walcheren (Netherlands) over the period 1900-2010. | 1 |
| 11:10, 5 November 2019 | Random genetic drift chart.png (file) |  |
68 KB | Dronkers J | Ten simulations of random genetic drift. Source: [http://en.wikipedia.org/wiki/Genetic_drift Wikipedia] | 1 |
| 22:01, 4 November 2019 | WorldMapColdWaterCoralReef.jpg (file) |  |
164 KB | Dronkers J | World map of cold water coral reefs (UNEP, 2003) | 1 |
| 15:57, 3 November 2019 | MigratingDuneStructure.jpg (file) |  |
201 KB | Dronkers J | Cross-stratification of a migrating dune in unidirectional flow and in alternating flow. | 1 |
| 20:40, 22 October 2019 | BeachSlopeGrainSizeData.jpg (file) |  |
65 KB | Dronkers J | Correlation between beach slope and sediment grainsize from 78 field studies, adapted from Bujan et al. (2019). | 2 |
| 21:01, 16 October 2019 | EstuaryIsohalines.jpg (file) | 71 KB | Dronkers J | Seawater intrusion in a longitudinal section of a prismatic estuary, represented by isohalines. | 2 | |
| 21:00, 16 October 2019 | SaltWedge.jpg (file) |  |
58 KB | Dronkers J | Salt wedge in a prismatic estuary. | 2 |
| 21:24, 13 October 2019 | CrestRotation.jpg (file) |  |
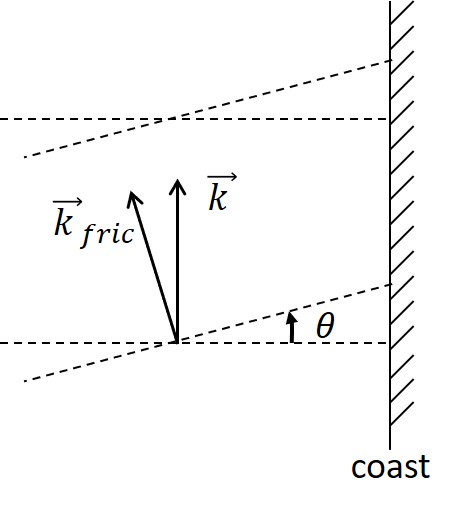
26 KB | Dronkers J | Rotation of the propagation direction of a Kelvin wave away from the coast due to bottom friction. | 2 |
| 21:05, 13 October 2019 | CrestRotationNEW.jpg (file) |  |
23 KB | Dronkers J | Rotation of the propagation direction of a Kelvin wave away from the coast due to friction. | 1 |
| 18:19, 9 October 2019 | EquilibriumTidalLagoonsNEW.jpg (file) |  |
202 KB | Dronkers J | The relative tidal amplitude versus the relative intertidal area for a large number of tidal basins with small (or without) river inflow. | 1 |
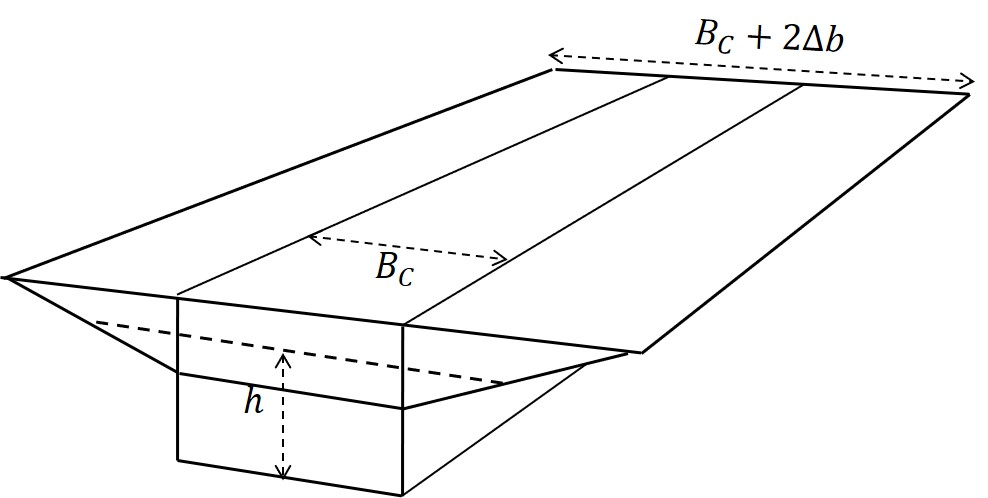
| 18:16, 9 October 2019 | PrismaticTidalFlatChannelNEW.jpg (file) |  |
48 KB | Dronkers J | Prismatic estuarine channel with tidal flats. | 1 |
| 10:51, 9 October 2019 | SeaLevelRiseDutchCoast.jpg (file) |  |
94 KB | Dronkers J | Sea level data for the Dutch coast, corrected for subsidence. | 1 |
| 16:44, 3 October 2019 | ChannelFrance.png (file) |  |
132 KB | Dronkers J | Increasing positive asymmetry of the tidal wave propagating along the coast of Normandy (France). | 1 |
| 20:25, 30 September 2019 | SaintLouisCoastalErosion.jpg (file) |  |
501 KB | Dronkers J | Destruction of fishermen's houses on the beach of Saint-Louis (Senegal) by swell waves at high springtide (March 2015). | 1 |
| 20:17, 30 September 2019 | KeralaSetback.jpg (file) |  |
254 KB | Dronkers J | Urbanization of setback area in Kerala (India). | 1 |
| 20:47, 29 September 2019 | HondsbosseDuinen.jpg (file) |  |
206 KB | Dronkers J | A sea dike along the North-Holland coast is protected by an artificial dune. | 1 |
| 20:32, 29 September 2019 | WaddenSeaMarshCreation.jpg (file) |  |
388 KB | Dronkers J | Dikes along the Wadden Sea are protected by marshland created by stimulating natural sedimentation through fences of braided willow twigs. | 1 |
| 15:22, 28 September 2019 | FloodRiskMitigation.jpg (file) |  |
258 KB | Dronkers J | Benefits and limitations of different coastal protection measures. | 1 |
| 13:55, 28 September 2019 | Setbacklines.jpg (file) |  |
139 KB | Dronkers J | Setback lines for different countries. | 1 |
| 14:56, 27 September 2019 | NAO+NorthSeaTemperature.jpg (file) |  |
160 KB | Dronkers J | Winter (December through March) index of the NAO based on the difference of normalized sea level pressure (SLP) between Lisbon, Portugal and Stykkisholmur/Reykjavik, Iceland since 1864. Green inserted graph: North Sea winter temperature. | 1 |
| 14:54, 27 September 2019 | NAOatmosphere.jpg (file) |  |
126 KB | Dronkers J | The atmospheric pressure anomaly typical for positive and negative NAO phases. | 1 |
| 20:48, 11 September 2019 | ConvergingTidalChannel.jpg (file) |  |
28 KB | Dronkers J | Schematization of a converging tidal channel | 1 |