File list
This special page shows all uploaded files.
| Date | Name | Thumbnail | Size | User | Description | Versions |
|---|---|---|---|---|---|---|
| 15:10, 22 March 2007 | Poulospic7.jpg (file) |  |
70 KB | Kpavlop | Figure 7. Graphs representing the significant wave height (Hs) and suspended sediment concentration (SSC) over the study period. | 1 |
| 15:10, 22 March 2007 | Poulospic6.jpg (file) |  |
36 KB | Kpavlop | Figure 6. Current directions and speeds for each station G1 (inshore), G2, and G3 (offshore) during the study period. Values on the ‘x’ axis refer to time in hours from the starting time of 15:52 on the 24th July 2003 | 1 |
| 14:38, 22 March 2007 | Biodiversity elements.jpg (file) |  |
219 KB | Sederous | 1 | |
| 13:26, 22 March 2007 | Poulospic5.jpg (file) |  |
265 KB | Kpavlop | Figure 5. Geomorphological and sedimentological characteristics of the study area (Poulos et al, 1998). Sampling stations for the present study are indicated (G1, G2, G3). Note: (n=1,2,..), bathymetry in metres. | 1 |
| 13:13, 22 March 2007 | Poulospic4.jpg (file) |  |
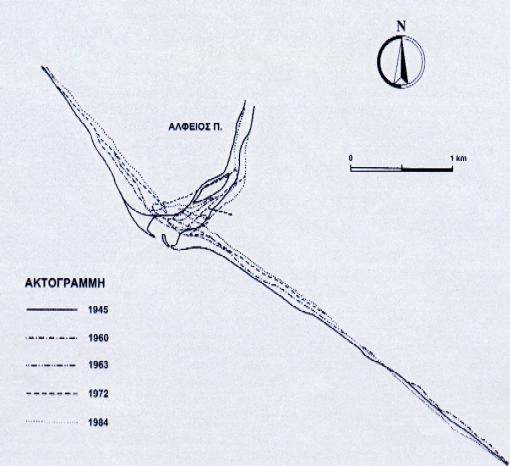
27 KB | Kpavlop | Figure 4. Shoreline retreat of the Mouth area of R. Alfios following the construction of dams (Ghionis et al., 2005) | 1 |
| 13:11, 22 March 2007 | Poulospic3.jpg (file) |  |
9 KB | Kpavlop | Figure 3. The mouth area of R. Alfios (NW Peloponnese, Ionian Sea) Topgraphic map published by the Hellenic Army Geographical Service, in 1972. | 1 |
| 13:03, 22 March 2007 | Poulospic2.jpg (file) |  |
667 KB | Kpavlop | Figure 2. Morphological changes in relation to spatial and time scale (Kraus et al., 1991) | 1 |
| 12:49, 22 March 2007 | Poulospic1um8.jpg (file) |  |
344 KB | Kpavlop | Figure 1. Spatial and temporal scales involved in coastal morphological changes (after Cowell and Thom, 1997) | 1 |
| 11:11, 22 March 2007 | 8b illustration morph evol front of harbour.jpg (file) |  |
10 KB | Caitlin | 2 | |
| 10:57, 22 March 2007 | 5 results from morph model calibration.jpg (file) |  |
32 KB | Caitlin | 1 | |
| 10:56, 22 March 2007 | 4 illustration full ts and compressed ts.jpg (file) |  |
22 KB | Caitlin | 1 | |
| 10:56, 22 March 2007 | State of the art.jpg (file) |  |
88 KB | Sederous | 1 | |
| 10:54, 22 March 2007 | 6c. time series offshore waves.jpg (file) |  |
23 KB | Caitlin | 1 | |
| 10:54, 22 March 2007 | 6a. time series offshore waves.jpg (file) |  |
30 KB | Caitlin | 1 | |
| 10:50, 22 March 2007 | Mablethorpe gaussian residuals.png (file) |  |
2 KB | Vanesa Magar | 1 | |
| 10:49, 22 March 2007 | 3 bathymetry behind breakwater.jpg (file) |  |
33 KB | Caitlin | 2 | |
| 10:24, 22 March 2007 | 2 project site.jpg (file) |  |
20 KB | Caitlin | 1 | |
| 10:24, 22 March 2007 | 1 combination of waves currents and sed trans.jpg (file) | 76 KB | Caitlin | 1 | ||
| 10:21, 22 March 2007 | 8a illustration morph evol front of harbour.jpg (file) |  |
111 KB | Caitlin | 1 | |
| 10:20, 22 March 2007 | 6b. time series offshore waves.jpg (file) |  |
210 KB | Caitlin | 2 | |
| 10:04, 22 March 2007 | 1 combination of waves currents and sed trans.png (file) | 91 KB | Caitlin | 1 | ||
| 09:59, 22 March 2007 | 8b illustration morph evol front of harbour.png (file) |  |
8 KB | Caitlin | 1 | |
| 09:59, 22 March 2007 | 8a illustration morph evol front of harbour.png (file) |  |
17 KB | Caitlin | 1 | |
| 09:59, 22 March 2007 | 7 morph changes.jpg (file) |  |
25 KB | Caitlin | 1 | |
| 09:59, 22 March 2007 | 6c. time series offshore waves.png (file) |  |
9 KB | Caitlin | 1 | |
| 09:58, 22 March 2007 | 6b. time series offshore waves.png (file) |  |
33 KB | Caitlin | 1 | |
| 09:58, 22 March 2007 | 6a. time series offshore waves.png (file) |  |
19 KB | Caitlin | 1 | |
| 09:58, 22 March 2007 | 5 results from morph model calibration.gif (file) |  |
22 KB | Caitlin | 1 | |
| 09:57, 22 March 2007 | 4 illustration full ts and compressed ts.gif (file) |  |
10 KB | Caitlin | 1 | |
| 09:57, 22 March 2007 | 3 bathymetry behind breakwater.gif (file) |  |
21 KB | Caitlin | 1 | |
| 09:57, 22 March 2007 | 2 project site.gif (file) |  |
15 KB | Caitlin | 1 | |
| 09:56, 22 March 2007 | 1 combination of waves currents and sed trans.gif (file) | 18 KB | Caitlin | 1 | ||
| 23:50, 21 March 2007 | ModelsFigure10.png (file) |  |
502 KB | Vanesa Magar | time-averaged image (over ten minutes) of Egmond aan Zee | 1 |
| 23:49, 21 March 2007 | ModelsFigure9.png (file) |  |
34 KB | Vanesa Magar | : Schematic of a Neural Network (based on Kingston, 2003 <ref>Kingston, K.S., 2003, ‘Applications of Complex Adaptive Systems Approaches to Coastal Systems’, PhD Thesis, University of Plymouth.</ref>) | 1 |
| 23:47, 21 March 2007 | ModelsFigure8.png (file) |  |
29 KB | Vanesa Magar | Two wavelet examples: the Mexican hat on the left and the Morlet wavelet on the right (from http://en.wikipedia.org/wiki/Wavelet, accessed 08/03/07). | 1 |
| 23:46, 21 March 2007 | ModelsFigure6.png (file) |  |
77 KB | Vanesa Magar | Time series of beach elevation at a set point in front of a seawall | 1 |
| 23:45, 21 March 2007 | ModelsFigure5.png (file) |  |
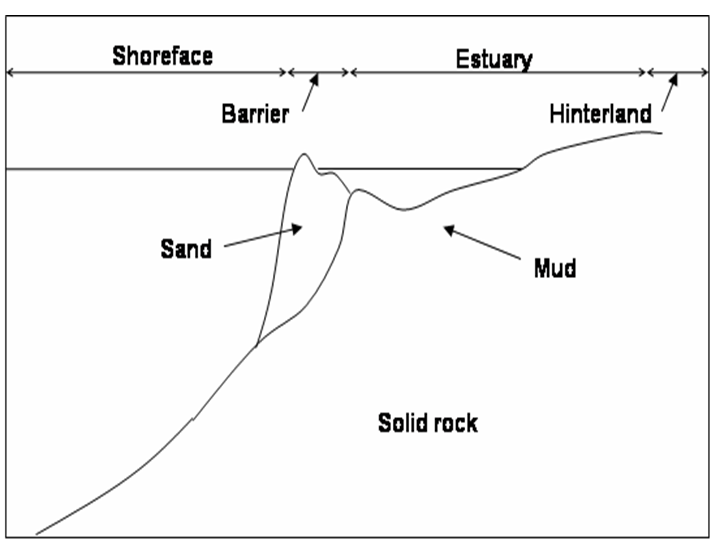
41 KB | Vanesa Magar | Schematic of some of morphological units that could be included in a shoreface model, such as those by Cowell et al (1995) <ref>Cowell, P. J, Roy, P. S. and Jones, R. A., 1995, ‘Simulation of large-scale coastal change using a morphological behaviour mo | 1 |
| 23:44, 21 March 2007 | ModelsFigure4.png (file) |  |
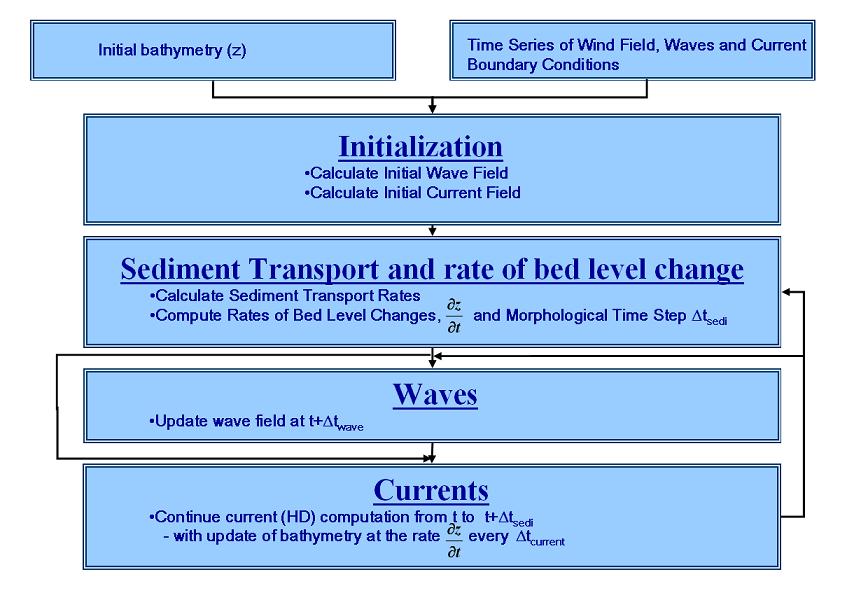
57 KB | Vanesa Magar | Schematic showing the steps involved in behaviour-based modelling for long-term studies of bathymetric evolution. | 1 |
| 23:43, 21 March 2007 | ModelsFigure3.png (file) |  |
110 KB | Vanesa Magar | 1 | |
| 23:00, 21 March 2007 | Figure2.png (file) |  |
56 KB | Vanesa Magar | 1 | |
| 22:45, 21 March 2007 | Figure1.png (file) |  |
39 KB | Vanesa Magar | Beach responses to natural forcing, indicating associated length-scales and time-scales | 1 |
| 16:58, 21 March 2007 | List of participants 2.jpg (file) |  |
177 KB | Sederous | 1 | |
| 16:58, 21 March 2007 | List of participants 1.jpg (file) |  |
345 KB | Sederous | 1 | |
| 16:56, 21 March 2007 | List of participants Page 2.jpg (file) |  |
177 KB | Sederous | 3 | |
| 16:56, 21 March 2007 | List of participants Page 1.jpg (file) |  |
345 KB | Sederous | 4 | |
| 16:34, 21 March 2007 | List of participants Page 3.png (file) |  |
64 KB | Sederous | 1 | |
| 16:34, 21 March 2007 | List of participants Page 2.png (file) |  |
72 KB | Sederous | 1 | |
| 16:33, 21 March 2007 | List of participants Page 1.png (file) |  |
68 KB | Sederous | 1 | |
| 12:25, 21 March 2007 | Derous Table 2.jpg (file) |  |
187 KB | Sederous | 1 | |
| 11:44, 21 March 2007 | Derousetal Figure.jpg (file) |  |
140 KB | Sederous | 1 |