Oil sensitivity mapping
Contents
Introduction
The Wadden Sea, a region of tidal flats and salt marshes, is of enormous value as a cleansing site for North Sea water, as a nursery for young fish, as a feeding ground for many bird species and as a recreation area for thousands of tourists. It covers an area of nearly 10,000 km2 along the North Sea coast of the Netherlands, Germany and Denmark. One major concern is that this nature reserve (a national park in Germany) could be damaged for many years by oil pollution in case of a ship accident. Although it is impossible to protect the whole coast in such a case, a contingency plan for oil spill response can help to minimise the effects for the most sensitive areas. For this purpose oil sensitivity maps have been developed, which consist of an automated expert model and digital maps (GIS) for different seasons. The study comprises a large scale habitat-survey covering the entire intertidal of the German Wadden Sea, including a classification of their sensitivity with regard to distinct disturbances, especially oil pollution. The project was financed by the Havariekommando (Central Command for Maritime Emergencies, Germany), which needs the results as a basis for strategic concepts.
Methods and Techniques
Four classes have been defined to scale the oil sensitivity from low (1) to high (4). The sensitivity of a particular area depends largely upon the physical characteristics of the habitat, the susceptibilities of individual benthic species and their roles within the community. A central and intensive part of the study was the fieldwork for the habitat mapping, which was carried out during three years (2003 - 2006). For this part, the experience of the previous project “Sensitivity Mapping of Intertidal Flats” of GKSS (1987 until 1992) served as a very important basis. The data is devided into geographic and thematic data.
Geographic data
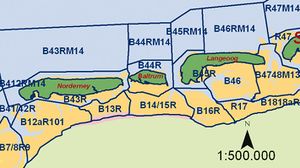
To get a digital map of the oil sensitivity, the thematic data must be linked to a reference map. To navigate the data of the habitat survey a recent map of the tidal flat topography and the borders of the analysis areas (areas with consistent habitat characteristics) are needed. This reference map is the base layer for the so called benthos sensitivity (Fig. 1). A second reference map is needed for the bird data. The map comprises the borders of bird censuses. Fig. 2 shows such “bird areas” in the East Frisian region. These areas are much larger compared to the benthos analysis areas. This map provides a base layer for the bird sensitivity.
Thematic data - Habitat mapping
During the years 2003 and 2006 a set of 70 different parameters were collected at nearly 1000 predefined locations (1 km grid). The parameter set consists of a combination of qualitative and quantitative values. The qualitative values were recorded on a standardised protocol (“record sheet”). They comprise for example information about the presence of different micro- and macroalgae, surface structure (i.e. ripple) and sediment properties. The quantitative values were restricted to sediment cores, like: grain size, water content of sediments and macrofauna species.
Thematic data - Bird census
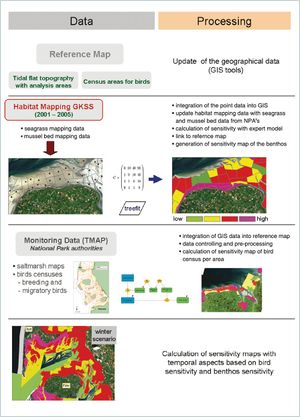
The seasonal aspects of the sensitivity were calculated using monitoring data of breeding and migratory birds, which are compiled yearly by the national park authorities of Schleswig-Holstein, Hamburg and Lower Saxony. These tabular data have been entered into a database and pre-processed. The result is the sensitivity index for each bird counting area. An overview about all data and processing steps is given in Fig. 2.
Analysis
The complex and heterogeneous data from GKSS and National Park authorities were organised in form of a GIS and a database. All data were integrated into the reference maps for benthos areas and bird areas. For updating and formatting the geographic data the GIS editing tools were used also for the update and analysis of the thematic maps. This includes the information about the seagrass and mussel bed distribution and also the link between the bird statistics and the bird areas. An intermediate step for the calculation of the final sensitivity map is the separate computation of the benthos and bird sensitivity maps.
Benthos – sensitivity (Index)
The sensitivity of each station was calculated on the basis of the collected and pre-processed data using an automated expert system developed by GKSS. This system is based on the artificial neural network technique and on advanced classification methods. The expert model makes it possible that other authorities, like the Havariekommando, can calculate the sensitivity of the benthos in most cases without an expert.
Bird – sensitivity (Index)
The bird censuses per area are split into two groups: breeding and migratory birds. The maximum number of a single bird species was calculated for a period of 5 years. In the case of breeding birds the number of breeding pairs was counted. In a next step the resulting maximum number was weighted with a predefined value for each species. This weighting was defined by an expert with respect to the behaviour, ecological importance and rareness of the species (Red list of endangerd species). The resulting values were transformed to the four sensitivity classes. With GIS tools the highest possible sensitivity for a bird counting area was analysed and the sensitivity value was linked to the bird reference map.
Oil sensitivity of the Wadden Sea
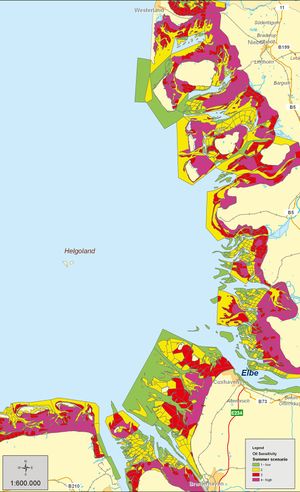
The final value of the oil sensitivity was calculated by combining the sensitivities of benthos and bird areas based on their spatial and seasonal extension. For the benthos only one index value is determined while for the birds, the index value depends on the breeding and/or migration period. Tab. 1 shows the definition of the bird seasons. The final sensitivity map is shown in Fig. 5. The digital map in Fig. 4 is the input for the GIS system developed for the Havariekommando. More information on the sensitivity raster of the German North Sea is availablet in Van Bernem et al., 2007[1].
Related articles
References
- ↑ Van Bernem, K.-H., Doerffer, R., Grohnert, A., Heymann, K., Kleeberg, U., Krasemann, H., Reichert, J., Reichert, M. & Schiller, H. (2007). Sensitivitätsraster Deutsche Nordseeküste II - Aktualisierung und Erstellung eines operationellen Modells zur Vorsorgeplanung bei der Ölbekämpfung - Projektbericht im Auftrag des Havariekommandos. Geesthacht: GKSS Forschungs- zentrum Geesthacht GmbH.
Please note that others may also have edited the contents of this article.
|
Please note that others may also have edited the contents of this article.
|
Please note that others may also have edited the contents of this article.
|


