File list
This special page shows all uploaded files.
| Date | Name | Thumbnail | Size | User | Description | Versions |
|---|---|---|---|---|---|---|
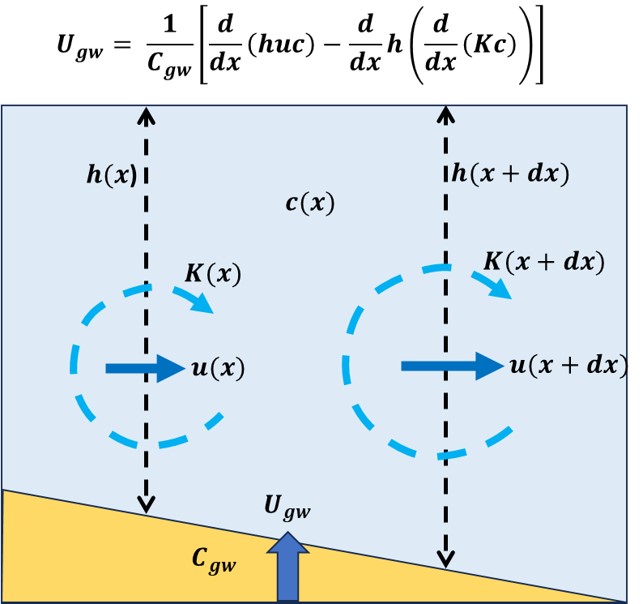
| 15:06, 20 December 2025 | GroundwaterTracer.jpg (file) |  |
59 KB | Dronkers J | Determination of the total submarine groundwater discharge (fresh+salt) by measuring tracer concentrations <math>c(x)</math> and using the tracer balance equation. | 1 |
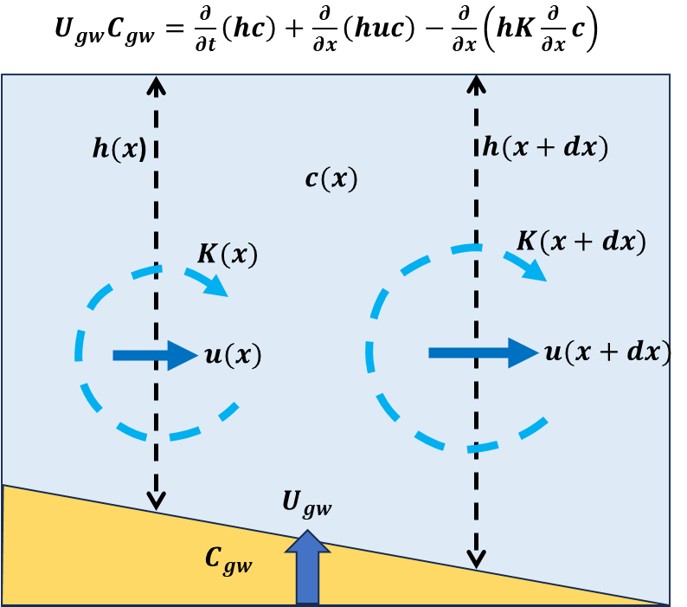
| 12:34, 14 December 2025 | GroundwaterTracerBalance.jpg (file) |  |
53 KB | Dronkers J | Determination of the SGD (fresh+salt) by measuring tracer concentrations <math>c(x)</math> and using the balance equation explained in the figure. | 1 |
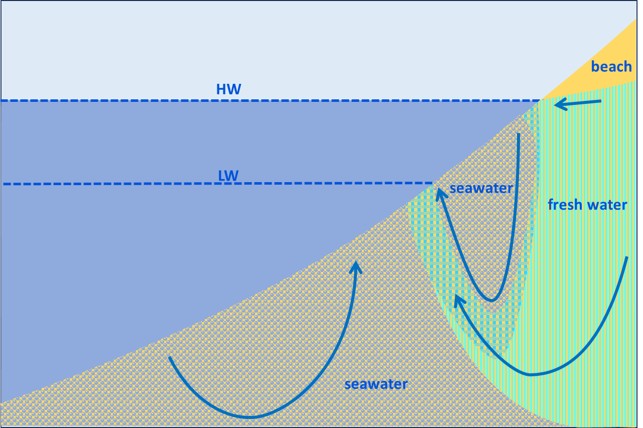
| 17:49, 9 December 2025 | BeachFreshSaltGroundwater.jpg (file) |  |
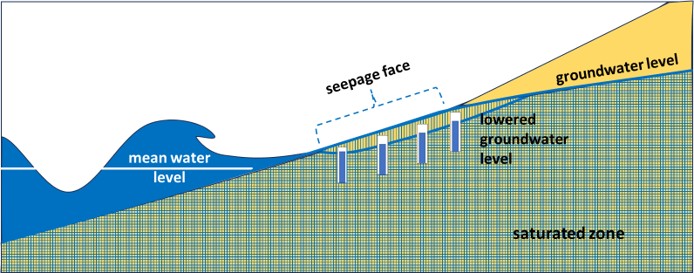
68 KB | Dronkers J | Schematic of beach groundwater circulation induced by the density difference between fresh groundwater runoff and infiltrating seawater. | 1 |
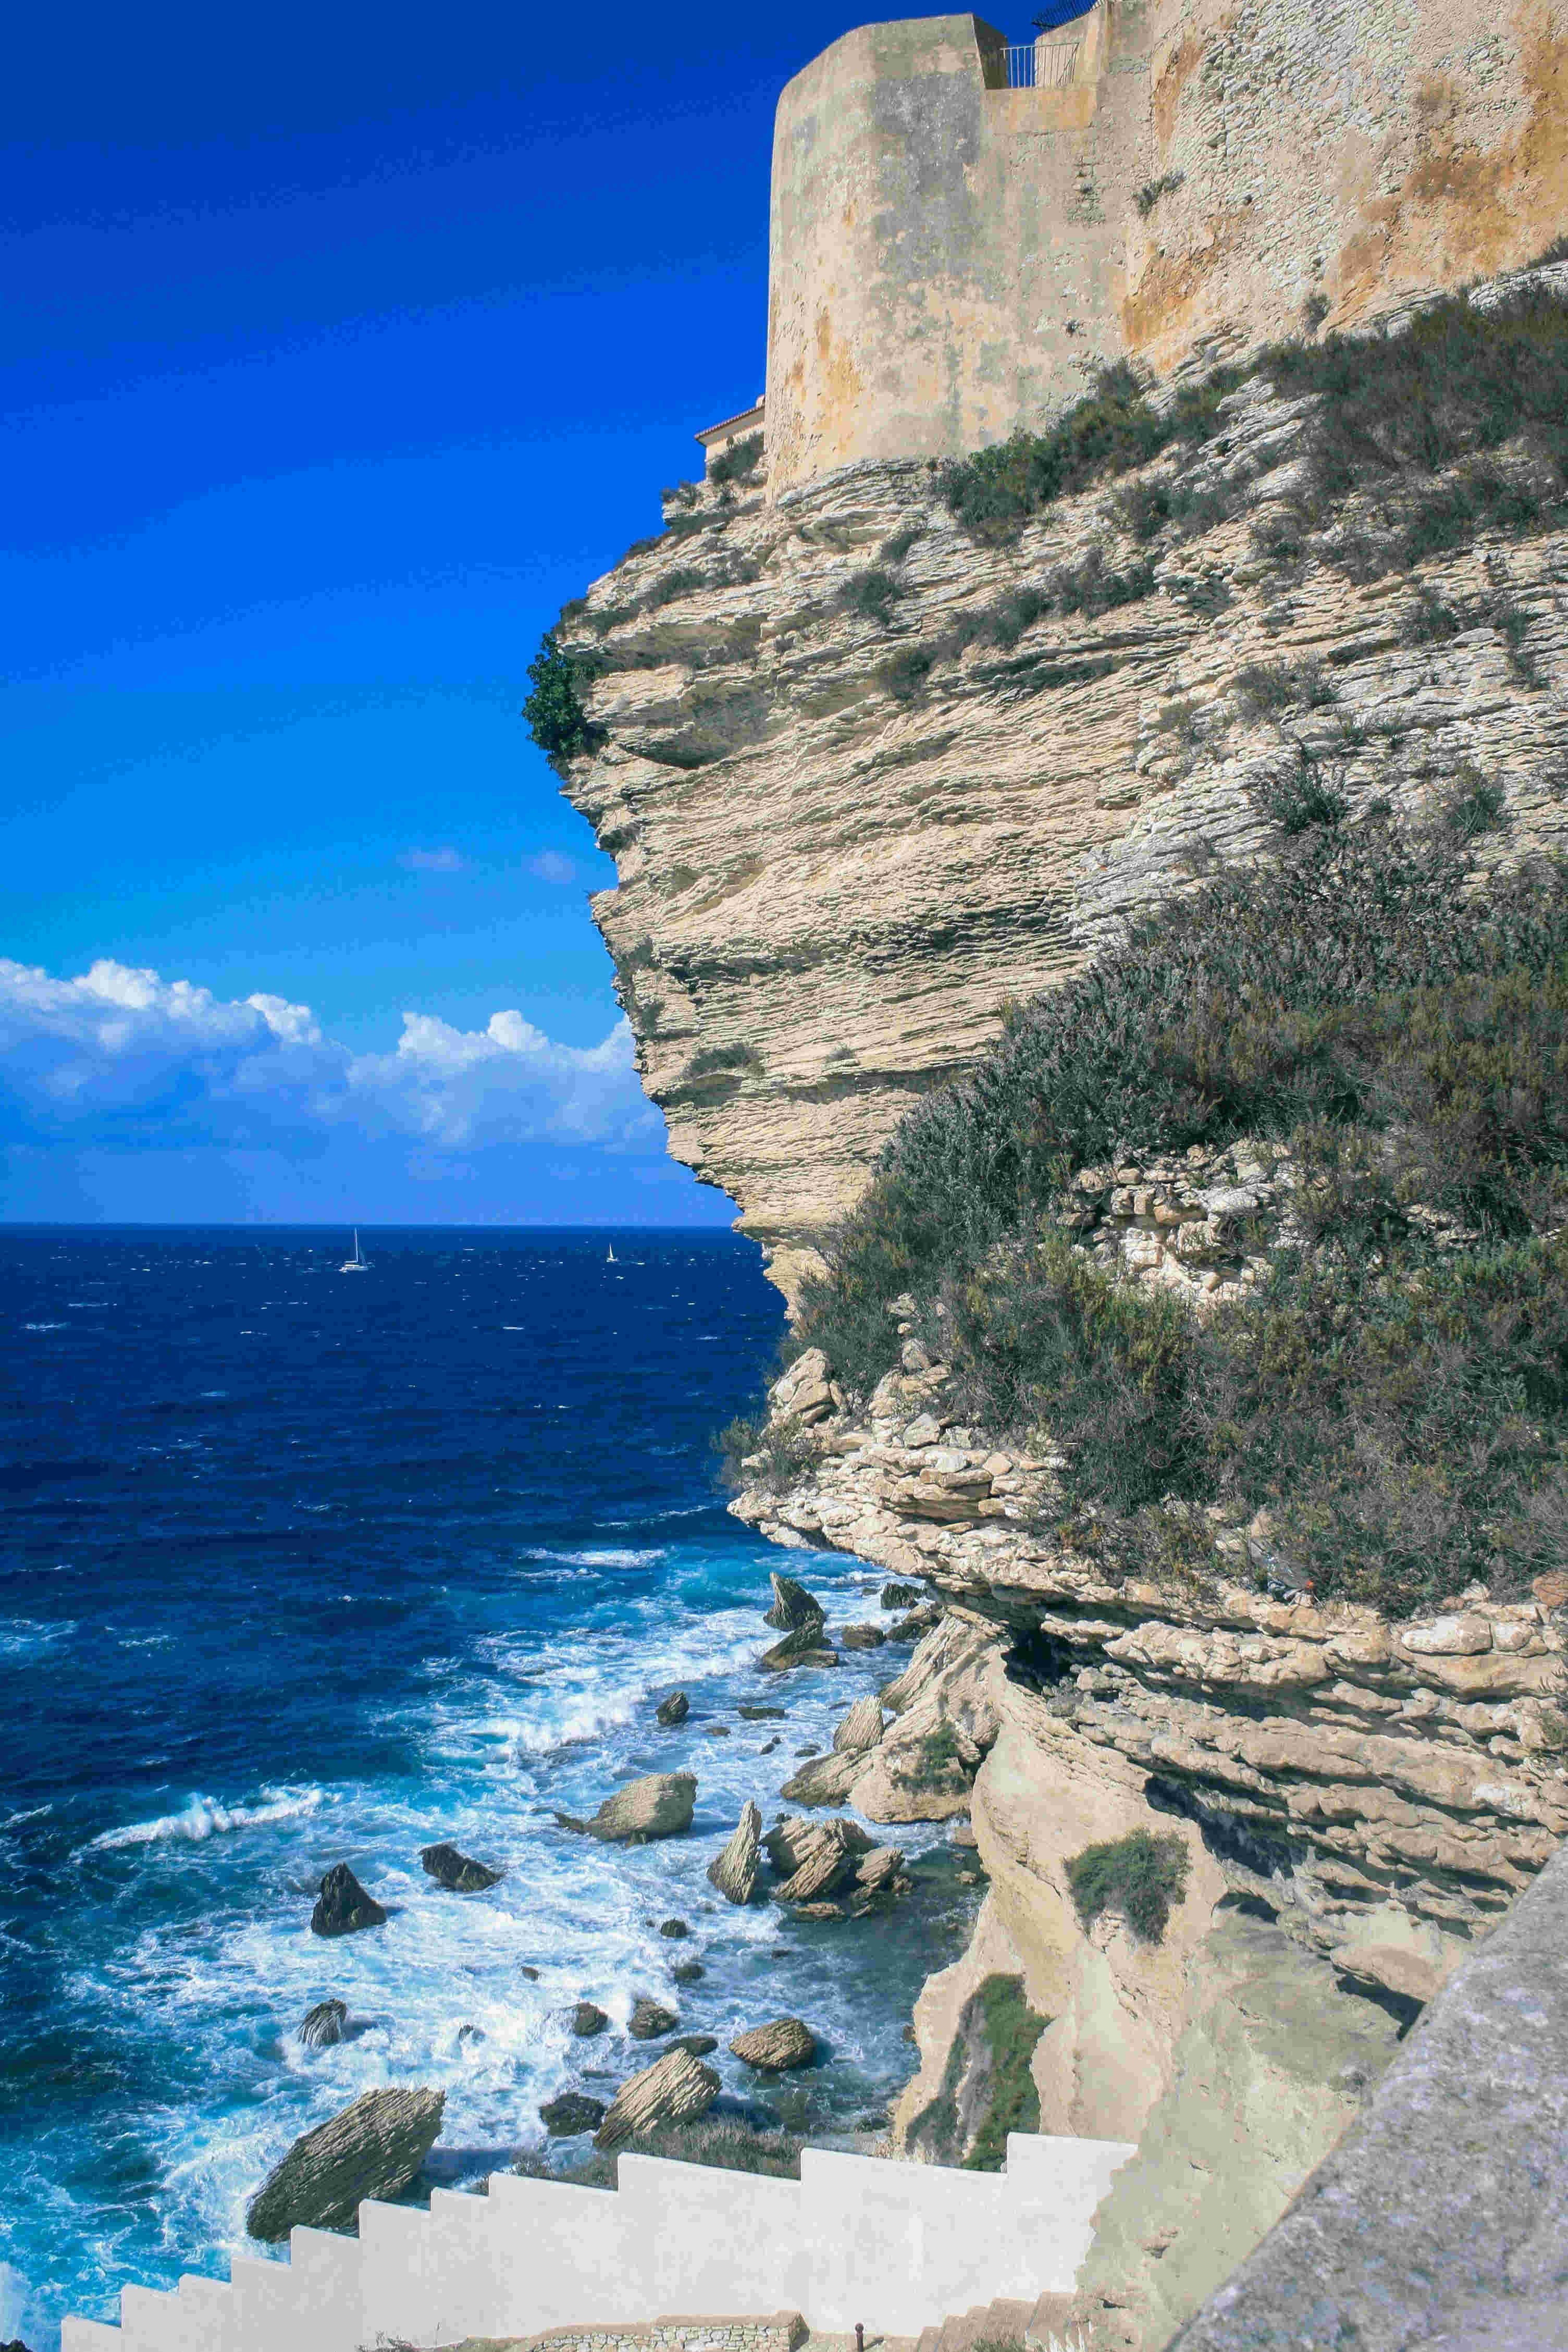
| 11:31, 7 December 2025 | CliffErosionBonifacio nejc-kosir.jpg (file) |  |
511 KB | Dronkers J | Erosion of a limestone cliff at Bonifacio, Corsica. Photo credit: Nejc Kosir. | 1 |
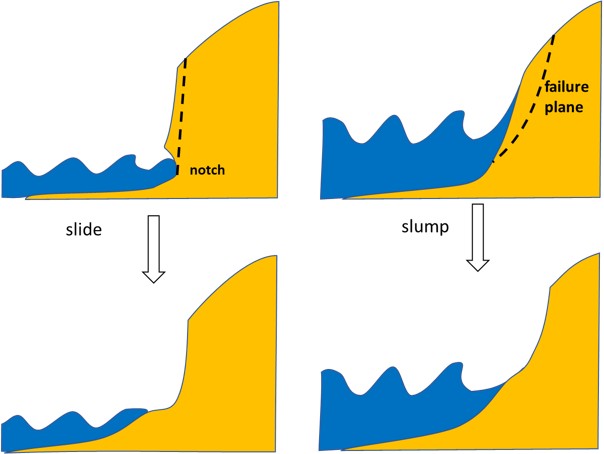
| 22:41, 29 November 2025 | DuneScarpMechanisms.jpg (file) |  |
34 KB | Dronkers J | Dune scarp mechanisms | 1 |
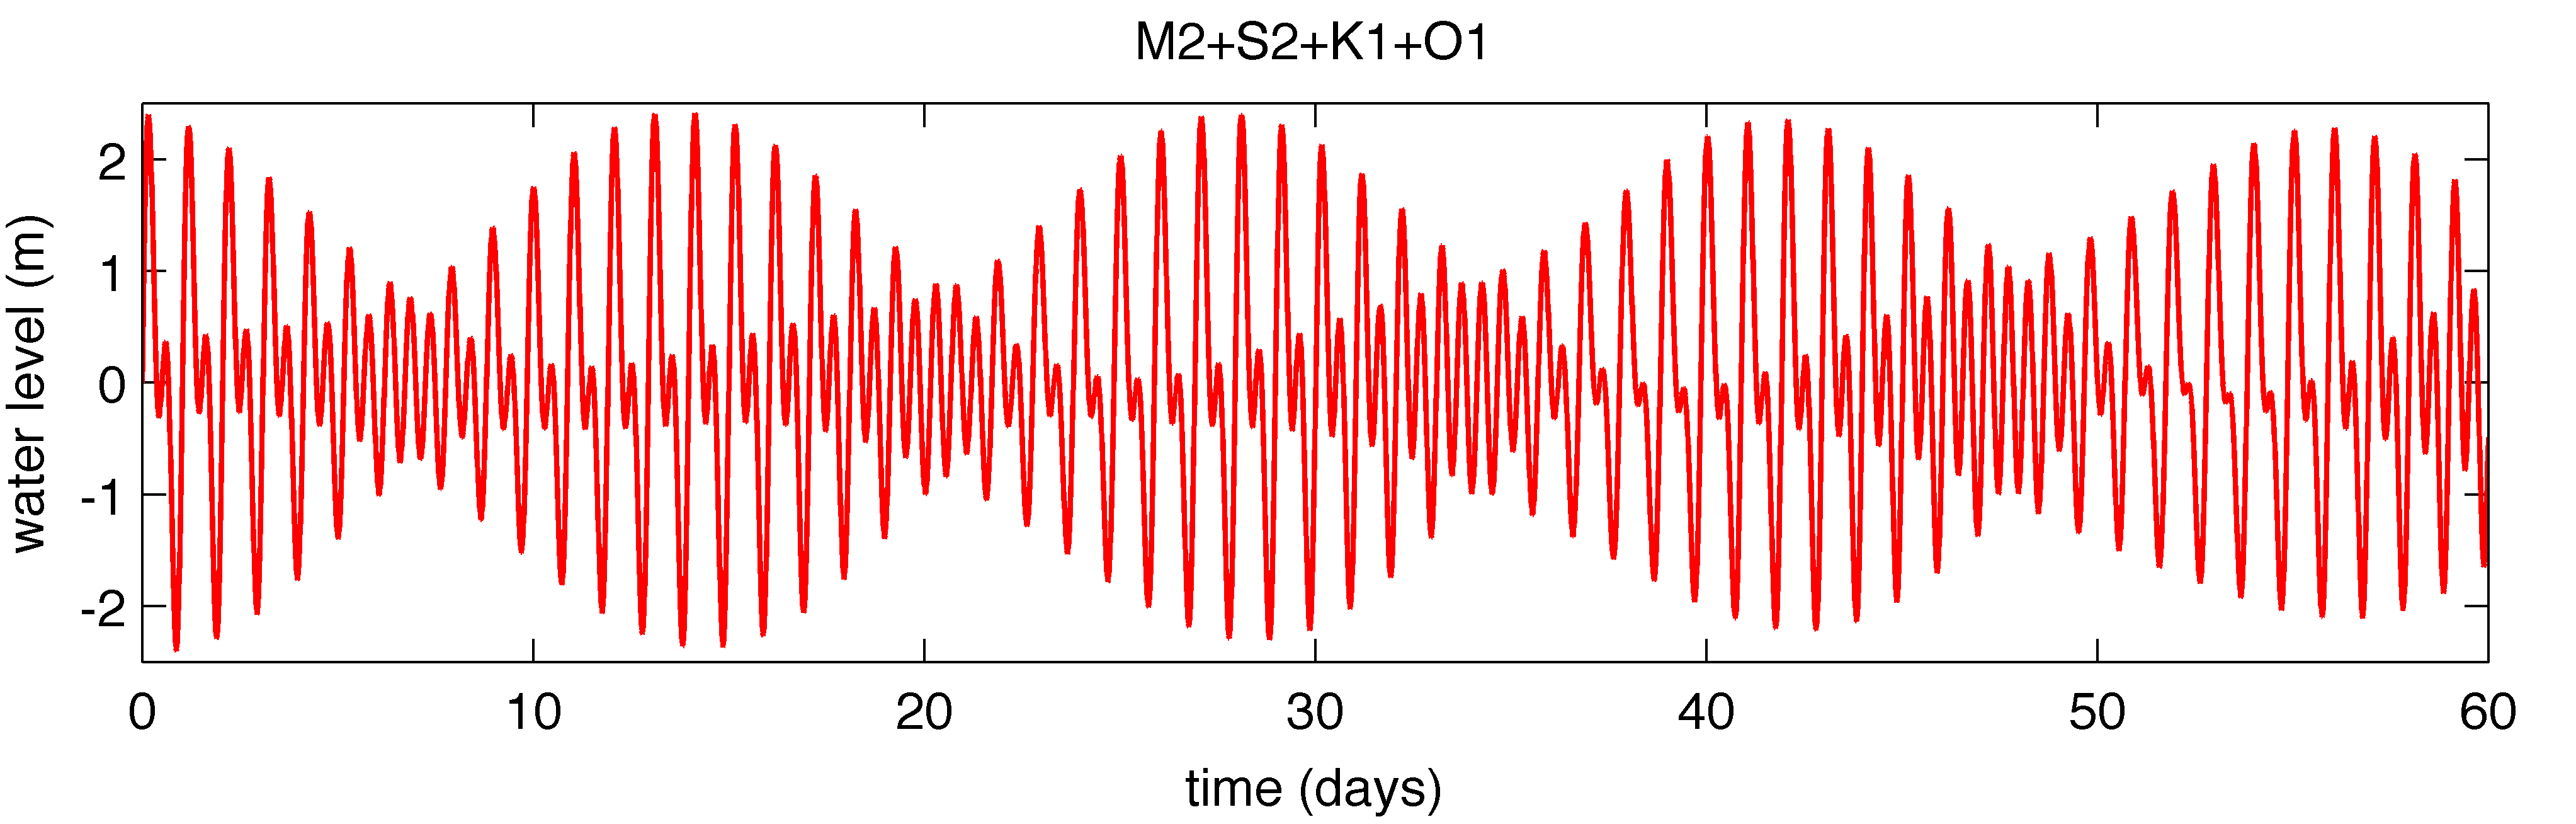
| 16:12, 20 November 2025 | Mixed cr.png (file) |  |
118 KB | Dronkers J | Tidal record of a mixed tide, with alternative dominance of the semidiurnal and diurnal components. | 1 |
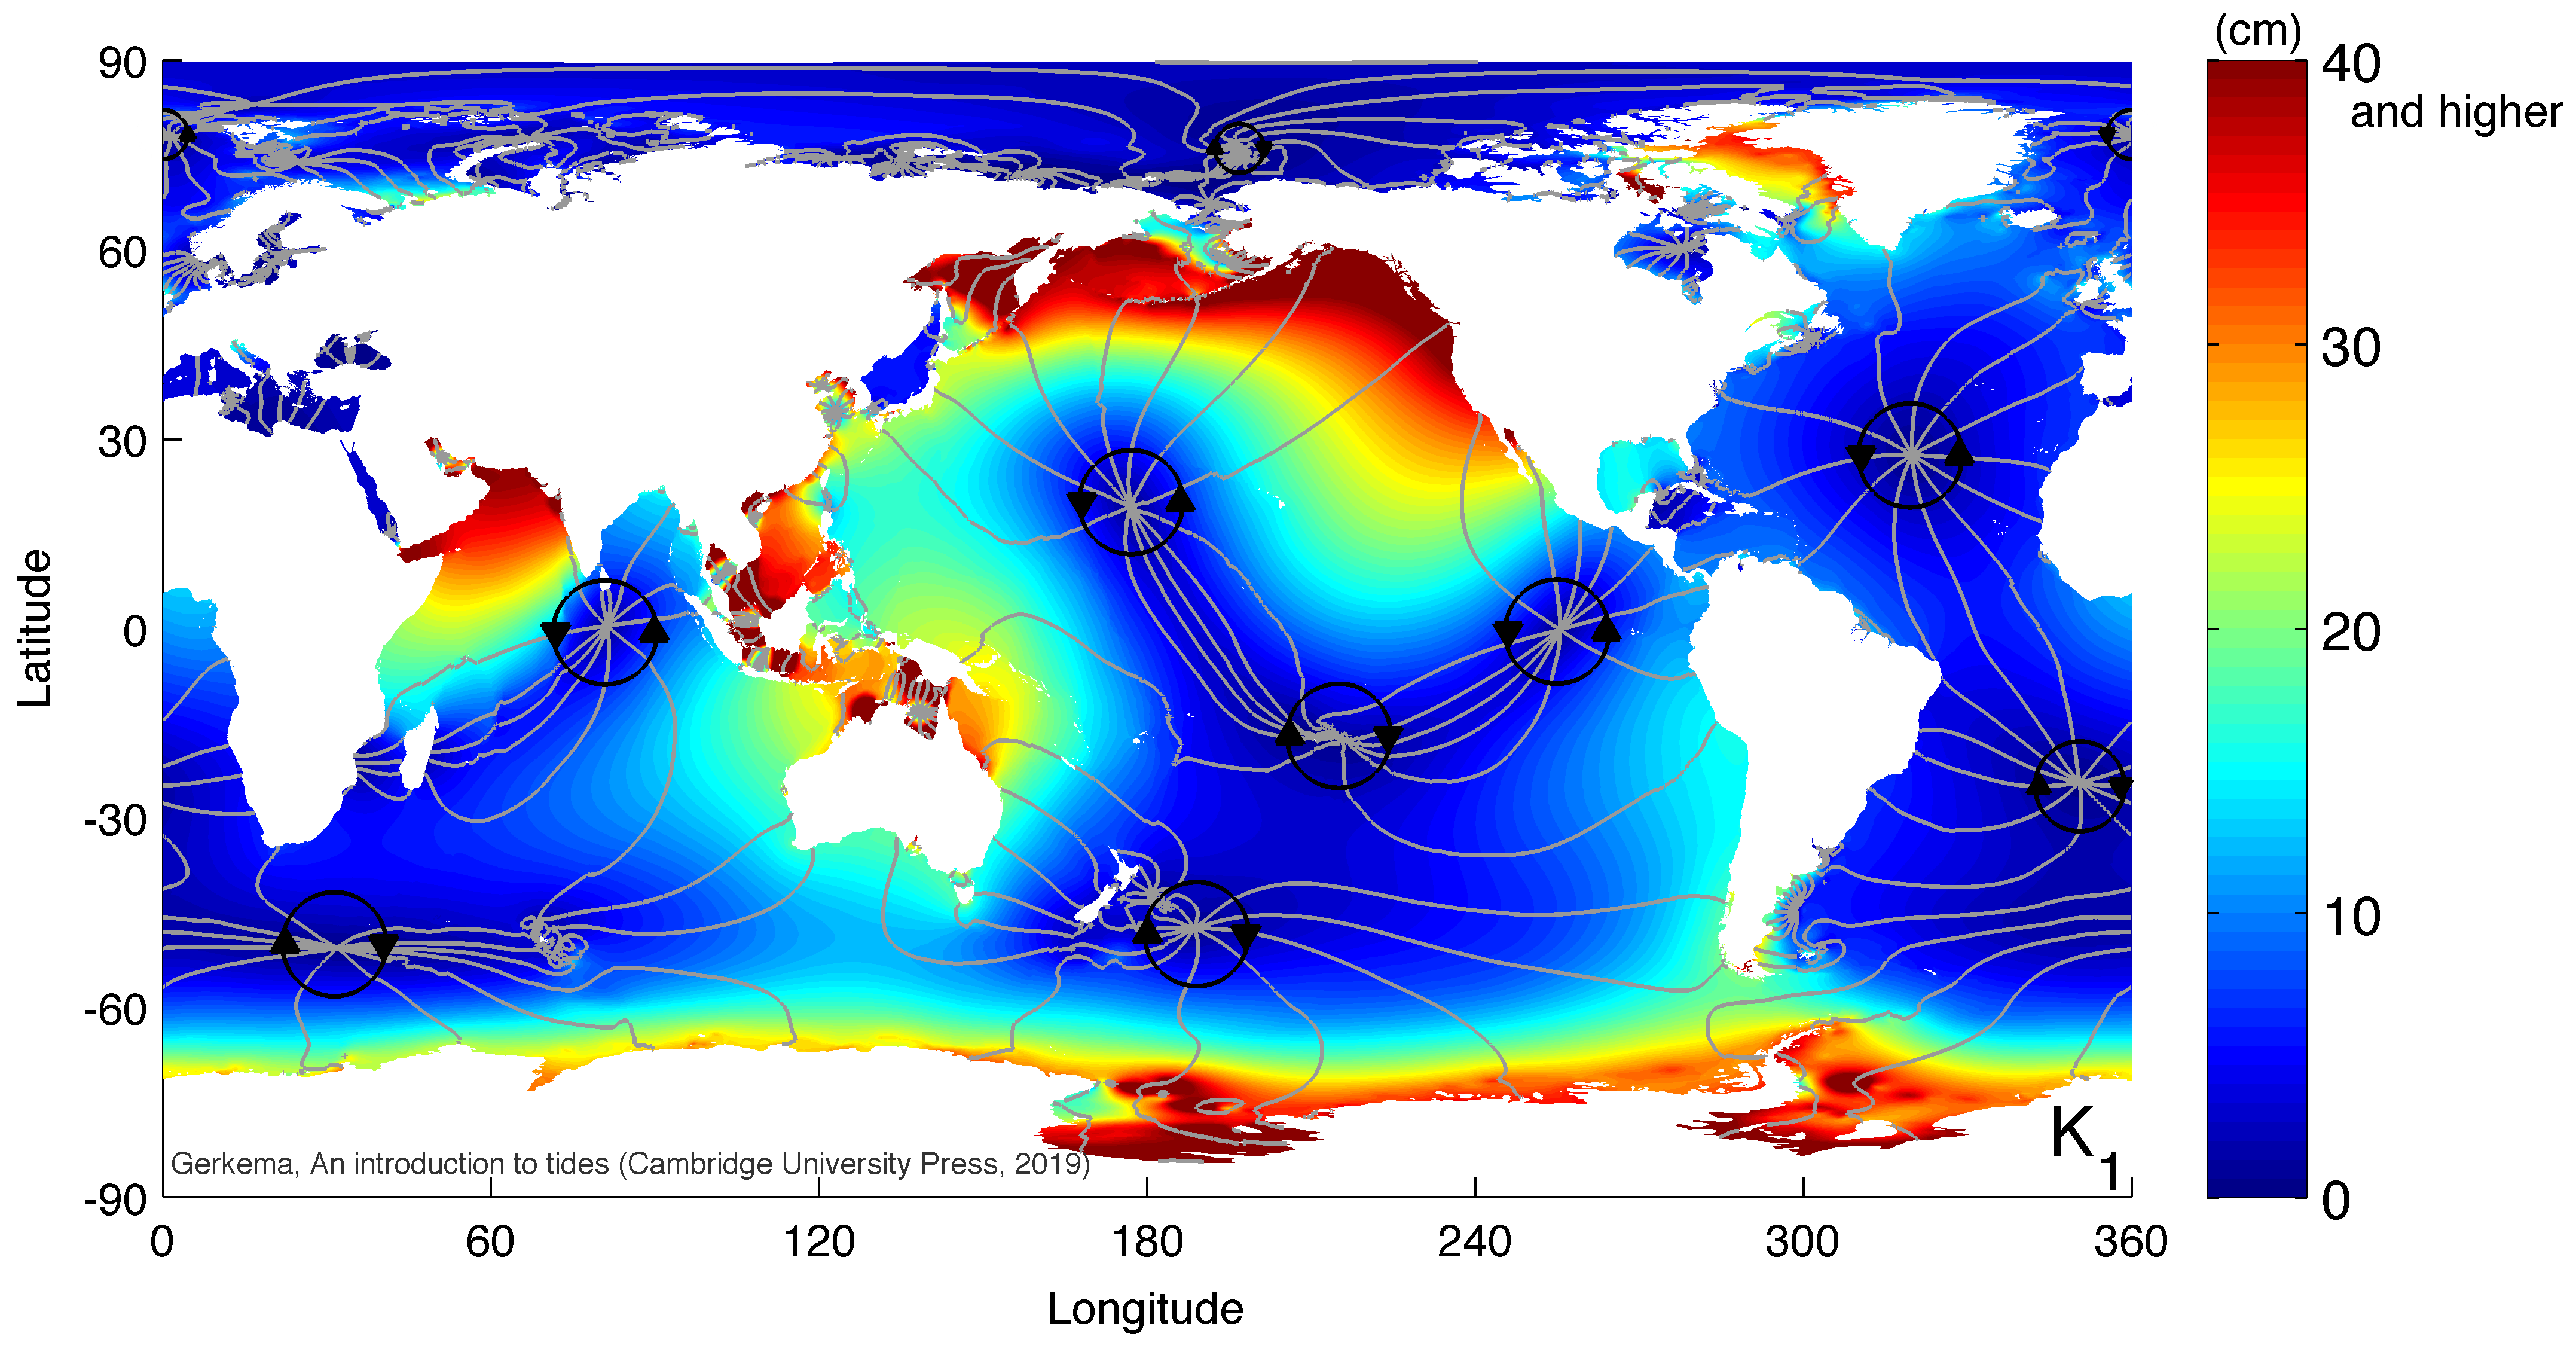
| 15:52, 20 November 2025 | Global K1 v2025 cr.png (file) |  |
959 KB | Dronkers J | Global map of the luni-solar declinational diurnal component K1. | 1 |
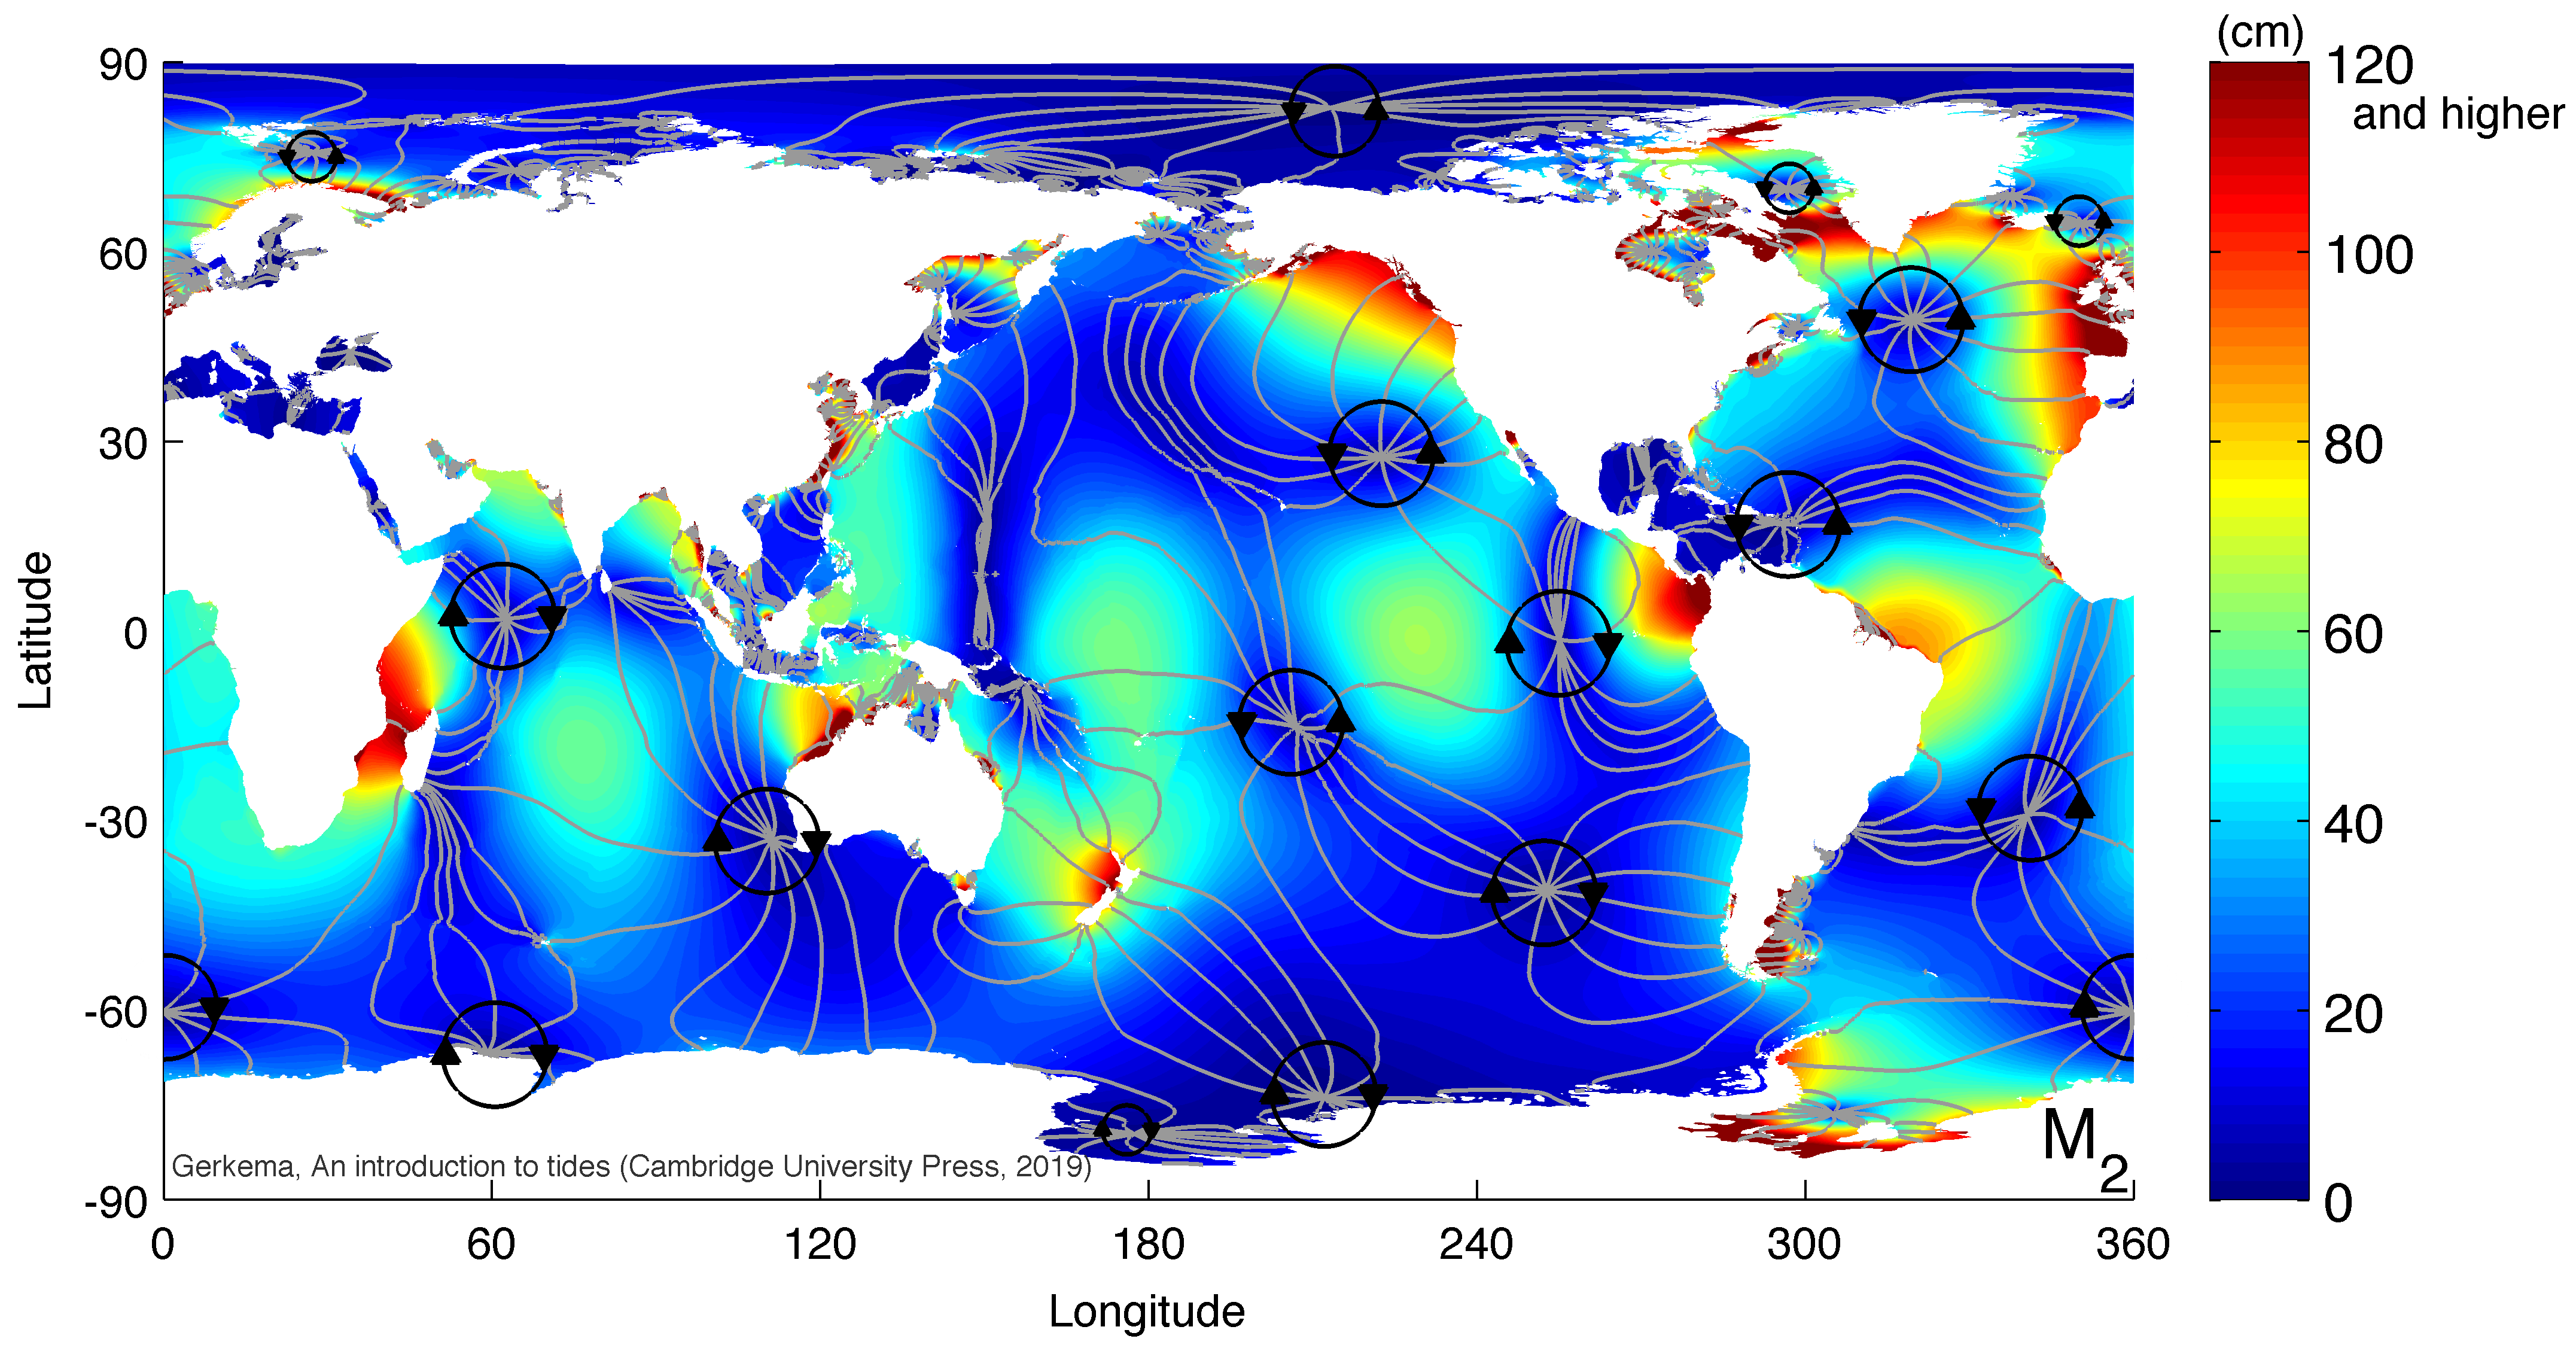
| 15:50, 20 November 2025 | Global M2 v2025 cr.png (file) |  |
1.04 MB | Dronkers J | Global map of the principal lunar semidiurnal component. | 1 |
| 20:55, 5 November 2025 | BasisKustlijn.jpg (file) |  |
269 KB | Dronkers J | Definition sketch of the base coastline, a volume-based coastline position, which is indicative of structural shoreline changes. | 2 |
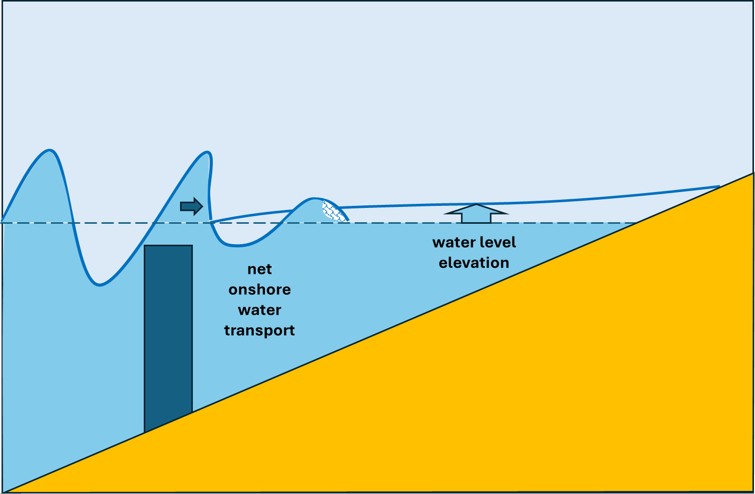
| 11:36, 5 November 2025 | LowCrestedBreakwaterOnshoreTransport.jpg (file) | 36 KB | Dronkers J | Schematic of net wave-induced onshore water transport over a submerged breakwater. | 1 | |
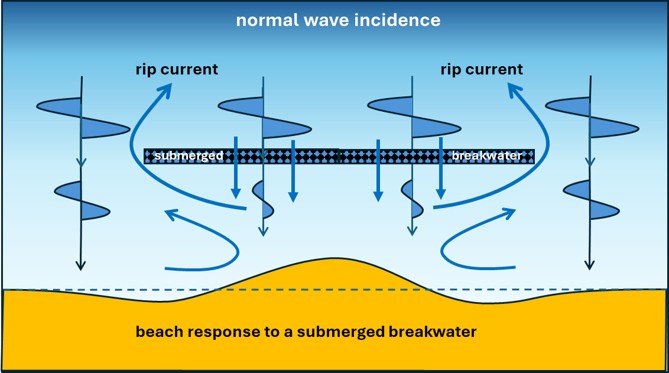
| 11:22, 5 November 2025 | LowCrestedBreakwaterRipCells.jpg (file) |  |
54 KB | Dronkers J | Beach response and rip cell circulation induced by a submerged breakwater situated seaward of the surf zone. | 1 |
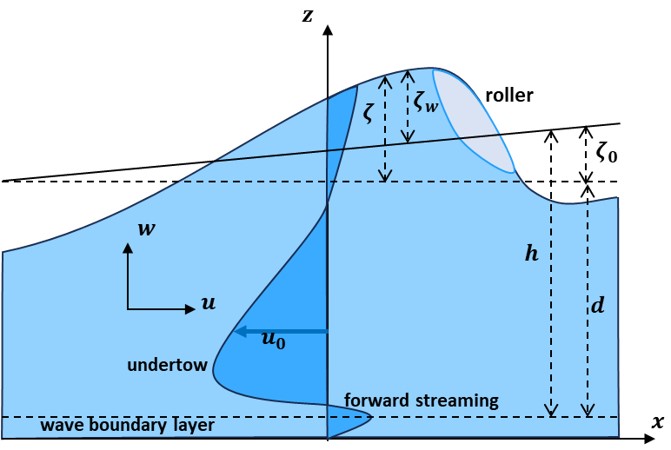
| 13:51, 1 November 2025 | UndertowSymbols.jpg (file) |  |
59 KB | Dronkers J | Definition sketch for the undertow momentum balance equations. | 2 |
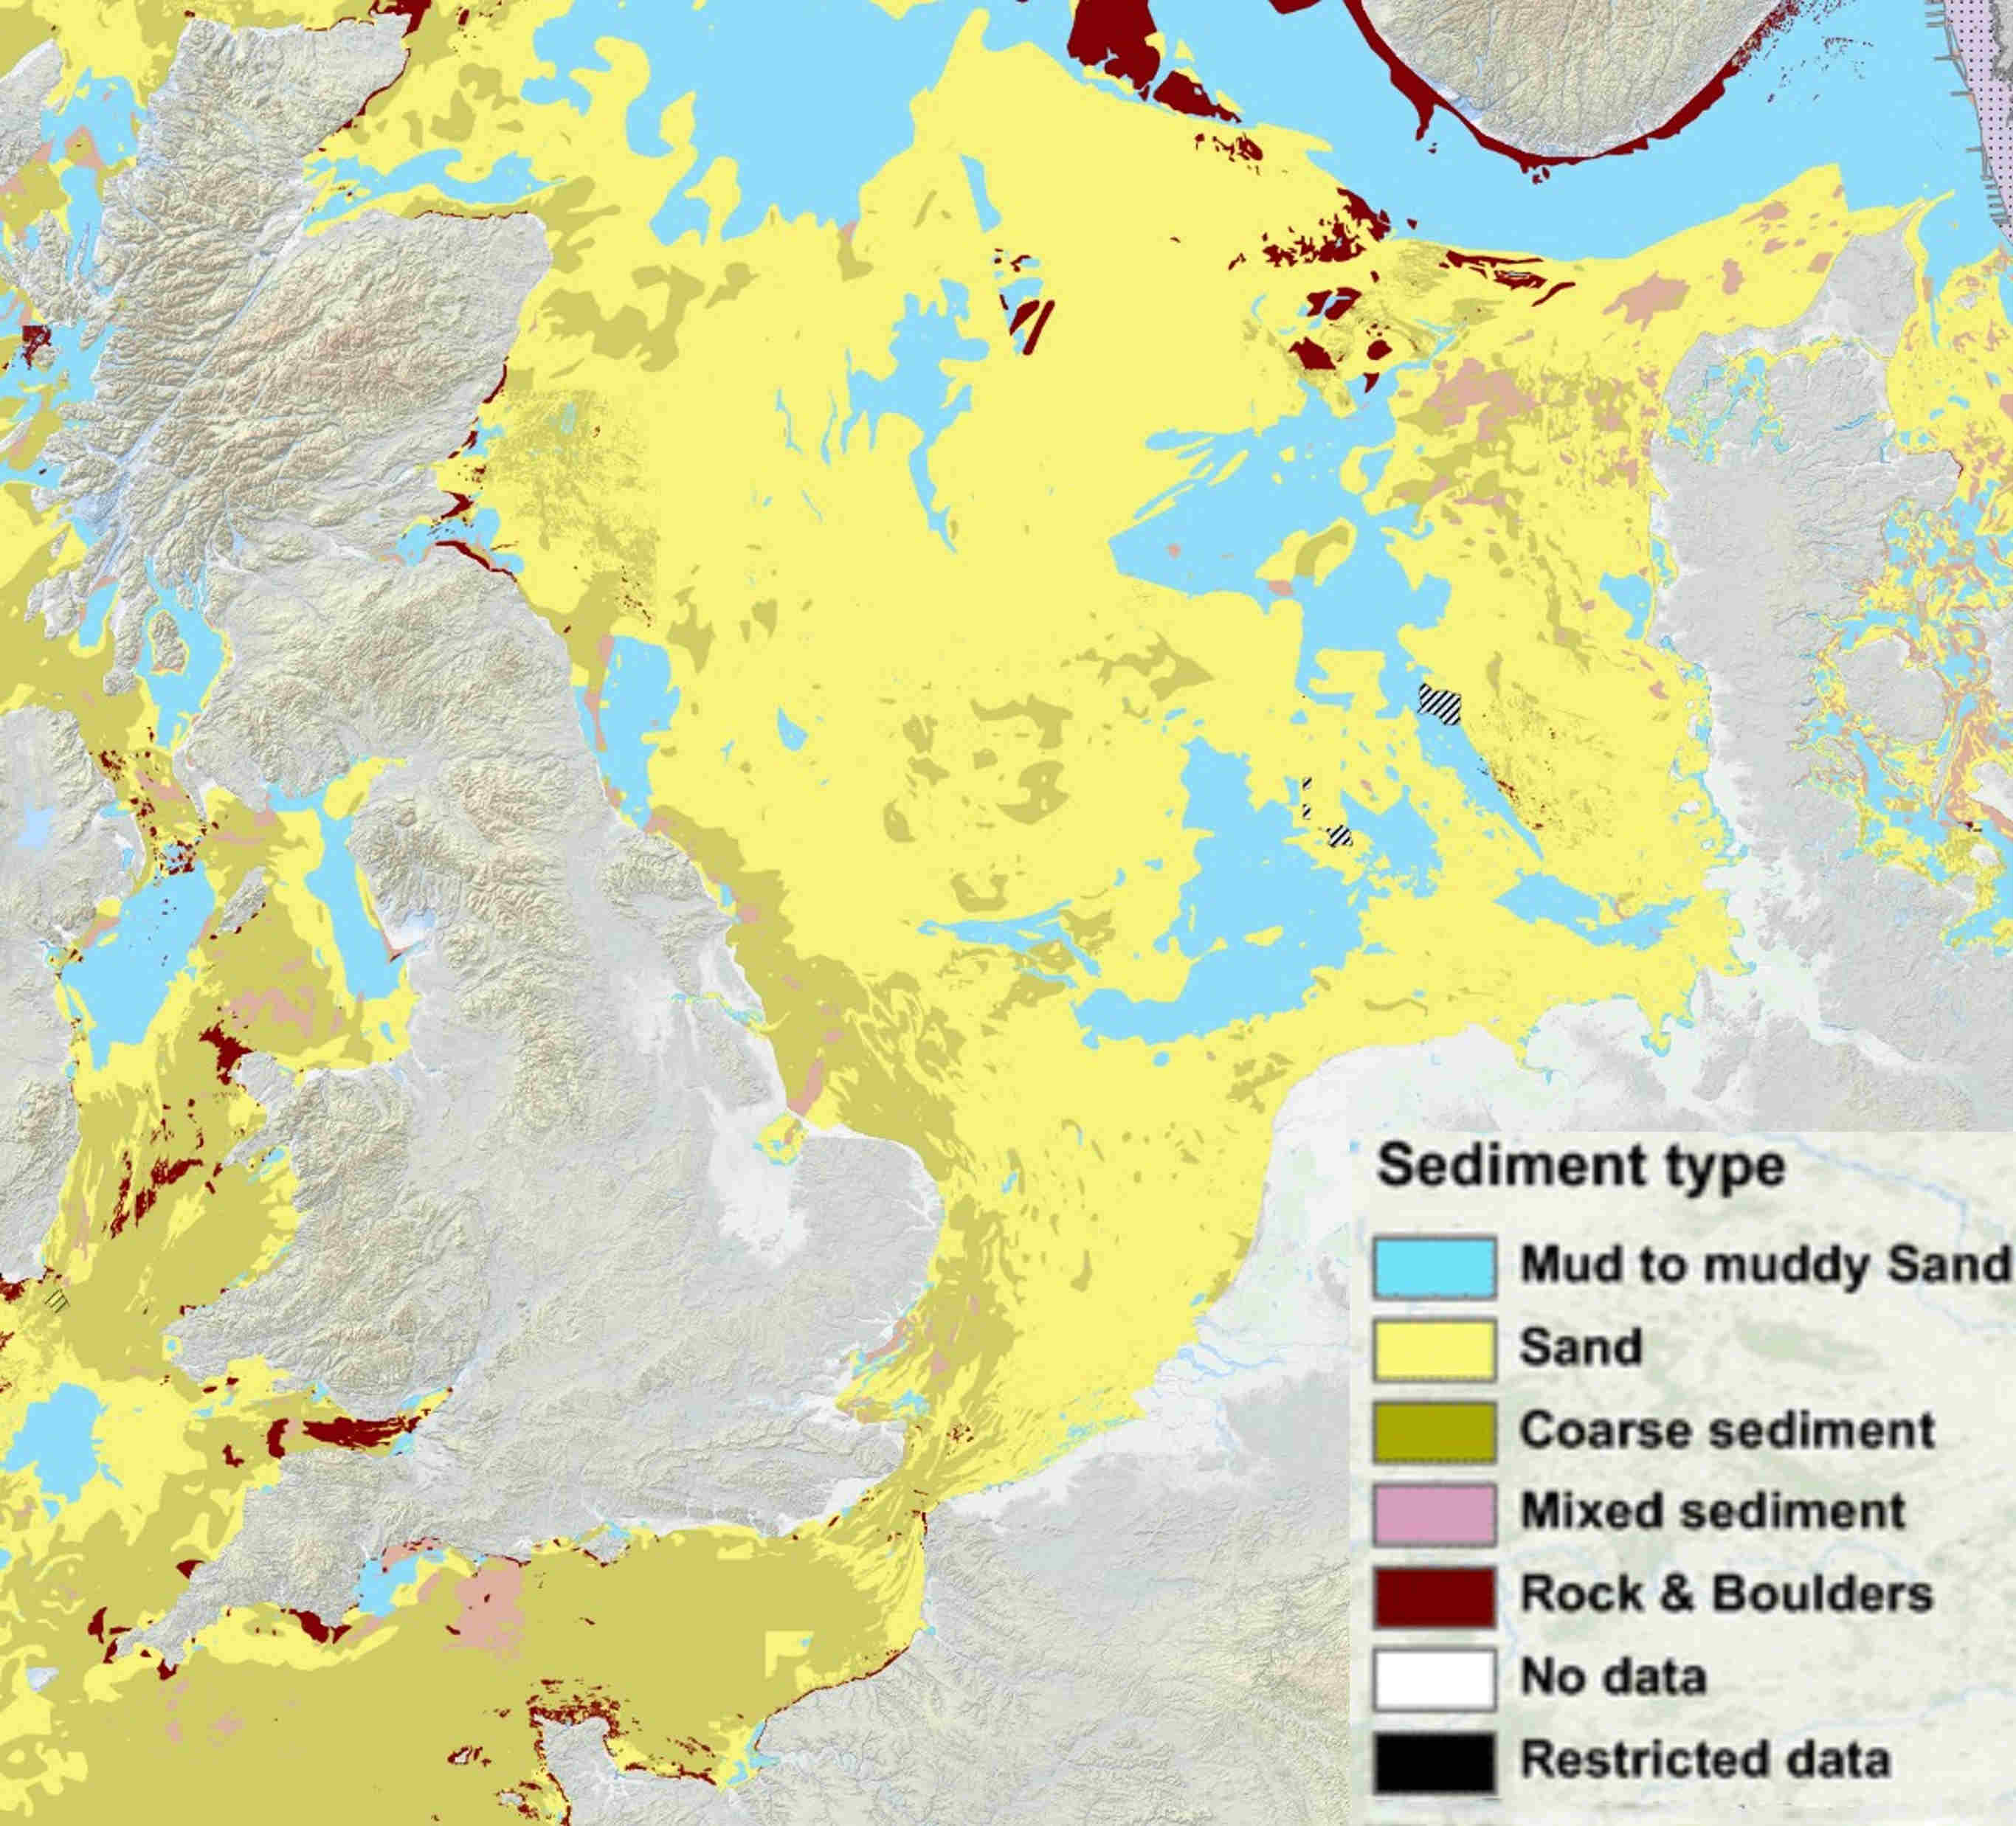
| 21:34, 31 October 2025 | NorthSeaSeafloorSediment.jpg (file) |  |
285 KB | Dronkers J | North Sea seafloor sediment map. Source: EMODnet Map viewer. | 1 |
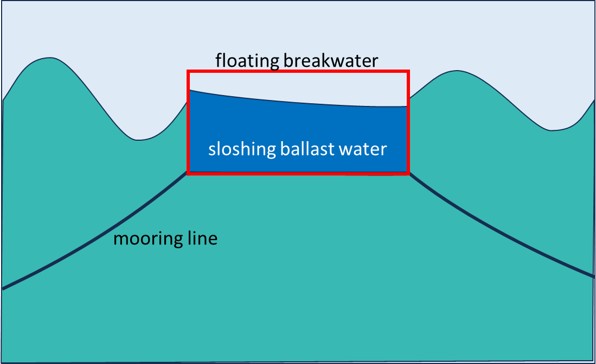
| 13:08, 22 October 2025 | BallastBreakwater.jpg (file) |  |
25 KB | Dronkers J | Breakwater filled with ballast water that absorbs and dissipates wave energy through sloshing | 1 |
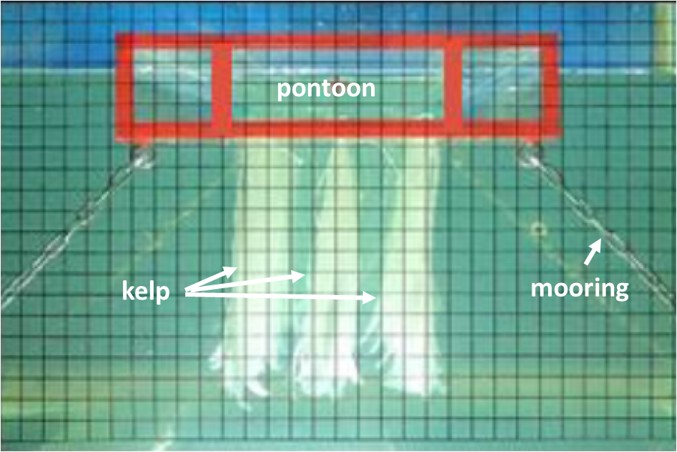
| 12:54, 22 October 2025 | KelpBreakwater.jpg (file) |  |
67 KB | Dronkers J | Floating breakwater with a curtain of kelp that absorbs and dissipates wave energy | 1 |
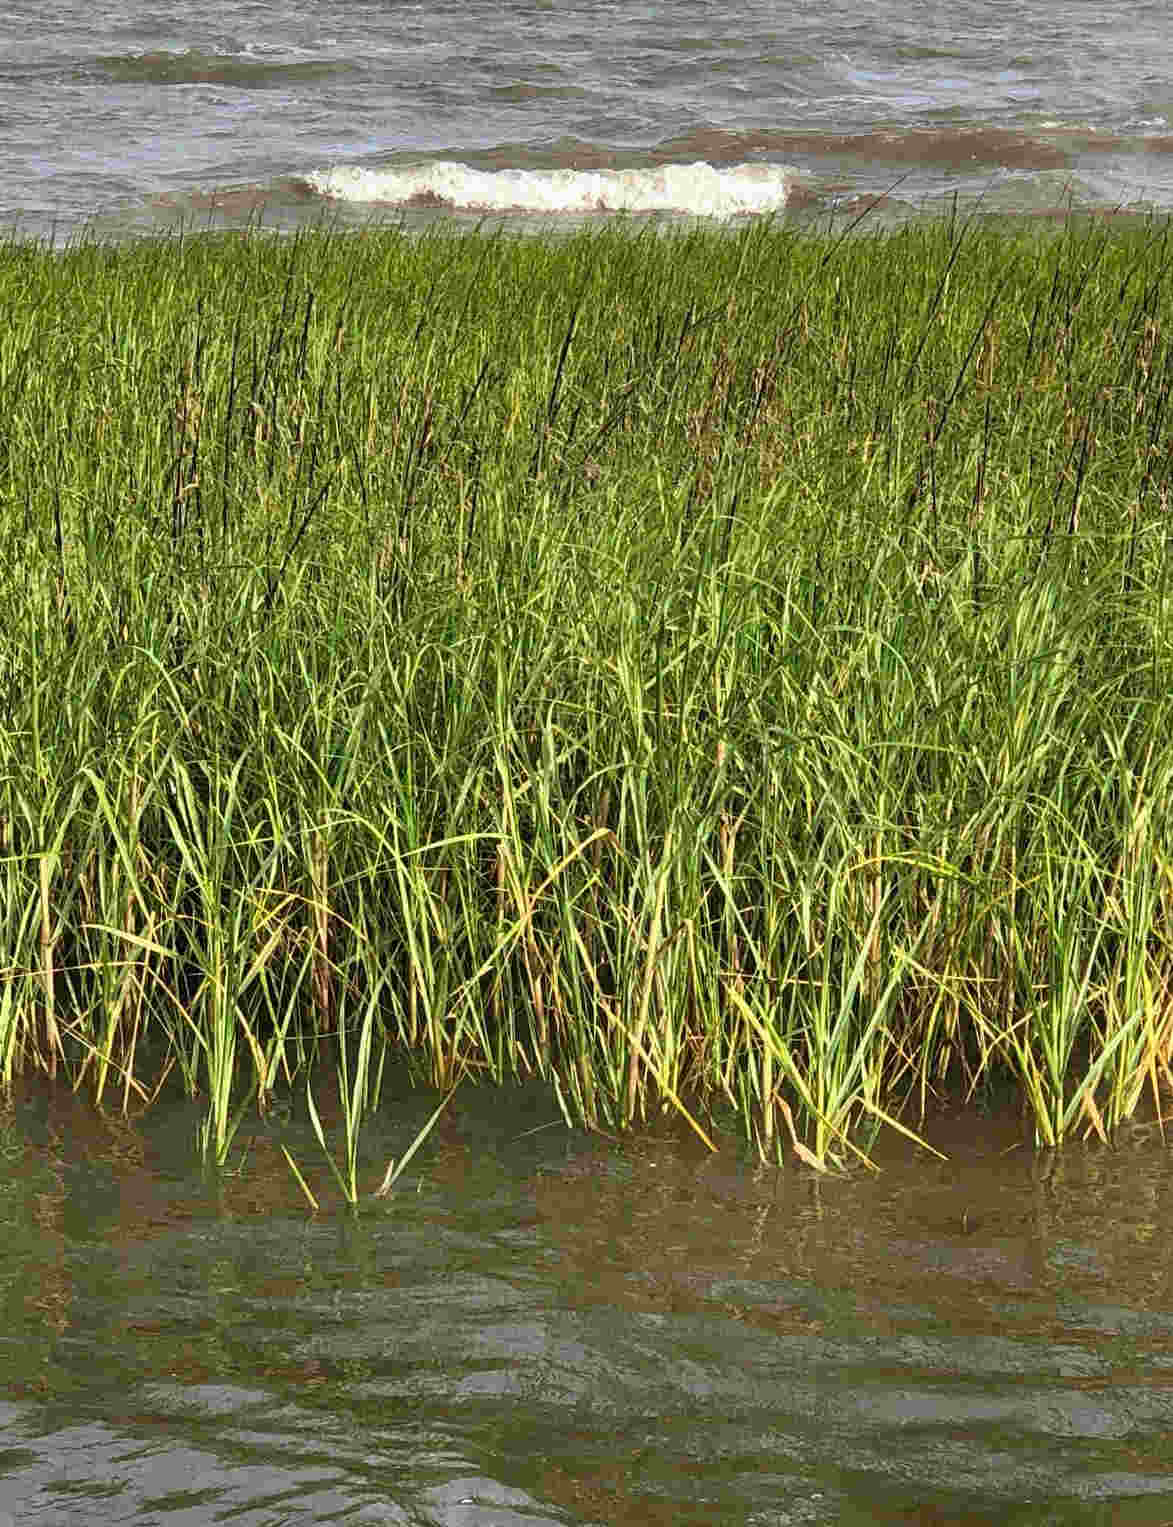
| 10:41, 24 August 2025 | SpartinaAlterniflora.jpg (file) |  |
111 KB | Dronkers J | Spartina alterniflora Photo credit Janet Wright Creative Commons Licence | 1 |
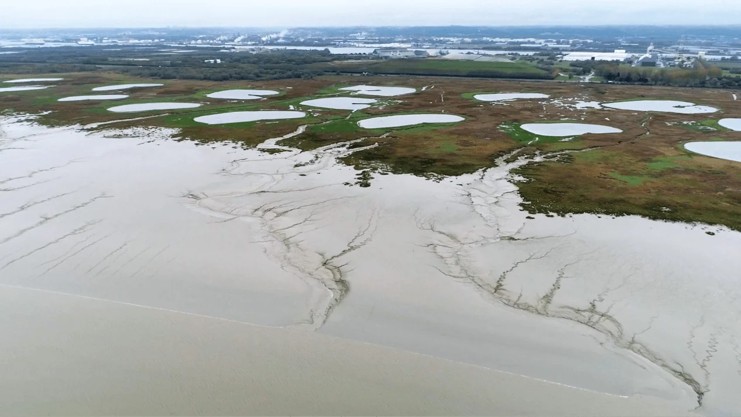
| 14:53, 23 August 2025 | MarshPonds.jpg (file) |  |
65 KB | Dronkers J | Mudflat and marsh of the Seine estuary. Photo credit: GIP Seine Aval | 1 |
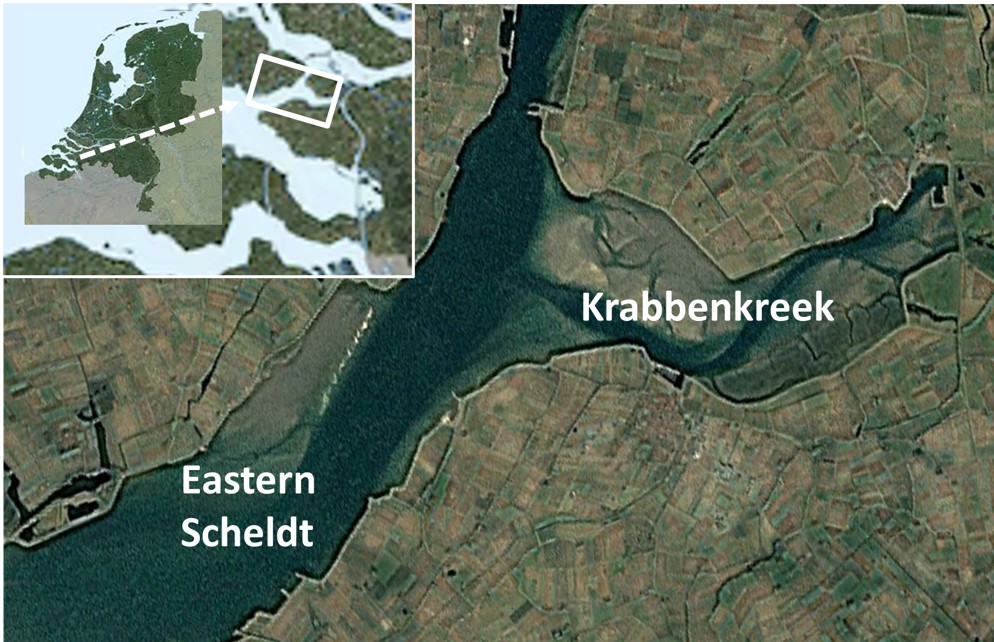
| 17:12, 30 July 2025 | Krabbenkreek.jpg (file) |  |
192 KB | Dronkers J | The Krabbenkreek, a large creek that contributes to longitudinal dispersion in the Eastern Scheldt estuary (Netherlands) | 2 |
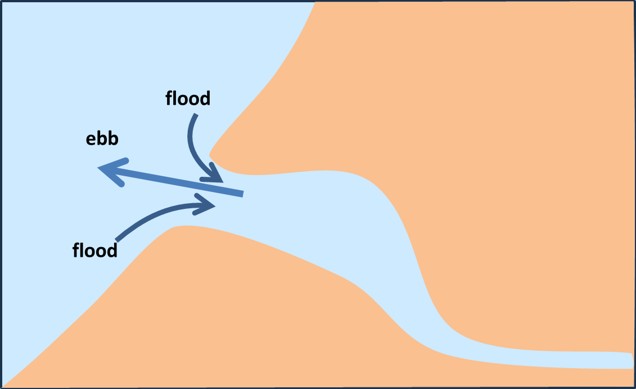
| 16:49, 30 July 2025 | TidalPumping.jpg (file) |  |
20 KB | Dronkers J | Schematic representation of seawater intrusing by tidal pumping. | 1 |
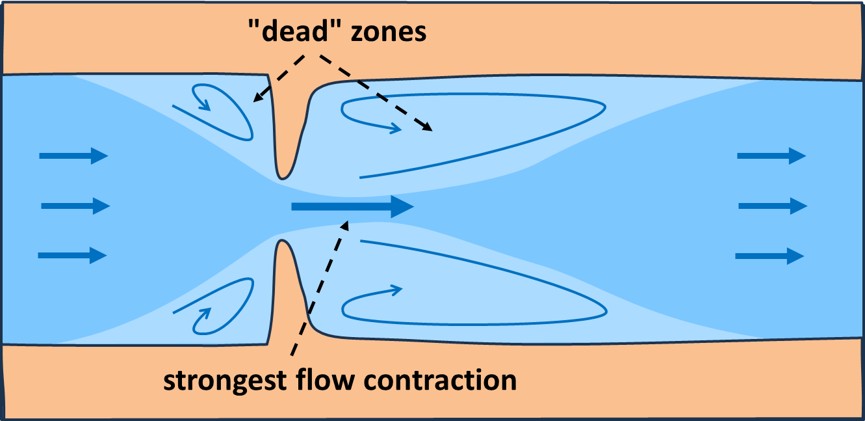
| 16:20, 30 July 2025 | FlowContraction.jpg (file) |  |
53 KB | Dronkers J | Schematic of flow pattern at a channel constriction. | 1 |
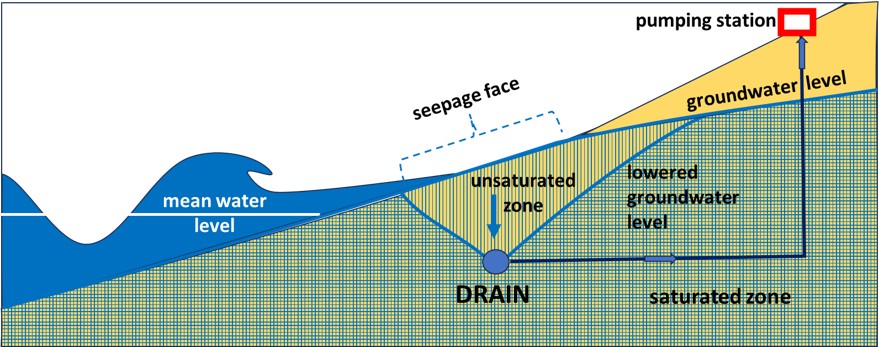
| 13:38, 28 June 2025 | BeachDrainA.jpg (file) |  |
117 KB | Dronkers J | Schematic of active beach drainage | 2 |
| 12:26, 28 June 2025 | BeachDrainP.jpg (file) |  |
63 KB | Dronkers J | Schematic of passive beach drainage | 1 |
| 16:38, 20 June 2025 | BandAcehTsunamiLeadingDepression.jpg (file) |  |
1.31 MB | Dronkers J | Retreating shoreline before arrival of the major wave of the Indian Ocean tsunami at Banda Aceh on December 26, 2004. Adapted from Synolakis and Bernard 2006. | 2 |
| 10:41, 20 June 2025 | TsunamiSinus.jpg (file) |  |
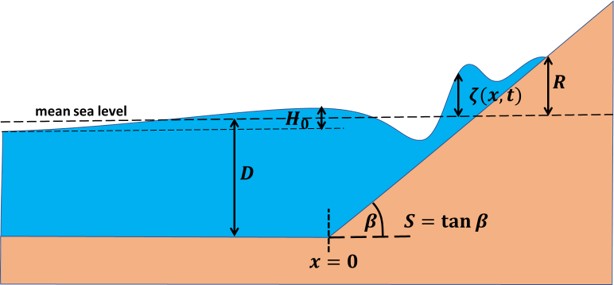
23 KB | Dronkers J | Schematic of the shelf/shoreface slope used in the tsunami run-up model of Madsen and Schäfer (2010) | 1 |
| 18:47, 31 May 2025 | TsunamiUprush.jpg (file) |  |
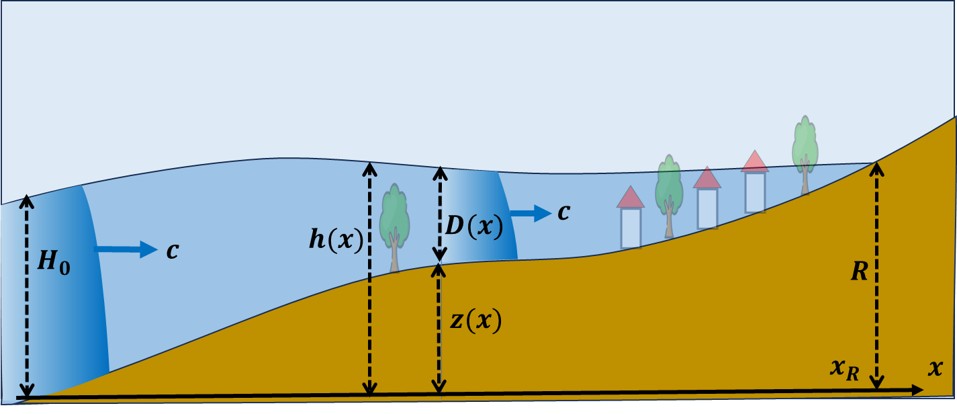
45 KB | Dronkers J | Schematic of Tsunami uprush. | 2 |
| 14:46, 31 May 2025 | Tohoku.jpg (file) |  |
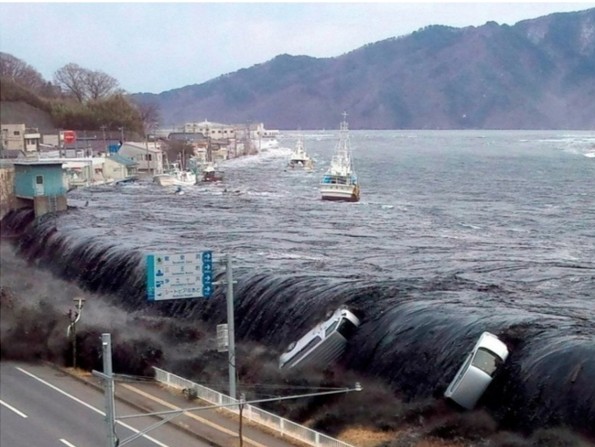
71 KB | Dronkers J | Overflow of a seawall in Sanriku coast by the Tohoku tsunami. Photo credit Headquarters for Earthquake Research Promotion, Japan. Creative Commons Licence. | 1 |
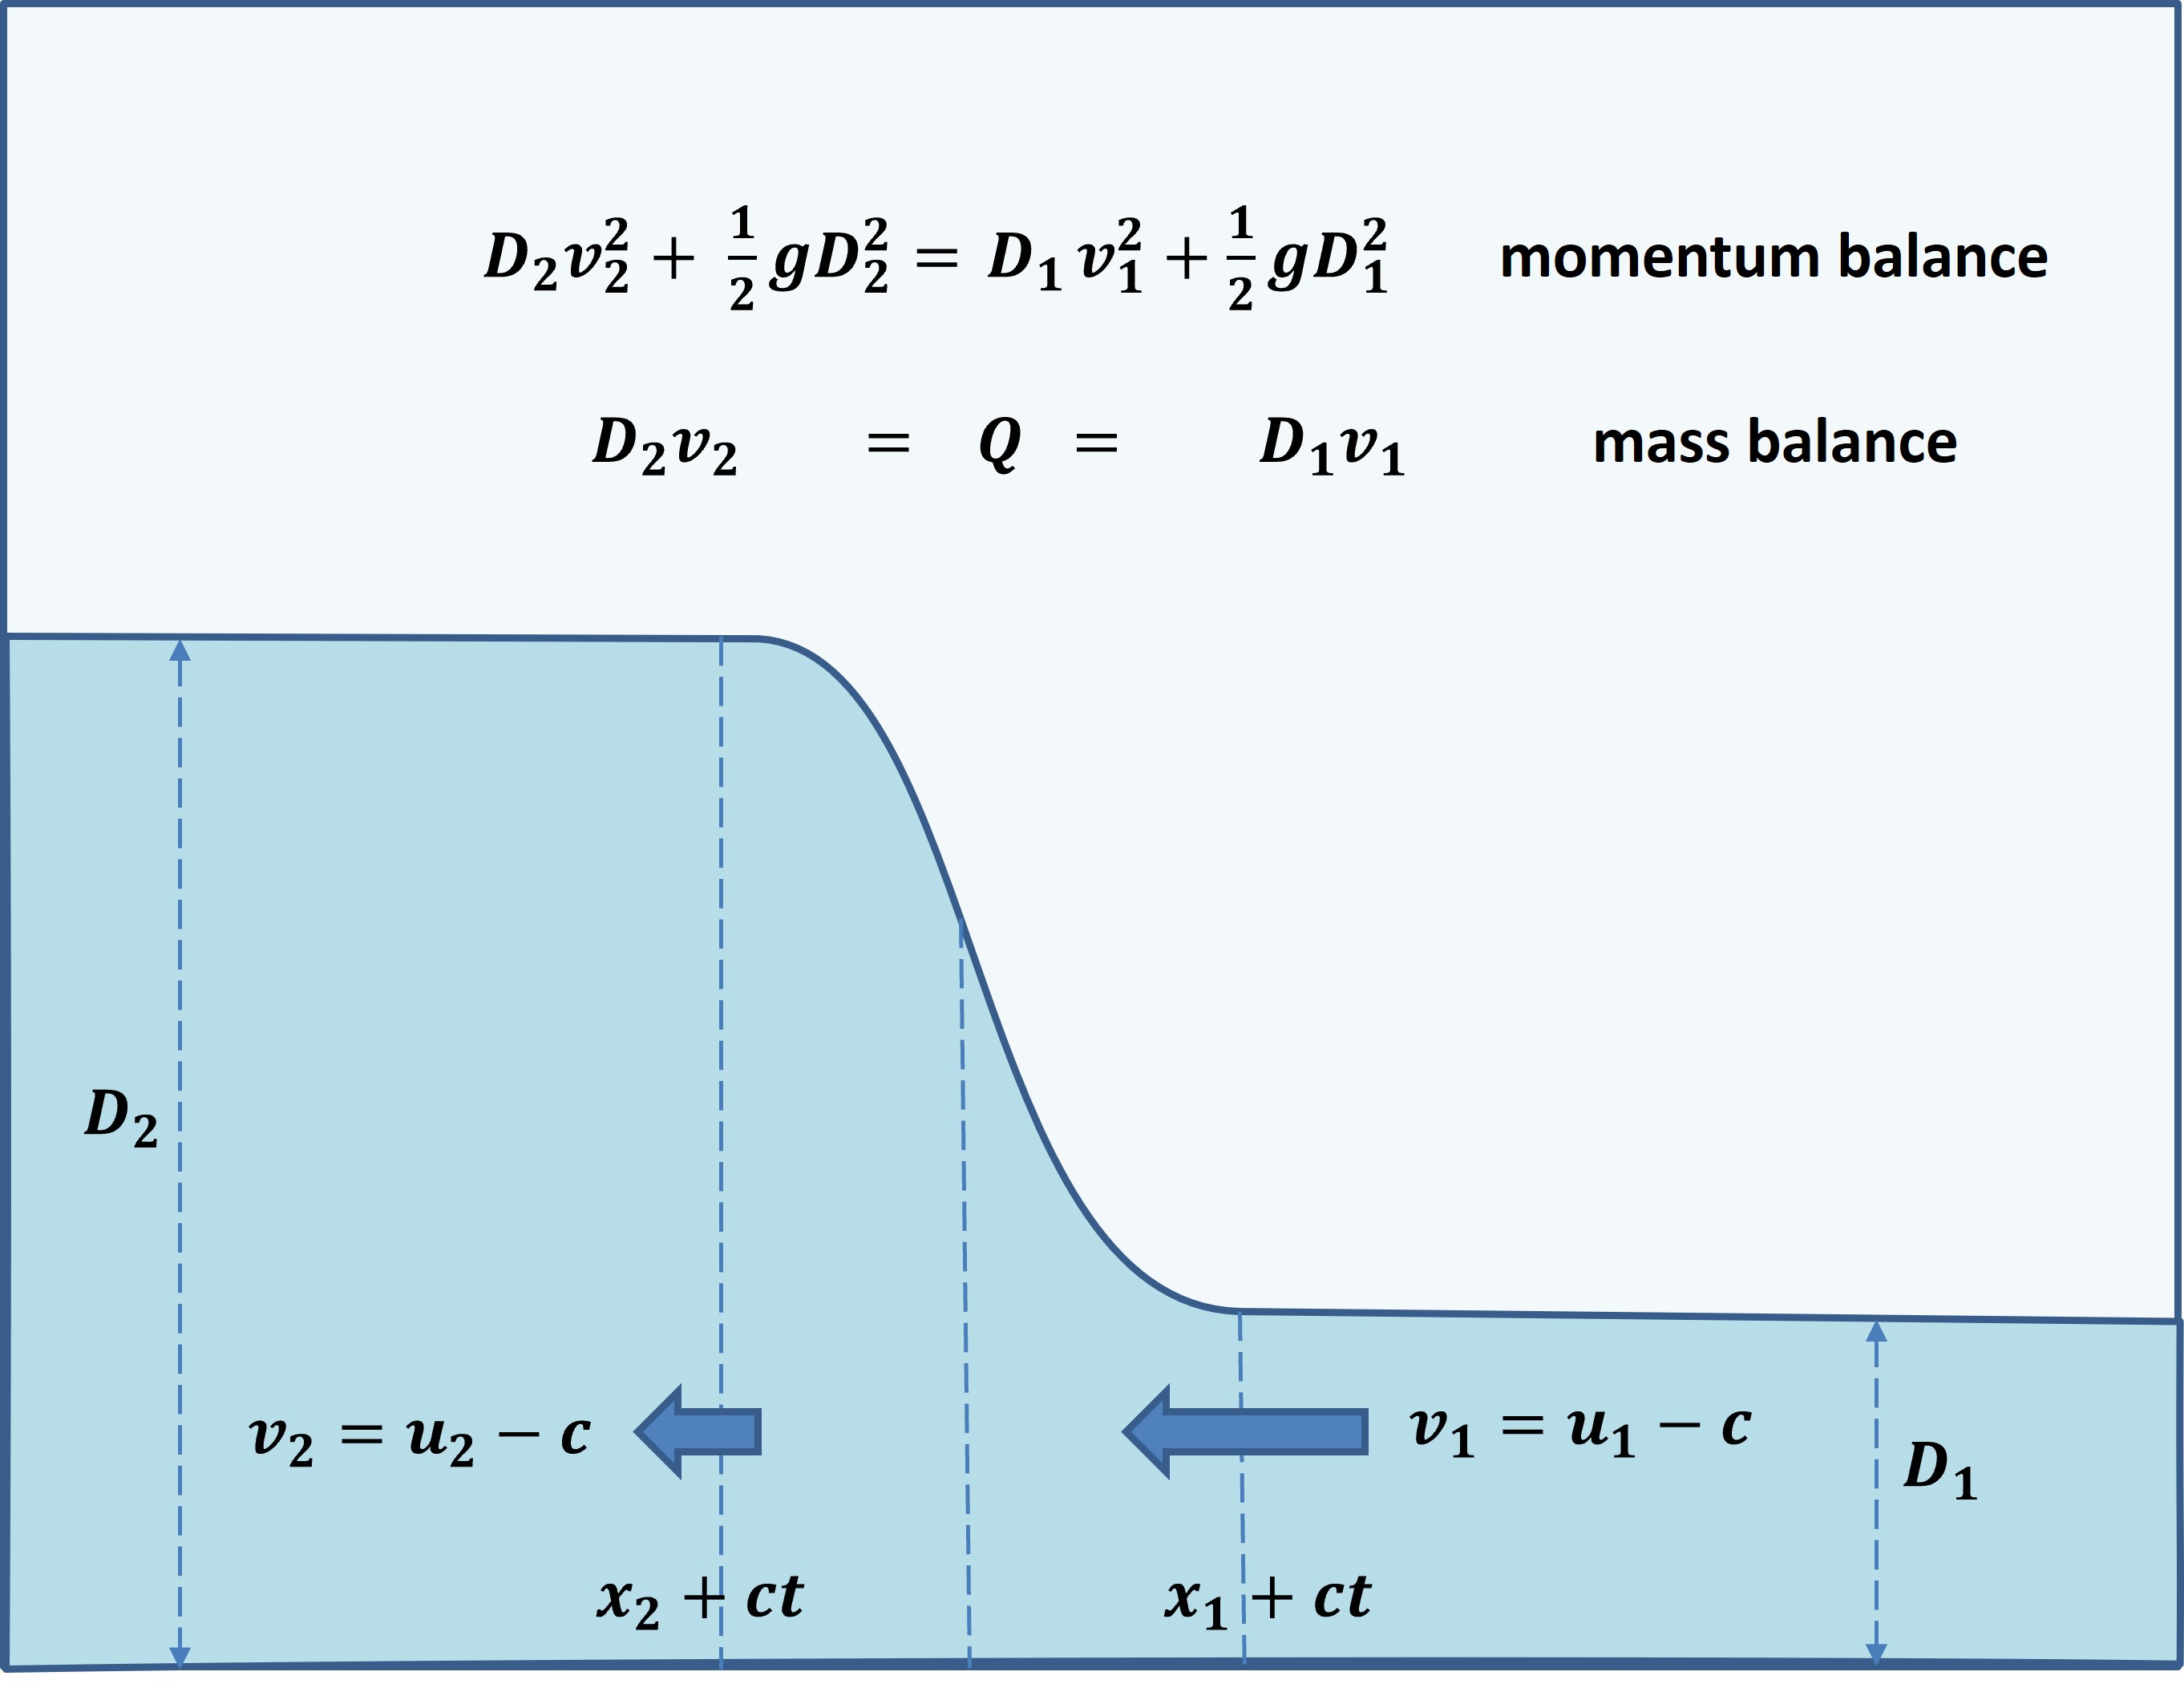
| 09:22, 31 May 2025 | TidalBoreMomentum.jpg (file) |  |
258 KB | Dronkers J | Schematic representation of a hydraulic jump in a frame moving with the velocity of the hydraulic jump. | 1 |
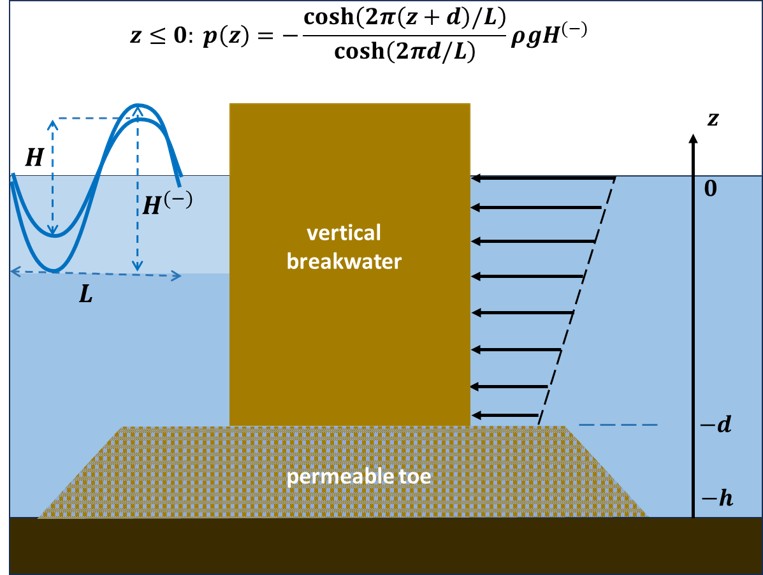
| 11:37, 29 May 2025 | SeawardWaveLoadBreakwater.jpg (file) |  |
72 KB | Dronkers J | Boccotti’s formula for seaward wave pressure loading on a vertical breakwater<ref>Boccotti, P. 2000. Wave mechanics for ocean engineering, Elsevier Science, Oxford, UK</ref>. | 1 |
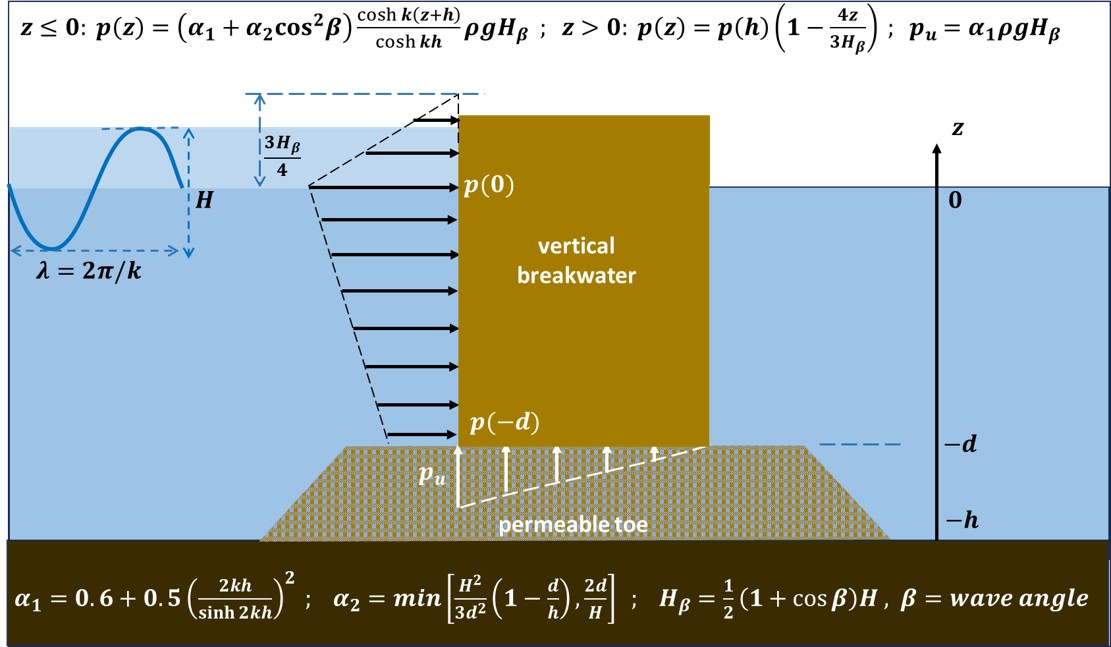
| 11:36, 29 May 2025 | ShorewardWaveLoadBreakwater.jpg (file) |  |
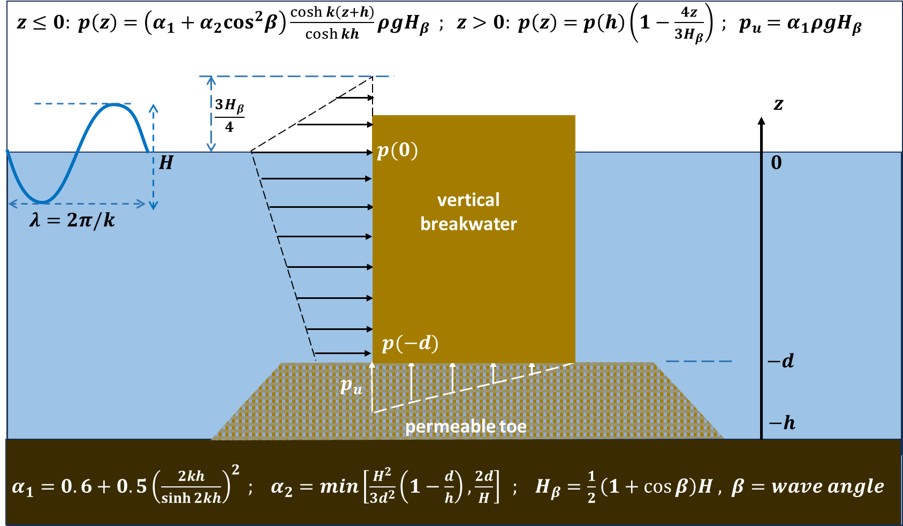
109 KB | Dronkers J | Goda’s formula for shoreward wave pressure loading on a vertical breakwater<ref>Goda, Y. 1974. A new method of wave pressure calculation for the design of composite breakwater. In Proceedings of the 14th Conference on Coastal Engineering. ASCE, pp. 1... | 1 |
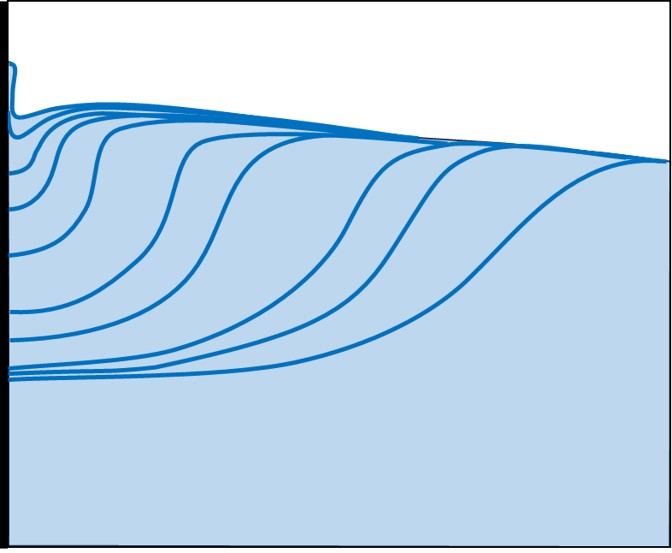
| 15:26, 12 May 2025 | FlipThrough.jpg (file) |  |
40 KB | Dronkers J | Successive profiles (from right to left) of a wave approaching a wall, illustrating wave front steepening, rapid squeezing, filling of the wave trough and generation of a jet climbing the rigid wall. Redrawn after Peregrine (2003<ref>Peregrine, D. 2003... | 1 |
| 15:19, 12 May 2025 | WaveLoadBreakwater.jpg (file) |  |
81 KB | Dronkers J | Goda’s formula for wave pressure loading on a vertical breakwater<ref>Goda, Y. 1974. A new method of wave pressure calculation for the design of composite breakwater. In Proceedings of the 14th Conference on Coastal Engineering. ASCE, pp. 1702–1720... | 1 |
| 21:26, 8 May 2025 | TanhBayScheme.jpg (file) |  |
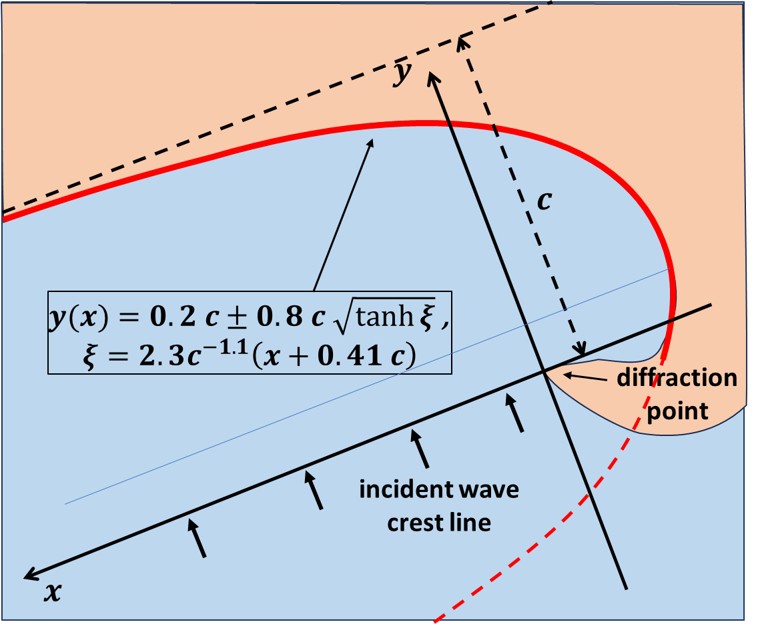
72 KB | Dronkers J | Sketch and symbols of the hyperbolic tangent representation of a headland bay. | 1 |
| 21:25, 8 May 2025 | ParabolicBayScheme.jpg (file) |  |
46 KB | Dronkers J | Sketch and symbols for the parabolic headland bay. | 1 |
| 21:24, 8 May 2025 | Logspiral.jpg (file) |  |
48 KB | Dronkers J | Sketch and symbols for the logspiral plan shape formula. | 1 |
| 19:11, 6 May 2025 | BeachClassification.jpg (file) |  |
47 KB | Dronkers J | Beach morphologies according to the parameters Ω and RTR, based on beach surveys in England, Wales, Northern Ireland and Australia. Reflective beaches are found in the red zone and dissipative beaches in the blue zone. | 1 |
| 12:38, 4 May 2025 | BangladeshGWsal.jpg (file) |  |
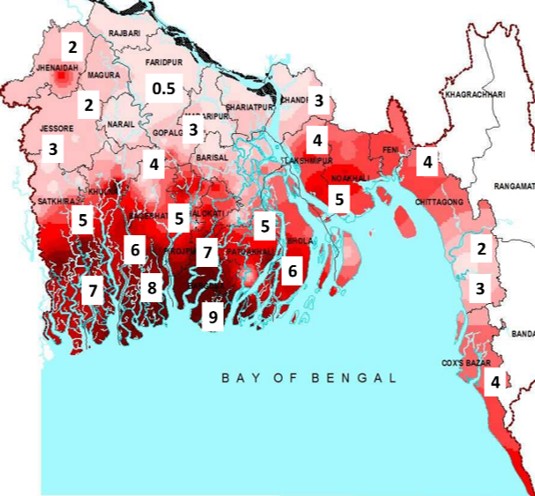
73 KB | Dronkers J | Bangladesh groundwater salinity (PSU) at 34 m below soil surface. Figure adapted from badc.portal.gov.bd. (2010). | 1 |
| 12:40, 2 May 2025 | WaveSetupGroundwaterflow.jpg (file) |  |
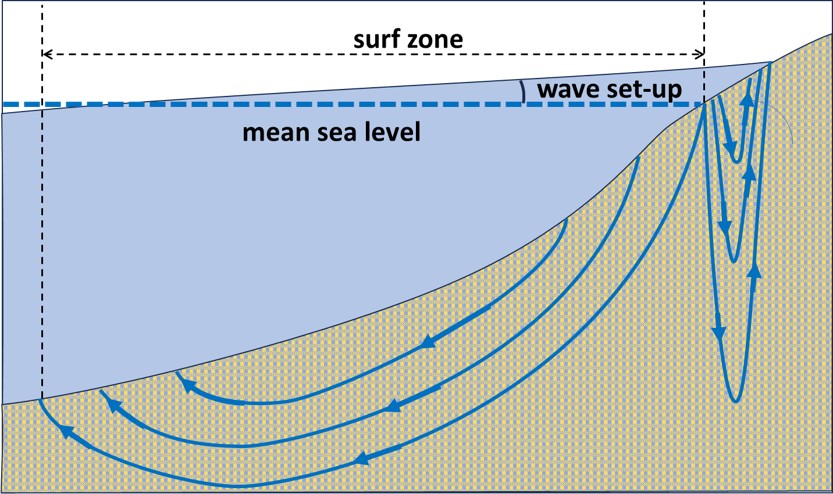
130 KB | Dronkers J | Groundwater flow pattern induced by wave set-up according to a theoretical model of Massel (2001). | 1 |
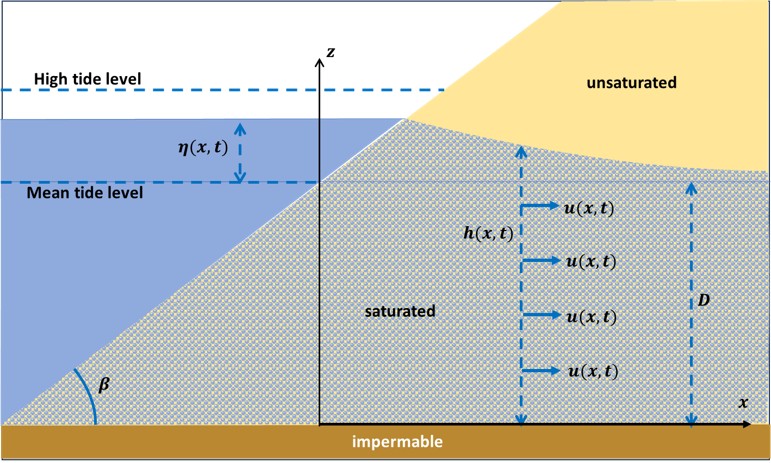
| 22:08, 1 May 2025 | DefSketchBeachWaterTable.jpg (file) |  |
119 KB | Dronkers J | Definition sketch of beach water table dynamics. | 1 |
| 19:07, 23 April 2025 | SandMotor10.jpg (file) |  |
188 KB | Dronkers J | The evolution of the 21 million m3 ‘sandmotor’ nourishment on the Dutch coast from 2011 (initial state) to 2021. During this period about 10% of the sand was lost, 10% was spread to the north (dominant littoral drift direction) and 5% to the south.... | 1 |
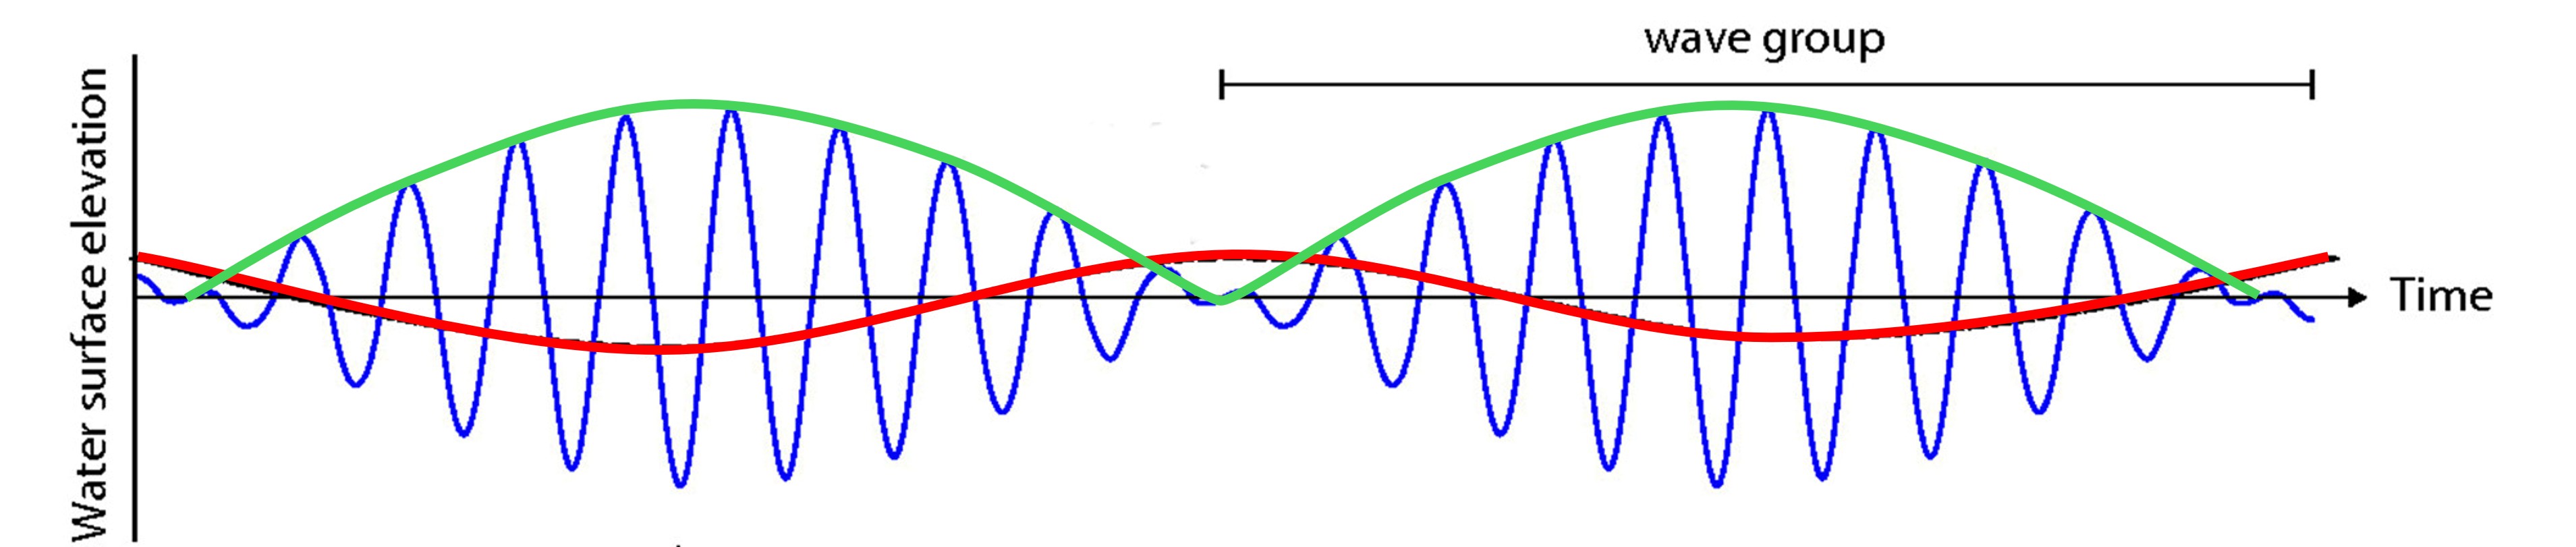
| 11:06, 21 April 2025 | WaveGroupDef.jpg (file) | 291 KB | Dronkers J | Wave group envelope (green) and infragravity wave (red). | 1 | |
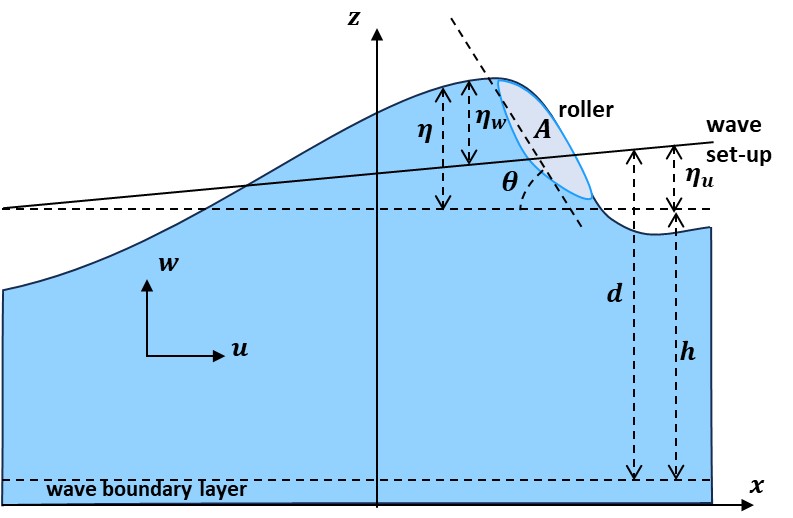
| 16:12, 17 April 2025 | SetUpSymbols.jpg (file) |  |
53 KB | Dronkers J | Definition sketch for the wave set-up balance equations. | 2 |