File list
This special page shows all uploaded files.
| Date | Name | Thumbnail | Size | User | Description | Versions |
|---|---|---|---|---|---|---|
| 11:32, 26 April 2007 | Transmission parameters.jpg (file) | 81 KB | Tvrl-hha | 1 | ||
| 11:32, 26 April 2007 | Contour line.jpg (file) |  |
101 KB | Tvrl-hha | 1 | |
| 11:31, 26 April 2007 | Oneline cell.jpg (file) |  |
102 KB | Tvrl-hha | 1 | |
| 11:31, 26 April 2007 | Oneline profiles.jpg (file) |  |
70 KB | Tvrl-hha | 1 | |
| 10:28, 24 April 2007 | Image7.png (file) |  |
445 bytes | Villars | 1 | |
| 10:27, 24 April 2007 | Image6.png (file) |  |
247 bytes | Villars | 1 | |
| 10:06, 24 April 2007 | Image5.png (file) |  |
748 bytes | Villars | 1 | |
| 09:39, 24 April 2007 | Exchange fluxes with mixing.PNG (file) |  |
14 KB | Francoishissel | 1 | |
| 09:39, 24 April 2007 | Exchange fluxes for sharp interface.PNG (file) |  |
10 KB | Francoishissel | 1 | |
| 09:40, 23 April 2007 | Image1.png (file) |  |
288 bytes | Villars | 1 | |
| 10:58, 16 April 2007 | Marchio scritta 72 piccolo.jpg (file) |  |
23 KB | E.roccatagliata | 1 | |
| 16:45, 13 April 2007 | Sfcr.jpg (file) |  |
972 KB | Falques | 1 | |
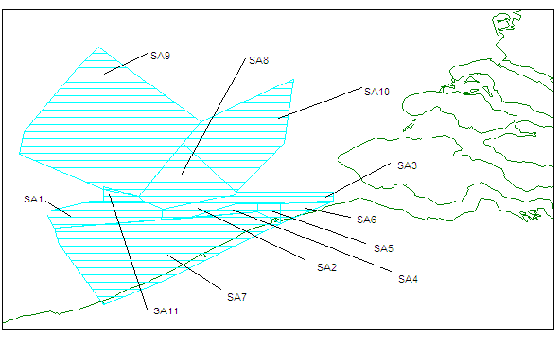
| 13:45, 12 April 2007 | Definition of subareas.PNG (file) |  |
12 KB | Francoishissel | 1 | |
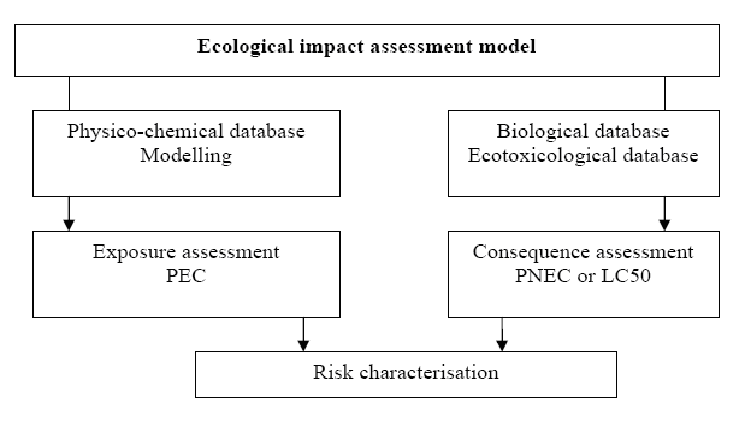
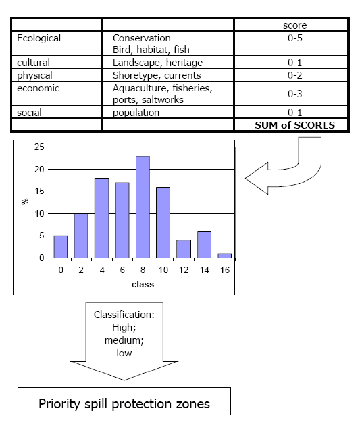
| 13:45, 12 April 2007 | Ecological impact assessment model.PNG (file) |  |
20 KB | Francoishissel | 1 | |
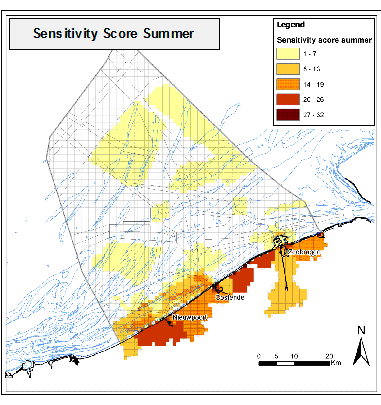
| 13:44, 12 April 2007 | Sensitivity score map.PNG (file) |  |
40 KB | Francoishissel | 1 | |
| 13:43, 12 April 2007 | Sensitivity analysis methodology.PNG (file) |  |
13 KB | Francoishissel | 1 | |
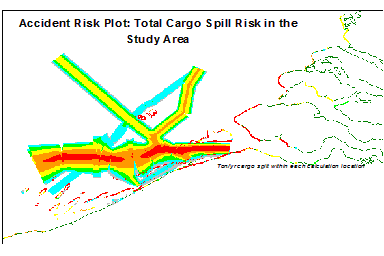
| 13:43, 12 April 2007 | Cargo spill risk in BPNS.PNG (file) |  |
10 KB | Francoishissel | 1 | |
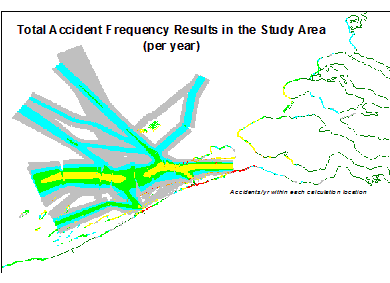
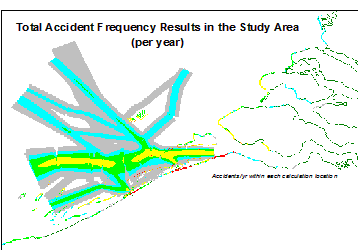
| 13:43, 12 April 2007 | Accident Frequency in BPNS2.PNG (file) |  |
12 KB | Francoishissel | 1 | |
| 13:42, 12 April 2007 | Accident Frequency in BPNS.PNG (file) |  |
10 KB | Francoishissel | 1 | |
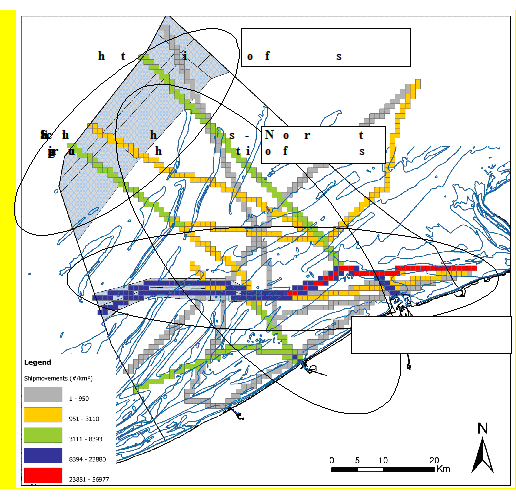
| 13:42, 12 April 2007 | Ship movements in BPNS.PNG (file) |  |
54 KB | Francoishissel | 1 | |
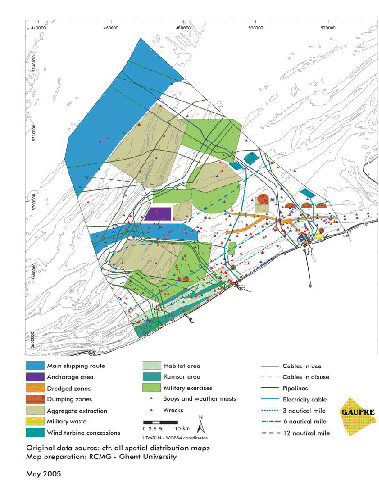
| 13:42, 12 April 2007 | Users of the Belgian Part of the North Sea.PNG (file) |  |
65 KB | Francoishissel | 1 | |
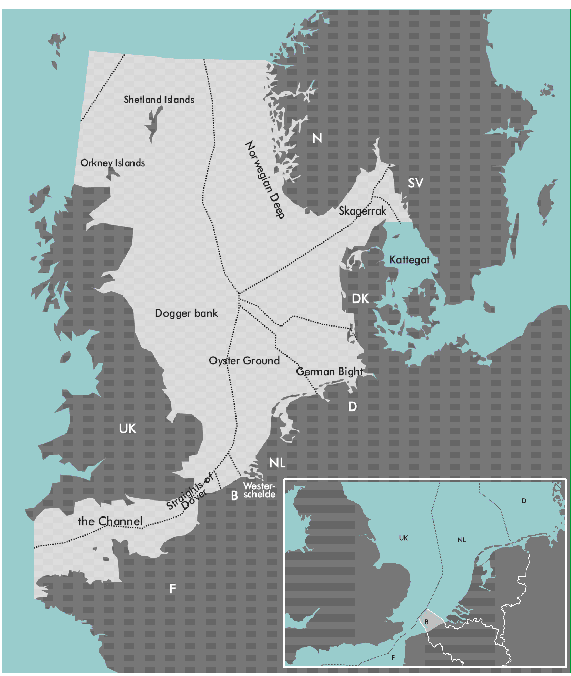
| 13:41, 12 April 2007 | Belgium Part of the North Sea.PNG (file) |  |
48 KB | Francoishissel | 1 | |
| 11:02, 12 April 2007 | Image013.JPG (file) |  |
15 KB | Jan van de Graaff | 3 | |
| 10:46, 12 April 2007 | Image012.JPG (file) |  |
11 KB | Jan van de Graaff | 1 | |
| 10:39, 12 April 2007 | Image011.JPG (file) |  |
18 KB | Jan van de Graaff | 1 | |
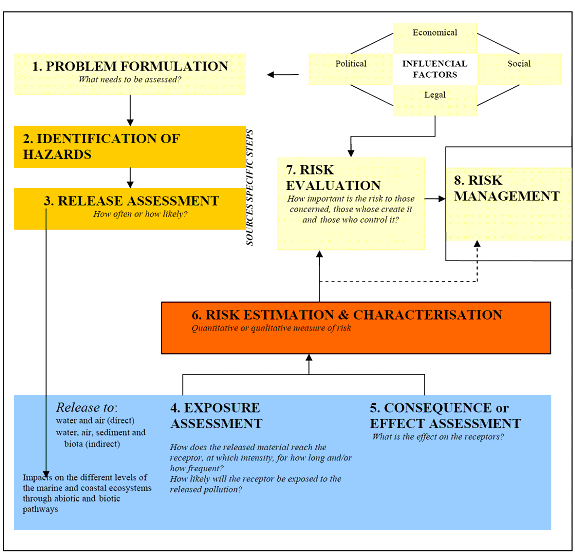
| 10:03, 12 April 2007 | Key tasks in environmental risk assessment.PNG (file) |  |
40 KB | Francoishissel | 1 | |
| 01:47, 10 April 2007 | Zacharias.jpg (file) |  |
415 KB | Caitlin | 2 | |
| 01:45, 10 April 2007 | Biodiversity elements2.jpg (file) |  |
140 KB | Caitlin | 2 | |
| 13:46, 6 April 2007 | Sectionlong.JPG (file) |  |
21 KB | Sergent | 1 | |
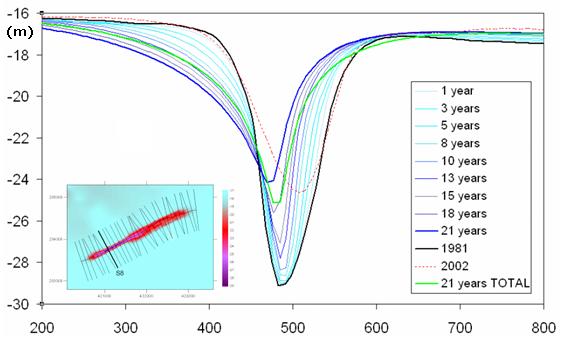
| 13:43, 6 April 2007 | Section8.JPG (file) |  |
30 KB | Sergent | 1 | |
| 11:12, 6 April 2007 | Current.JPG (file) |  |
23 KB | Sergent | 1 | |
| 10:35, 6 April 2007 | Wave.JPG (file) |  |
35 KB | Sergent | 1 | |
| 10:11, 6 April 2007 | Climate.JPG (file) |  |
17 KB | Sergent | 1 | |
| 15:17, 5 April 2007 | Banner.jpg (file) | 11 KB | Juliettejackson | 1 | ||
| 15:02, 5 April 2007 | BODC.gif (file) |  |
43 bytes | Juliettejackson | 1 | |
| 14:58, 5 April 2007 | Pol logo50.gif (file) | 2 KB | Juliettejackson | 1 | ||
| 14:58, 5 April 2007 | Cobs.gif (file) | 14 KB | Juliettejackson | 1 | ||
| 14:54, 5 April 2007 | Channel coastal obs logo.gif (file) | 3 KB | Juliettejackson | 1 | ||
| 15:44, 4 April 2007 | Application5.png (file) |  |
22 KB | Cohen | MCL position and volume at JARKUS transect 3775 from JARKUS data and assimilation model. | 1 |
| 15:44, 4 April 2007 | Application4.png (file) |  |
235 KB | Cohen | Argus timestack image of the DELILAH experiment showing the cross-shore location of the run-up edge. | 1 |
| 15:43, 4 April 2007 | Application3.png (file) |  |
44 KB | Cohen | Subtidal bathymetry derived from Argus images compared with a surveyed bathymetry in May 2000 and September 2000. | 1 |
| 15:42, 4 April 2007 | Application2.png (file) |  |
160 KB | Cohen | Intertidal bathymetry at Egmond aan Zee derived from Argus images. Volume changes are shown in two cross-shore arrays 400 m from the cameras to the north and south respectively. | 1 |
| 15:42, 4 April 2007 | Application1.png (file) |  |
111 KB | Cohen | Coastline changes derived from Argus images in Barcelona between November and December 2002. | 1 |
| 15:40, 4 April 2007 | Truc Vert5.jpg (file) |  |
193 KB | Falques | 1 | |
| 15:29, 4 April 2007 | TableTools.png (file) |  |
49 KB | Cohen | table with Argus analysis tools | 1 |
| 15:20, 4 April 2007 | Amur.jpg (file) |  |
176 KB | Falques | 1 | |
| 15:01, 4 April 2007 | MergeEgmond.png (file) |  |
122 KB | Cohen | Argus merged image of Egmond aan Zee | 1 |
| 14:55, 4 April 2007 | ImageVSrealworld.png (file) |  |
20 KB | Cohen | Relation between image (u,v) and real world (x,y,z) co-ordinates | 1 |
| 14:55, 4 April 2007 | Equation4.png (file) |  |
12 KB | Cohen | Argus Equation4 | 1 |
| 14:55, 4 April 2007 | Equation3.png (file) |  |
23 KB | Cohen | Argus Equation3 | 1 |