Difference between revisions of "Baltic Sea"
| Line 67: | Line 67: | ||
===Eutrophication=== | ===Eutrophication=== | ||
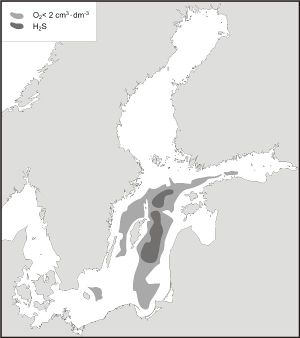
| − | From drainage area populated by over 80 millions people<ref>http://en.wikipedia.org/wiki/Baltic_Sea#Land_use</ref> Baltic Sea receive load of phosphorus as high as 32,9*10<sup>3</sup>[t*y<sup>-1</sup>] and 661,8*10<sup>3</sup>[t*y<sup>-1</sup>] of nitrogen (means for decade 1994-2004) <ref>HELCOM Indicator Fact Sheets 2005. Online. http://www.helcom.fi/environment2/ifs/en_GB/cover/</ref>. [[Image:pustynie tlenowe-1.jpg|thumb|right|Figure 6: Oxygen depleted and anoxic zones at the bottom]] These loads shows generally decreasing trends but in Baltic Proper and Gulf of Bothnia were still increasing while in other parts decreased | + | From drainage area populated by over 80 millions people<ref>http://en.wikipedia.org/wiki/Baltic_Sea#Land_use</ref> Baltic Sea receive load of phosphorus as high as 32,9*10<sup>3</sup>[t*y<sup>-1</sup>] and 661,8*10<sup>3</sup>[t*y<sup>-1</sup>] of nitrogen (means for decade 1994-2004) <ref>HELCOM Indicator Fact Sheets 2005. Online. http://www.helcom.fi/environment2/ifs/en_GB/cover/</ref>. [[Image:pustynie tlenowe-1.jpg|thumb|right|Figure 6: Oxygen depleted and anoxic zones at the bottom]] These loads shows generally decreasing trends but in Baltic Proper and Gulf of Bothnia were still increasing while in other parts decreased. High waterborne nutrient load (4kg phosphorus and 83kg nitrogen per capita) results in high winter concentrations in water column - >15μg*dm<sup>-3</sup> inorganic phosphorus and >60μg*dm<sup>-3</sup> inorganic nitrogen in prevailing area of the sea only in Gulf of Finland and some coastal zones these values are higher <ref>The Baltic Marine Environment 1999-2002. 2003. Baltic Sea Environment Proceedings No. 87, pp. 1-47 (http://meeting.helcom.fi/c/document_library/get_file? _l_id=79889&folderId=377779&name=DLFE-36818.pdf</ref>. Excess of nutrients cause beside spring and autumnal primary producers blooms (mainly diatoms), summer ones dominated by cyanobacteria and dinoflagellates (causing sometime “red tides”). High and rapid biomass production results in high flux not consumed organic carbon fall passing by lid of halocline and in decomposition processes cause oxygen depleted “death zones” - currently covering about 25% of total area of Baltic Sea bottom<ref>Bonsdorff, E., C. Ronnberg & K. Arnio, 2002, Some ecological properties in relation to eutrophication in the Baltic Sea. Hydrobiologia 475/476, pp 371-377</ref> (Fig. 6). |
| − | More visible – for | + | More visible – for sea shore visitors – is eutrophication effect in the coastal zone. Here apart cyanobacterial and red tides massive development of filamentous algae – mainly Ectocarpaceae – forms awfully looking algal mats, in late phase of development floating and finally ending at the shore or at the bottom covering all living organisms competing for oxygen during decomposition. |
| + | |||
Revision as of 16:22, 26 April 2009
Contents
Local environment
Definition and basic facts
| Parameter | Measure |
|---|---|
| Area | 415 000km2 |
| Length | 1300 km |
| Width | 1200km |
| Maximum depth | 459m |
| Sill depth | 17m |
| Residence time of water | 25yr |
Stratification and circulation
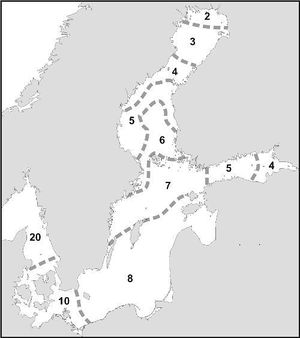
Restricted connection with open seas, together with high riverine inflow, results in something like backwater effect of water in the whole basin – In Gulf of Bothnia water level is 36cm higher than in North Sea, in middle part of Baltic Proper by 18 and in Kattegat by 10cm. This generate strong current in Sound system. Inversely enters weaker (roughly twofold) current bearing saline (<34PSU) waters from North Sea. Such balance of fresh vs. Saline waters – characteristic for estuaries – cause permanent strong salinity gradient. At entrance – in Kattegat – salinity of surface waters is around 20PSU but in Bornholm Basin decrease to 8PSU and even lower at North and East periphery (Fig.2). This estuarial feature is expressed also in vertical stratification of the water column and permanent halocline is present along whole Baltic Sea, it is located at 40-60m at Western end and 60-80 at Northern part. As an effect of such stratification is existence of two types of water masses – relatively light freshened surface – and heavier more salty deep waters.
Coasts
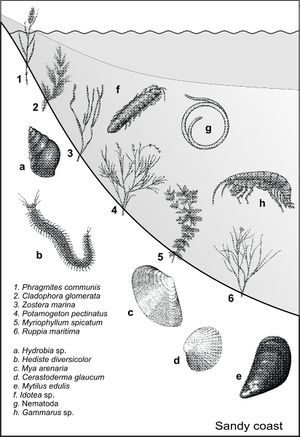
Southern part of the Baltic Sea is fringed mainly by coasts built of sedimentary material – leftovers after glacial time. Composed mainly of sand, are vulnerable to mechanical stress of wind and wave action and due to its mobility is not conducive to seaweeds and vascular plant development, also only infaunal or meibenthic animals can endure here (Fig.3). Coastline here is rather straight and exposed, only in estuaries or supports shelters for flora .
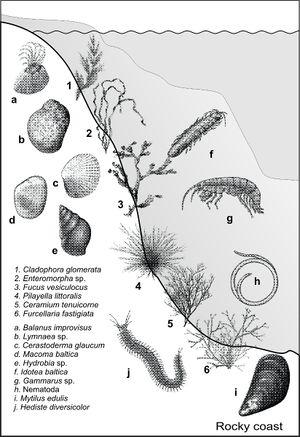
In contrast Northern and North-East Baltic (partly Gulf of Finland, and Bothnia and Swedish coast) are mainly composed of rocky substratum, shoreline is well developed with fiords, coves and archipelagos - superb shelter for vegetation and associated fauna (Fig.4).
Primary production
Characteristic feature of primary production in Baltic Sea is its seasonality and spatial variability. Spring bloom – main pulse of new organic matter in higher latitudes starts in February March in Westernmost while in Northern part, in May. Annual primary production vary from 500 [gC*y-1 *m-2] in Danish fjords to [50 gC*y-1 *m-2] in open waters of Western part of Baltic Proper (Rydberget al. 2006 [3]) in Gulf of Gdańsk annual primary production is as high as ~200[gC*m-2y-1] (Lorentz et al. 1991[4]) and well below 100[gC*m-2y-1] in Northern part of the Sea (Kangas et al. 1993,[5]). This decreasing trend reflects both salinity and climatic gradients. Characteristic feature for Baltic is third - Summer bloom of Cyanobacteria - in addition to typical for temperate seas Autumnal bloom.
Specific biodiversity issues
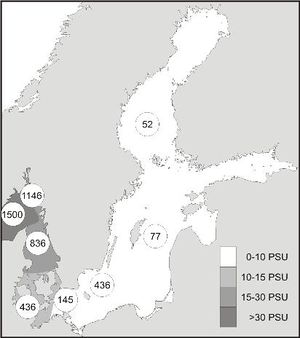
The marine–brackish–limnic conditions in the area established about 8000 years, and the current regime in terms of salinity and basic climatological conditions (covering six zones, from the temperate to the subarctic) is about 3000 years old (Bonsdorff 2006[2]. In compare with other similar seas , due to its brackish characteristic, Baltic Sea is inhabited by animals, protists and plants representing relatively lesser number of taxa, but sometime represented by many individuals. While most diverse marine ecosystems consists of 800 taxa of macrofauna per 10 m2 - in Baltic one can expect no more than 30 taxa. But from other side, the flora and fauna of the Baltic is unusual in that there are areas in which freshwater, brackish water and marine species co-exist. For example, the freshwater plant - common reed (Phragmites australis) and the marine wrack (Fucus vesiculosus) can be found side by side or fresh water species of phytoplankton exists beside “fully marine” ones (~20 marine, 20 fresh and 30 brackish water). Biodiversity follows differences of environmental factors (see above) in different part of the Baltic Sea. In Skagerrak, where a water salinity is as high as 30 PSU, some 1500 marine animal species and 154 seaweeds live. But in so far proximity - in the southern part - where salinity is much lower (10 PSU) only ~ 150 animal and less than 50 benthic alga species can be found (Kautsky et al., 1990.[6])
Threats
Eutrophication
From drainage area populated by over 80 millions people[7] Baltic Sea receive load of phosphorus as high as 32,9*103[t*y-1] and 661,8*103[t*y-1] of nitrogen (means for decade 1994-2004) [8]. These loads shows generally decreasing trends but in Baltic Proper and Gulf of Bothnia were still increasing while in other parts decreased. High waterborne nutrient load (4kg phosphorus and 83kg nitrogen per capita) results in high winter concentrations in water column - >15μg*dm-3 inorganic phosphorus and >60μg*dm-3 inorganic nitrogen in prevailing area of the sea only in Gulf of Finland and some coastal zones these values are higher [9]. Excess of nutrients cause beside spring and autumnal primary producers blooms (mainly diatoms), summer ones dominated by cyanobacteria and dinoflagellates (causing sometime “red tides”). High and rapid biomass production results in high flux not consumed organic carbon fall passing by lid of halocline and in decomposition processes cause oxygen depleted “death zones” - currently covering about 25% of total area of Baltic Sea bottom[10] (Fig. 6).More visible – for sea shore visitors – is eutrophication effect in the coastal zone. Here apart cyanobacterial and red tides massive development of filamentous algae – mainly Ectocarpaceae – forms awfully looking algal mats, in late phase of development floating and finally ending at the shore or at the bottom covering all living organisms competing for oxygen during decomposition.
References
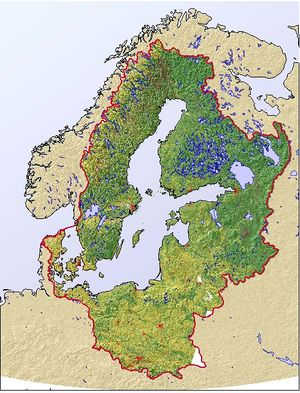
- ↑ http://maps.grida.no/go/graphic/land_cover_baltic_sea_region_ balans
- ↑ 2.0 2.1 Bonsdorff, E., C. Ronnberg & K. Arnio, 2002, Some ecological properties in relation to eutrophication in the Baltic Sea. Hydrobiologia 475/476, pp 371-377 Cite error: Invalid
<ref>tag; name "Bonsdorff" defined multiple times with different content - ↑ Rydberg. L, G. Ærtebjerg , L. Edler .2006. Fifty years of primary production measurements in the Baltic entrance region, trends and variability in relation to land-based input of nutrients. Journal of Sea Research 56, pp.1–16
- ↑ Lorenz Z, J. Nakonieczny, S. Ochocki, H.Renk. 1991. Primary Production and Chlorophyll in the Gulf of Gdansk in 1987-1988. Acta Ichtyologica Et Piscatoria Vol. XXI Supplement pp. 117-124
- ↑ Kangas, P., Alasaarela, E., Lax, H.-G., Jokela, S., C., Storgård-Envall. 1993. Seasonal variation of primary production and nutrient concentrations in the coastal waters of the Bothnian Bay and the Quark. Aqua Fennica, Vol. ( 2) . pp. 165-176
- ↑ Kautsky H., Eddy van der Maarel. 1990. Multivariate approaches to the variation in phytobenthic communities and environmental vectors in the Baltic Sea. Mar. Ecol. Prog. Ser. 60: pp.169-184
- ↑ http://en.wikipedia.org/wiki/Baltic_Sea#Land_use
- ↑ HELCOM Indicator Fact Sheets 2005. Online. http://www.helcom.fi/environment2/ifs/en_GB/cover/
- ↑ The Baltic Marine Environment 1999-2002. 2003. Baltic Sea Environment Proceedings No. 87, pp. 1-47 (http://meeting.helcom.fi/c/document_library/get_file? _l_id=79889&folderId=377779&name=DLFE-36818.pdf
- ↑ Bonsdorff, E., C. Ronnberg & K. Arnio, 2002, Some ecological properties in relation to eutrophication in the Baltic Sea. Hydrobiologia 475/476, pp 371-377
See also
- Baltic Marine Environment Protection Commission (Helsinki Convention)
- An exercise in comparing the pelagic and benthic macrofauna species diversity in Arctic, Antarctic and Baltic sites using the taxonomic distinctiveness index [1]
- Values of, and threats to, marine and coastal habitats in the southern Baltic [2]
- Shallow sandy sublittoral: the ecological treasure of the southern Baltic Sea [3]
- Daily sea surface temperatures rom the late 1800s to the early 2000s implications for biodiversity in the Baltic Sea [4]
- Application of benthic indices to assess biodiversity in the southern Baltic Sea [5]
Please note that others may also have edited the contents of this article.
|
