Difference between revisions of "Testpage5"
(→Characteristic shear stresses) |
(→Characteristic shear stresses) |
||
| Line 295: | Line 295: | ||
The deposition stress <math>\tau_d</math> is based on the relationship | The deposition stress <math>\tau_d</math> is based on the relationship | ||
| − | <math>{{\tau }_{d}}={{\tau }_{{{d}_{p}}}}\sqrt{d_f | + | <math>{{\tau }_{d}}={{\tau }_{{{d}_{p}}}}\sqrt{\frac{d_f}{d_p}}\qquad (38)</math> |
as proposed by Mehta and Letter<ref name=ML13></ref> based on flume data of Mehta and Lott<ref name=ML87> Mehta, A.J., Lott, J.W. (1987). Sorting of fine sediment during deposition. Pro¬ceedings of Coastal Sediments’87, ed. Kraus, N. C., ASCE, 348-362.</ref> for kaolinite deposition with <math>\tau_{d_p} = 4.29 \times 10^{-3},</math> and <math>d_p = 0.1 \mu m</math>. The equation line is conveniently selected to intersect the junction of Eqs. (33) and (37), although in reality intersection can vary somewhat from its value at the junction depending on clay mineral composition. | as proposed by Mehta and Letter<ref name=ML13></ref> based on flume data of Mehta and Lott<ref name=ML87> Mehta, A.J., Lott, J.W. (1987). Sorting of fine sediment during deposition. Pro¬ceedings of Coastal Sediments’87, ed. Kraus, N. C., ASCE, 348-362.</ref> for kaolinite deposition with <math>\tau_{d_p} = 4.29 \times 10^{-3},</math> and <math>d_p = 0.1 \mu m</math>. The equation line is conveniently selected to intersect the junction of Eqs. (33) and (37), although in reality intersection can vary somewhat from its value at the junction depending on clay mineral composition. | ||
Revision as of 21:33, 26 October 2016
Sediment Deposition and Erosion Processes
This article presents a brief review of estuarine sediment deposition and erosion processes.
Contents
Introduction
Deposition and erosion are the two basic processes inherent to the movement of sedimentary particles in estuaries. As these processes determine the advective sediment load, understanding their mechanics is essential for load prediction. To begin with prevalent classifications related to particle diameter are summarized on a comparative basis. Estuarine sediment usually includes a continuous distribution of diameter from coarse-grained, commonly sand, to fine-grained including silt, clays and colloids. It is therefore useful to review coarse and fine sediment properties and transport behaviors in tandem. The definition of particle size related to settling velocity is introduced in the context of cohesionless particles as well as cohesive particles present as flocs. A separate description is given for the settling velocity of flocs as their diameter and density depend on particle concentration and flow turbulence. The basis of deposition and erosion is described in terms of commonly used mass flux functions. Simple analytical methods for sediment load are referenced, and for cohesive flocs the significance of fluid mud is illustrated in terms of its entrainment potential.
Classification
In Table 1 five classifications based on particle properties and empirically related to diameter are given. The diameters range from 10 mm for sand (for which the upper limit is 64 mm) down to 0.001 μm (1 nm) for colloidal particles. In between are silt and clay particles. Designations such as sand/silt, etc. refer to boundary diameters. In regard to particle type, only suspended particles which settle in a reasonable period of time are classified as sedimentary. Thus colloidal particles do not constitute sediment. However, as clay particles in the range of 1 to 0.1 μm are often found in flocs they are conveniently designated as sedimentary as well as colloidal.
In soil, only clay minerals possess electrochemical cohesion. The median diameter of the size distribution is typically in the range of 1-2 μm and the spread is about 0.1 to 10 μm, which does not match the soil-based classification in Table 1. This is because soil is conventionally classified by plasticity (not cohesion) as coarse-grained and fine-grained with a break at 62.5 μm at the sand/silt boundary.
The mean threshold diameter [math]d_T[/math]of about 10 μm separating cohesive particles and larger cohesionless particles has been deduced from the experiments of Migniot[1] on the settling of twenty-seven fine-grained sediments (natural and clay minerals) and a compilation of data by McCave et al.[2] on the erosion of beds of kaolinite flocs and fine-grained quartz (< 62.5 μm) particles. Phenomenological arguments (Mehta and Letter [3]) suggest that [math]d_T[/math] may be related to the physicochemical properties of clays in water yielding
[math]{{d}_{T}}=\sqrt{\frac{{{A}_{H}}{{\lambda }_{T}}}{4\pi g\Delta {{\rho }_{s}}\delta _{\kappa }^{2}}} \qquad(1)[/math]
where [math]A_H[/math] is the Hamaker constant characterizing ionic interaction between the particles, [math]\lambda_T[/math] represents the ratio of floc-scale electrochemical cohesion to the van der Waals attraction between clay particles, [math]g[/math] is the acceleration due to gravity, [math]\Delta \rho_s= \rho_s-\rho_w[/math] is the excess material density of particles, [math]\rho_s[/math] is the material density, [math]\rho_w[/math] is the water density and [math]\delta_{\kappa}[/math] is the thickness of the ionic double layer surrounding the clay particle (van Olphen[4]). For clay minerals in water, nominal values of [math]\Delta \rho_s= 1,650 \; kg m^{-3}, \delta_{\kappa} = 4 \times 10^{-8} \; m, A_H = 10^{-20} \; N m[/math] and [math]\lambda_T = 3.25[/math] are consistent with [math]d_T = 10 \; \mu m[/math].
Flocs contain multiple mineral particles of generally much smaller diameters (van Olphen[4]). They are watery with buoyant weights much lower than that of the mineral, which typically has a wet bulk density in the vicinity of [math]2,650\; kg m^{-3}[/math]. Flocs larger than about 100 μm are notionally called macroflocs and those smaller microflocs (e.g. Eisma[5]). Microflocs smaller than about 1 μm are generally not of direct major interest to sedimentation engineering. Natural flocs almost always contain organic detritus in variable proportions from practically nil to 100% by weight. Their light weight and biochemical bonding they provide can substantially influence floc properties (e.g. Gerbersdorf et al. [6]).
An important statement inherent in Table 1 is that, based on the mineral particle diameter, coarse-grained sediment transport formulas are applicable down to 10 μm (not 62.5 μm). Below this diameter cohesive sediment formulas must be used.
Particle Diameter Determination
Diameter definition
Particle size is conventionally defined by the nominal diameter, i.e., the diameter of a sphere having the same fall or settling velocity [math]{w}_{s}[/math] as that of the real particle in water formally at [math]20^{\circ}C[/math]. Most commonly the nominal diameter is the fall diameter obtained by measuring [math]{w}_{s}[/math] in quiescent water.
Cohesionless particles

For cohesionless particles the diameter [math]d_p[/math] is related to [math]w_s[/math] by the general form of Stokes law
[math]{{d}_{p}}=\frac{3{{C}_{D}}(\operatorname{Re}){{\rho }_{w}}w_{s}^{2}}{4g\Delta {{\rho }_{s}}}, \qquad(2)[/math]
where [math]C_D(\operatorname{Re})[/math] is the drag coefficient, a function of the fall Reynolds number [math]\operatorname{Re}[/math] defined as
[math]\operatorname{Re}=\frac{{{\rho }_{w}}{{w}_{s}}{{d}_{p}}}{\eta }, \qquad(3)[/math]
with [math]\eta[/math] the dynamic viscosity of water (Julien[8]). When the flow surrounding the falling particle is viscosity-dominated [math](\operatorname{Re} \le 0.1) \; C_D = 24/\operatorname{Re}[/math], so Eq. (2) becomes
[math]{{d}_{p}}=\sqrt{\frac{18\eta {{w}_{s}}}{g\Delta {{\rho }_{s}}}}. \qquad(4)[/math]
For quartz spheres in water at [math]20^{\circ}C \; (\rho_w = 1,000 \; kg m^{-3})[/math], Fig. 1 shows experiment-derived variation of [math]d_p[/math] with [math]w_s[/math] (Rouse[7]). In this case, for practical purposes the threshold value of [math]\operatorname{Re}[/math] is taken as 1, which means that Eq. (4) can be used to obtain [math]d_p[/math] from [math]w_s[/math] below this threshold, as determined by the line extending down to about 0.01 mm (10 μm). When [math]\operatorname{Re} \gt 1[/math] Eq. (4) underpredicts the diameter and Eq. (2) must be used with [math]C_D(\operatorname{Re})[/math] obtained from the experimentally based plot (not included) for particles of different shapes (see, e.g. Julien[8]). Note however that the quartz sphere curve is reasonably accurate for natural sand particles even though they are usually not quite spherical.
Cohesive flocs
Clay mineral particles nominally in the range of 10 to 0.1 μm are present in flocs. The floc diameter [math]d_f[/math] is determined by aggregation (processes) including floc growth and breakup. Floc growth depends on the particle-particle collision frequency which in turn is contingent upon the concentration of particles and the collision mechanism. Turbulent shear represented by the rate [math]G[/math] is the main collision mechanism in estuarine waters except during times close to slack water when collisions are promoted by flocs settling at different velocities and to a lesser extent by Brownian diffusion (Winterwerp and van Kesteren[10]). Note that Brownian diffusion does play an important role in the aggregation of colloids, which can become large enough to be in the sedimentary size range (Mayer and Wells[11]). Shear produces strong flocs compared to the other two mechanisms and its role is manifested as dependence of floc diameter on the Kolmogorov micro-length scale of turbulent eddies (Liggett[12], Fugate and Friedrichs[13]). Floc breakup occurs when high-velocity collisions induce a stress that exceeds the shear strength of the floc, and in the absence of collisions by flow-induced shearing.
Whether the diameter [math]d_f[/math] increases or decreases with time [math]t[/math] is determined by the balance
[math]\frac{d}{dt} {{d}_{f}} = \text{rate}\ \text{of}\ \text{growth}\,\text{-}\,\text{rate}\ \text{of}\ \text{breakup}.\qquad(5)[/math]
Kranenburg [14] argued that clay flocs demonstrate fractal properties reasonably well, i.e. their structures are geometrically fairly similar, as defined by the fractal dimension [math]D[/math]. Under this assumption the above equation can be represented as (Winterwerp and van Kesteren[10])
[math]\frac{d}{dt} {{d}_{f}}=\ {{k}_{g}}{{\rho }_{s}}{{\phi }^{n}}Gd_{f}^{2}-\ {{k}_{b}}{{G}^{3/2}}d_{f}^{2}({{d}_{f}}-{{d}_{p}}), \qquad (6)[/math]
in which [math]D[/math] is taken as 2, a typical mean value, [math]\phi= C/\rho_s[/math] is the solids volume fraction, [math]C[/math] is the sediment concentration (in units of, e.g., [math]kg m^{-3}[/math]) and [math]k_g[/math] and [math]k_b[/math] are sediment dependent growth and breakup coefficients, respectively, and [math]n[/math] embodies the intensity of aggregation as mentioned again later. Son and Hsu[15] proposed a modified form of Eq. (6) by relaxing the restriction that the floc yield strength and the fractal dimension are constant.
Starting with seed mineral particles, under conditions that promote growth, [math]d_f[/math] will increase and eventually reach an equilibrium value [math]d_{fe}[/math] when the growth and breakup rates become equal. In that case [math]d d_f /d t = 0 [/math] and from Eq. (6)
[math]{{d}_{fe}}=\frac{{{k}_{g}}}{{{k}_{b}}}\frac{{{\rho }_{s}}}{\sqrt{G}}{{\phi }^{n}} \qquad (7)[/math]
where we have assumed [math]d_p/d_{fe} \lt \lt 1[/math], which is typically reasonable. This relationship indicates that [math]d_{fe}[/math] varies with [math]{\phi}[/math] as well as [math]G[/math].
The wet bulk density [math]\rho_f[/math] of flocs is usually much lower than the material density[math] \rho_s[/math], hence and Stokes law [Eq. (4)] can be restated as
[math]{{d}_{f}}=\sqrt{\frac{18\eta {{w}_{s}}}{g\Delta {{\rho }_{f}}}} \qquad (8)[/math]
in which the diameter [math]d_{fe}[/math] is simply denoted as [math]d_f[/math] and [math]\Delta \rho_f = \rho_f - \rho_w[/math]is the excess floc density. From this and image-based measurements of [math]w_s[/math] and [math]d_f[/math] in a settling column [math]\Delta \rho_f[/math] can be calculated.
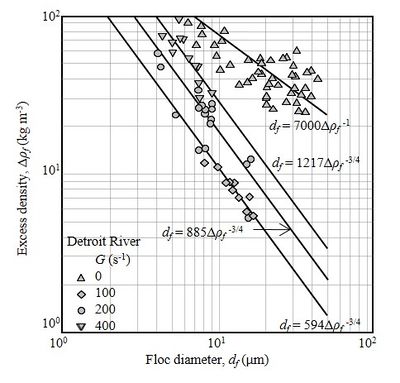
Very few sets of experimental data sets appear to be available in which [math]d_f[/math] is measured systematically over variable [math]G[/math] and [math]\phi[/math]. As observed from the laboratory data on sediment from the Detroit River in Fig. 2, as [math]d_f[/math] increases [math]\Delta \rho_f[/math] decreases and the flocs become increasingly porous (Lick[9]). These data were obtained in flocculators - a rotating cylinder flocculator in which the flocs grew due to shearing, and a disc flocculator in which they grew by differential settling ([math]G = 0[/math]). The mean trends from the rotating flocculator can be expressed roughly as
[math]{{d}_{f}}=\frac{A(G)}{\Delta \rho _{f}^{3/4}} \qquad (9)[/math]
with [math]A(G)[/math] values given in the plot. At a constant [math]\Delta \rho_f[/math], [math]d_f[/math] increases with [math]G[/math], which means that within the range of [math]G = 100-400 \; s^{-1}[/math] floc growth is promoted with increasing flow shear. As a rule, at such high shear rates ([math]G \gt 100 \; s^{-1}[/math]) breakup tends to dominate and scatters large flocs into smaller units (McAnally[16]). This suggests that the effective shear rate in the flocculator may have been substantially lower than the value calculated from the angular velocity of the rotating cylinder. The data from the disc flocculator indicate that large diameter flocs were produced in the absence of shear-induced aggregation. In this case the exponent of [math]\Delta \rho_f [/math] is, very approximately, [math]-1[/math] indicating a somewhat different trend than Eq. (9).
Settling Velocity
Cohesive flocs
To obtain the settling velocity of flocs, Eq. (2) may be restated as
[math]{{w}_{s}}=\sqrt{\frac{4g\Delta {{\rho }_{f}}{{d}_{f}}}{3{{\rho }_{w}}{{C}_{D}}(\operatorname{Re})}}. \qquad (10) [/math]
For fractal flocs, mass balance dictates that (Kranenburg[14])
[math]\Delta {{\rho }_{f}}=\Delta {{\rho }_{s}}{{\left( d_f / d_p \right)}^{D-3}}. \qquad (11)[/math]
From Eqs. (10) and (11)
[math]{{w}_{s}}=\frac{ g \Delta { {\rho }_{s} } } {{18\eta (1+X) } d_{p}^{D-3}} d_{f}^{D-1}, \qquad (12)[/math]
which includes the substitution
[math]{{C}_{D}}=\frac{24(1+X)}{\operatorname{Re}}, \qquad (13)[/math]
where the correction factor [math]X[/math] permits an extension of Stokes law to [math]\operatorname{Re}[/math] well above [math]1[/math]. Winterwerp[17] selected [math]X = 0.15 \operatorname{Re}^{0.687}[/math], which is valid up to [math]\operatorname{Re} \lt 800[/math].
A restriction on Eq. (12) is that it is applicable to settling under quiescent conditions only. In order to account for the effect of flow shear Eqs. (7), (8) and (10) are combined to yield
[math]{{w}_{s}}=a(G){{\phi }^{n}}, \qquad (14)[/math]
where
[math]a(G)=\frac{g{{\rho }_{s}}{{d}_{p}}\Delta {{\rho }_{s}}{{k}_{g}}}{18\eta {{k}_{b}}\sqrt{G}}, \qquad (15)[/math]
in which [math]k_g[/math] and [math]k_b[/math] can be functions of [math]G[/math]. As they are generally unknown, van Leussen[18] and others introduced the following expression revised from Eq. (14)
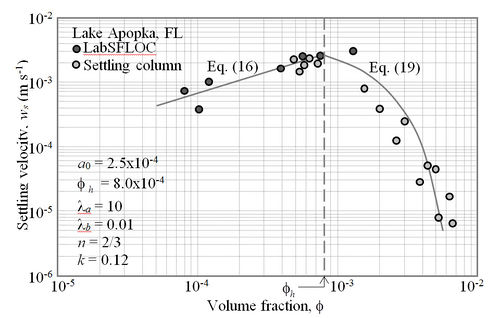
[math]{{w}_{s}}={{w}_{sh}}(G){{\left( \frac{\phi }{{{\phi }_{h}}} \right)}^{n}};\quad {{w}_{sh}}(G)={{a}_{0}}\left( \frac{1+{{\lambda }_{a}}G}{1+{{\lambda }_{b}}{{G}^{2}}} \right);\quad \frac{\phi }{{{\phi }_{h}}}\le 1 , \qquad (16)[/math]
where [math]w_{sh}(G)[/math] is the maximum settling velocity at the onset of hindered settling when the volume fraction is [math]\phi_h[/math], and the constants [math]a_0,\; n,\; \lambda_a, \; \lambda_b[/math] are independent of [math]G[/math]. This expression is valid in the range [math]\phi \le \phi_h[/math]. The lowest applicable value of [math]\phi[/math]can be conveniently selected to correspond to the lowest experimental concentration [math]C[/math] of suspended sediment.
Setting [math]G = 0[/math] yields
[math]{{w}_{s}}={{w}_{sh}}{{\left( \frac{\phi }{{{\phi }_{h}}} \right)}^{n}}. \qquad (17)[/math]
A similar formula was derived empirically by Krone[20] with values of [math]w_{sh}[/math] and [math]n[/math] independent of [math]G[/math] deduced from settling tests on the flocs of San Francisco Bay sediment in a graduated glass cylinder. It was shown that Eq. (17) is consistent with the kinetics of inter-particle collisions and aggregation during the settling of suspended flocs previously postulated by Overbeek[21], with [math]n = 4/3[/math].
Returning to Eq. (16), in Fig. 3 field-collected data from a station in the Tamar estuary (UK) are included for two tidal conditions – high spring and neap (Manning [19]) – using an apparatus consisting of two components – LabSFLOC (Manning[22]) and INSSEV (Manning and Dyer[23]), which together permit optical image-based measurements of the settling velocity and the diameter as flocs fall in a column. The apparatus is taken on board the vessel and measurements are made immediately upon retrieving a sample of suspension at the desired depth below water surface. The shear rate is calculated from
[math]G=\sqrt{\frac{{{\rho }_{w}}u_{*}^{3}}{\kappa \eta {{z}_{b}}}}, \qquad (18)[/math]
where [math]u_*[/math] is the known bed friction velocity, [math]\rho_w= 1,015 \; kg m^{-3},\; \kappa = 0.4[/math] is the von Karman constant, [math]\eta = 1.02 \times 10^{-3} \; Pa.s[/math] and [math]z_b = 0.25 \; m[/math] is the nominal near-bed elevation representing the sampling depth. Values of the coefficients for lines from Eq. (16) are [math]a_0 = 10^{-4}, \; \phi_h = 3.2 \times 10^{-3}, \; \lambda_a = 10, \; \lambda_b = 0.01, \; n = 1/3[/math]. The [math]n[/math] value is consistent with the value [math]0.344 [/math] obtained from data on the settling of flocs of sediment from the San Francisco Bay in laboratory flumes, even though the hydraulic conditions were not entirely comparable with those in the bay (Mehta et al. [24]). The value [math]1/3[/math] is also supported by data from other estuaries (Winterwerp and van Kesteren[10]). For fixed values of [math]G[/math] (from [math]1[/math] to [math]50[/math] [math]s^{-1}[/math]), [math]w_s[/math] characteristically increases with [math]\phi[/math]as collisions between flocs/particles increase with particle concentration. The fifty-five data points for neap tide yield [math]2.34[/math] as the mean fractal dimension [math]D[/math] with a standard deviation [math]\sigma_D = 0.11[/math]. The 50 spring tide data points give [math]D = 2.32[/math] and [math]\sigma_D = 0.08[/math]. From this we may infer that variation in the tidal range did not have a significant impact on floc geometry.
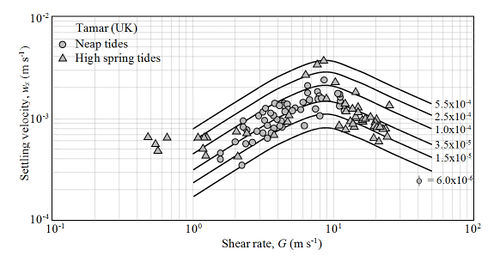
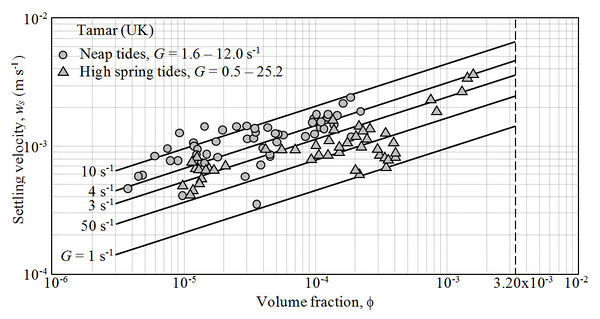
In Fig. 4 the Tamar data are replotted to emphasize the role of [math]G[/math] at constant [math]\phi[/math] ranging from [math]3.0 \times 10^{-6}[/math] to [math]5.5 \times 10^{-4}[/math] consistent with measured concentrations of suspended sediment. As turbulance increases, at [math]G = 9.9 \approx 10 \; s^{-1}[/math] the growth and breakup processes balance and [math]w_s[/math] attains a maximum. Further increase in [math]G[/math] results in the dominance of breakup and [math]w_s[/math] decreases. Data below about [math]1 \; s^{-1}[/math] suggest that at these low shear rates [math]w_s[/math] is not clearly dependent on [math]G[/math]. As the provenance of these low shear flocs is unknown it is reasonable to consider [math]1 \; s^{-1}[/math] to be the lowest value of [math]G[/math] at which Eq. (16) describes shear-induced aggregation.
Hindered settling
Hindered settling, which begins when [math]\phi[/math] exceeds [math]\phi_h[/math], is manifested as a decrease in the settling velocity with increasing [math]\phi[/math]. The particles are so close together that the rate at which they settle depends on the rate at which interstitial water can escape upward; this rate decreases as [math]\phi[/math] increases (and flow permeability decreases). A lutocline occurs at the depth of water at which hindered settling starts. According to Eq. (16) the maximum velocity achieved at the onset of hindered settling is dependent on the shear rate. Teeter[25] modified this equation to ensure that the five [math]w_s (\phi)[/math] curves in Fig. 3 have different slopes and converge to a single value of [math]w_s[/math] at [math]\phi_h[/math]. However, it is found that in general this modification renders the [math]w_s (\phi)[/math] curve non-monotonic, which is unsupported by data.
The simplest settling velocity model for hindered settling is the Richardson and Zaki[26] equation
[math]{{w}_{s}}={{w}_{sh}}(G){{\left[ 1-k\left( \frac{\phi }{{{\phi }_{h}}}-1 \right) \right]}^{5}};\frac{\phi }{{{\phi }_{h}}}\ge 1, \qquad (19)[/math]
in which [math]k[/math] depends on the sediment. The exponent 5 (rounded from the experimental 4.65) was shown by the investigators to be consistent with the correction to Stokes law derived by considering the forces on a free falling particle due to neighboring particles in the viscous regime. As [math]w_{sh}(G)[/math] is not always known, it can be taken as [math]w_{sh}(1)[/math] from Eq. (16), the lowest value arising from shear-induced aggregation, i.e.
[math]{{w}_{sh}}(1)={{a}_{0}}\left( \frac{1+{{\lambda }_{a}}}{1+{{\lambda }_{b}}} \right). \qquad (20)[/math]
In Lake Apopka in central Florida settling velocities of organic-rich mud ([math]\rho_s = 1,873 \; kg m^{-3}[/math]) were measured with LabSFLOC/INSSEV and also in a laboratory settling column. As shear rates in the lake were low, assuming [math]G = 1 \; s^{-1}[/math], Eqs. (16) and (19) are plotted in Fig. 5 along with the data.
Fluid mud
Figure 6 shows sediment-stratified layers that typically occur in water flowing over a bed of flocs formed by prior deposition of suspended matter. Concentration is conveniently specified by the floc volume fraction [math]\phi_f[/math], which is related to [math]\phi[/math]as
[math]{{\phi }_{f}}=\frac{\Delta {{\rho }_{s}}}{\Delta {{\rho }_{f}}}\phi. \qquad (21) [/math]
Setting [math]\phi_f= 1[/math] in Eq. (21) defines the so-called space-filling volume fraction [math]{{\phi }_{sp}}=\Delta {{\rho }_{f}}/\Delta {{\rho }_{s}}[/math]. Therefore
[math]{{\phi }_{f}} = \frac{\phi}{\phi_{sp}} . \qquad (22)[/math]
When [math]\phi_f[/math] is less than 1 the mixture of sediment and water is a suspension in which inter-particle cohesive bonds can form and break, and at the bed surface ([math]\phi_f = 1[/math]) the bonds form an incipient solid matrix of permanently interconnected particles. The strength of the matrix increases below the surface as [math]\phi_f[/math] usually increases above 1. In the bed, [math]\phi_f[/math] is greater than 1 because [math]\phi[/math] is larger than [math]\phi_{sp}[/math]. This notional extension of the floc volume "fraction" in the bed permits a continuous representation of sediment concentration across the bed surface. The solid matrix in the bed increasingly supports the total normal stress [math]\sigma[/math], and therefore the effective normal stress [math]\sigma_v[/math] increases with depth. As [math]\sigma ={{\sigma }_{v}}+{{\sigma }_{u}}[/math], in which the pore water pressure [math]\sigma_u[/math] decreases with increasing[math]{{\phi }_{f}}[/math].
Fluid mud occurs between [math]\phi_f = 1[/math] and [math]\phi_{fh}[/math]; the latter quantity representing the onset of hindered settling at the lutocline. It can have a typical value of about 0.03. Fluid mud (FM) is an ephemeral state of mud sustained by the supply of kinetic energy of the flow. If energy supply is reduced, due to hindered settling the thickness of FM decreases and its density increases. Close to the bottom of FM mud that becomes denser than [math]\phi_f[/math]= 1 changes into a bed. If the energy supply increases FM dilates as water in entrained into mud. The density of the upper part of FM decreases below [math]\phi_{fh}[/math]and becomes a dilute suspension (FL). These processes can make the thickness of FM more or less self-limiting.
FL is not subject to hindered settling. Above FL there may be a very dilute "residual" suspension (SF) containing small flocs and colloids that do not readily deposit. When the flow is not too agitated, in engineering analysis of sedimentation the measured mean concentration of SF is often subtracted from all concentration measurements as a “wash load” value which practically does not participate in sedimentation. At the bed surface, with typical values of [math]\rho_s = 2,650 \; kg m^{-3}, \rho_w = 1,000 \; kg m^{-3}[/math] and floc density [math]\rho_f = 1,100 \; kg m^{-3}[/math], [math]\; \phi_{sp}[/math] would be about 0.06. Below it's surface the bed consists of two layers. The upper layer - stratified bed (SB), in which [math]\phi[/math] (> 1) typically increases with depth due to consolidation, may be no more than about 0.3 m thickness. The lower uniform layer - uniform bed (UB), with a maximum floc volume "fraction" [math]\phi_{fm}[/math]. Its value may be as high as 4 (or higher if the bed is over-consolidated).
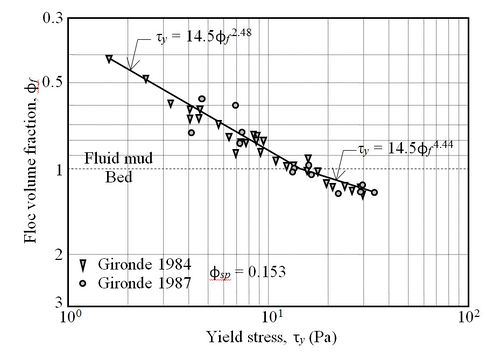
In FL the sediment becomes increasingly viscoplastic with depth as manifested by yield stress [math]\tau_y[/math] increasing with [math]\phi_f[/math]. Empirically the two variables can be related by the power law
[math]{{\tau }_{y}}=A\phi _{f}^{p}. \qquad (23)[/math]
This relationship is illustrated by data from the Gironde Estuary (France) in Fig. 7. Observe that [math]A = 14.5[/math] remains unchanged but the exponent [math]p[/math] increases from [math]2.48[/math] in fluid mud to [math]4.44[/math] in the bed. This increase implies that [math]\tau_y[/math] is more significantly dependent on [math]\phi_f[/math] in the bed than in fluid mud because inter-particle bonding is stronger in the bed. The lowest recorded yield stress of 1.61 Pa represents the limiting sensitivity of the vane viscometer used in situ for measurement (Galichon et al. [27]).
Transport of Cohesionless Particles
In a given volume of flowing water, an ensemble of cohesionless particles: (a) may be carried in suspension through the upstream flow cross-section and out through the downstream cross-section without depositing on the bed or acquiring additional particles eroded from the bed, (b) may deposit over the reach, thus depleting water of particles leaving the volume, (c) may increase in concentration due to arrival of particles eroded from the bed along the reach, or (d) may hop along the reach by sequential deposition and erosion (Fig. 8).
Condition (a) represents the transport of wash load in which the sediment in suspension and the bed are physically apart with no exchange at the bed surface between the two sediment populations (which therefore can be quite different). Conditions (b), (c) and (d) represent bed material load defined by exchange at the bed surface. Regarding condition (d), which is a general case inclusive of (b) and (c), in steady (turbulent) flow the number fluxes of depositing and eroding particles are equal at sedimentary equilibrium. The resulting advective mass sediment flux (dry mass per unit cross-section per unit time) is conventionally divided into bed load (near-bed flux) and suspended load (suspension flux).
A key feature in equilibrium of particles of a single size class is that erosion and deposition at the bed are governed by the so-called critical shear stress, which is a function of grain size (Julien 2010[8]). Erosion occurs when the flow shear stress at the bed is just greater than the critical shear stress because, per simplified description, the shear-induced hydrodynamic lift is greater than the buoyant weight of the particle. Under the opposite condition deposition occurs. In a flow characterized by turbulent fluctuations in shear stress both (erosion and deposition) conditions occur and result in simultaneous erosion and deposition. This also applies to multi-size class beds at which each size responds to turbulent flow according to its own transport regime. In the theory of Einstein[28]the bed load layer is just a few grain diameters in thickness and within it erosion and deposition are governed by the stochastic properties of boundary layer turbulence (as well as grain properties). In shallow estuaries with depths no more than perhaps 2-3 m the thickness can be taken as, for instance, about 5% of the water depth. This requires that the near-bed flux be measured in situ at that depth for purposes of bed load estimation. More realistically, for convenience of measurement the thickness of the bed load layer in any not-too-shallow estuary may be assumed to be, say, 0.1 m. Precise transport definitions and bed load formulas are found in van Rijn (1984a)[29].
When the current velocity [math]u[/math] in an estuary peaks at about [math]1 m s^{-1}[/math] or higher, the majority of mass flux tends to be as suspended load, which is commonly calculated using the well-known sedimentary equilibrium-based formula of Rouse (see van Rijn[30]). When the ratio of particle buoyant weight to flow inertia represented by [math]w_{s}/{\kappa} u*[/math] is low the suspension is uniform, and as the ratio increases the suspension becomes increasingly “bottom-weighted”. The Rouse formula requires that the suspended sediment concentration be measured at the bottom of the suspended load layer, which can be conveniently taken as the top of the bed load layer. Suspended load is usually the dominant mode of transport for instance at sandy estuarine mouths where strong flood and ebb flows occur. In this case the Einstein-Brown bed load formula (Brown[31]) provides a simple method to roughly estimate the total load by calibrating it against the total load, assuming that a separate bed load formula is not essential (Powell et al.[32]). The total mass of sediment per unit time per unit width of the estuary channel is obtained from
[math]{{g}_{s}}\ \ =\ \ \frac{0.078{{\rho }_{s}}{{w}_{s}}{{f}^{3}}}{{{g}^{3}}{{\left( \frac{\rho_s}{\rho_w} -1 \right)}^{3}}d_{p}^{2}}{{u}^{6}}, \qquad (24)[/math]
where [math]f[/math] is the Darcy-Weisbach bed friction factor. As an illustration consider a 200 m wide channel with [math]u = 1 \; m s^{-1}, \; \rho_s = 2,650 \; kg m^{-3}, \; \rho_w = 1,015 \; kg m^{-3}, \; f = 0.030, \; d_p = 0.4 \; mm, \; w_s = 60 \; mm s^{-1}[/math], which yields [math]g_s = 0.53 \; kg m^{-1} s^{-1}[/math]. Therefore, over the width of the channel the load will be [math]106 \; kg s^{-1}[/math].
Cohesive Sediment
Floc deposition
In shallow estuaries in which flocs are conveyed by the current over the entire water depth [math]h[/math], starting from Eq. (14) the deposition of flocs in terms of the time-rate of decrease of [math]\phi[/math] is obtained by mass balance
[math]\frac{d\phi }{dt}=-\frac{a(G)}{h}\left( 1-\frac{{{\tau }_{b}}}{{{\tau }_{d}}} \right){{\phi }^{n+1}}, \qquad (25)[/math]
where the bed shear stress [math]{{\tau }_{b}}={{\rho }_{w}}u_{*}^{2}[/math] and [math]\tau_d[/math] is called the critical shear stress for deposition. Deposition can occur only when [math]\tau_d[/math] is less than [math]\tau_b[/math]. Solving for [math]\phi[/math] yields
[math]\phi (t)={{\phi }_{0}}{{\left[ 1+\frac{a(G)n\phi _{0}^{n}}{h}\left( 1-\frac{{{\tau }_{b}}}{{{\tau }_{d}}} \right)t \right]}^{-\ \frac{1}{n}}}, \qquad (26)[/math]
where [math]\phi_0[/math] is the value of at the start (e.g. at the beginning of a time-step in a numerical model) of deposition which causes [math]\phi(t)[/math] to decrease (Mehta et al. [24]). The deposition flux is
[math]{{F}_{s}}=a(G){{\rho }_{s}}{{\phi }^{n+1}}. \qquad (27)[/math]
In Eq. (14) if aggregation is ignored, i.e. [math]\phi[/math] and [math]G[/math] do not influence [math]w_s[/math], setting [math]n = 0[/math] and [math]a[/math] constant renders [math]w_s[/math] constant. Then Eq. (25) yields
[math]\phi (t)={{\phi }_{0}}{{e}^{-\,\frac{{{w}_{s}}}{h}\left( 1-\,\frac{{{\tau }_{b}}}{{{\tau }_{d}}} \right)t}}, \qquad (28)[/math]
which is commonly known as the Krone equation with deposition flux [math]{{F}_{s}}={{w}_{s}}\phi[/math].
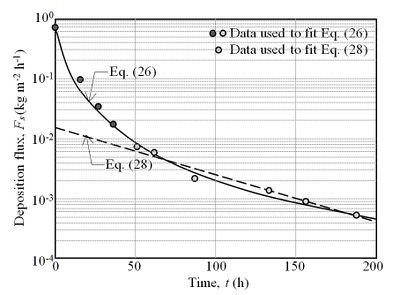
In Fig. 9, the Krone equation [Eq. (28)] and the generalized Krone equation [Eq. (26)] are plotted along with experimental data from a single deposition test run in a flume ([math]h = 0.3 \; m, \; \tau_b = 0.032 \; Pa, \; \tau_d = 0.081 \; Pa[/math]) using sediment from Mare Island Strait in San Francisco. The difference between the two curves is due to the inclusion of aggregation in Eq. (26) with [math]\phi_0 = 3.73 \times 10^{-3}, \; a = 4.3, \; n = 0.73[/math], which produced order of magnitude greater net flux than Eq. (28) with [math]\phi_0 = 4.11 \times 10^{-4}, \; w_s = 1.44 \times 10^{-6} \; m s^{-1}[/math]. Thus it is evident that, in general, aggregation cannot be ignored when modeling floc deposition.
Cohesive bed erosion
There are two principal modes of cohesive bed erosion – surface erosion and mass erosion. In the first mode bed flocs exposed to bed shear stress [math]\tau_b[/math] are eroded when [math]\tau_b[/math] exceeds the bed floc erosion shear strength [math]\tau_s[/math]. This occurs under the soil mechanically drained condition in the top bed floc layer as the time for dissipation of excess pore pressure due to a turbulent flow tends to be shorter than the characteristic time for the detachment and entrainment of the floc. The magnitude of [math]\tau_s[/math] is close to cohesion defined by the Mohr-Coulomb criterion (Winterwerp et al. [33]). In the second mode the bed instantaneously erodes down to a certain depth below surface along which the shear stress equals the undrained shear strength. For soft cohesive beds the yield stress is a convenient surrogate for this shear strength. Organic-rich fine sediment beds such as those found in lakes are typical candidates for mass erosion (Mehta et al.[34]).
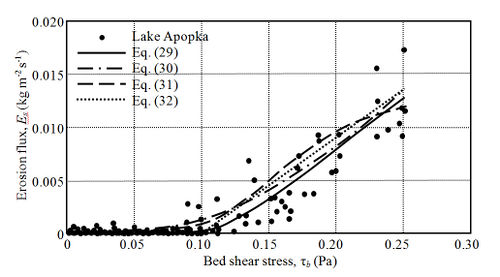
Only a handful of formulas for the surface erosion flux [math]E_s[/math] have been developed from the first principles. Partheniades[36] treated the bed shear stress [math]\tau_b[/math] as the sum of the time-mean value [math]\bar \tau_b[/math] and a fluctuating component [math]\tau'_b[/math] with (unbounded) normal frequency distribution. Furthermore it was assumed that the characteristic time [math]t_e[/math] over which detachment and entrainment of a bed floc takes place is independent of [math]\tau_b[/math]. This led to an equation with an upper-limit erosion rate that cannot be exceeded at high values of [math]\tau_b[/math]. In turn this restriction can result in gross underestimation of [math]E_s[/math] at high current velocities. It was pointed out by van Prooijen and Winterwerp[37] that the error can be corrected by recognizing that [math]t_e[/math] must decrease as [math]\tau_b[/math] increases, and as a separate consideration [math]E_s[/math] must vary with the excess bed shear stress [math]\tau_b - \tau_s[/math] because in reality [math]\tau_b[/math] cannot have an unbounded distribution.
In the resulting Eq. (29), [math]M[/math] is an empirical flux constant, [math]\tau _{s}^{*}=\alpha {{\hat{\tau }}_{s}}-\beta {{\delta }^{2}}, \; {{\hat{\tau }}_{s}}={{\tau }_{s}}/{{\bar{\tau }}_{b}}(1+{{\delta }^{2}}), \; {{\sigma }_{b}}={{[{{\bar{\tau }}_{b}}(1+{{\delta }^{2}})/{{\rho }_{w}}]}^{0.5}}\; [/math] is the standard deviation of bed shear stress based on randomly varying near-bed velocity [math]u_{b}(t)[/math] with a mean [math]u_b[/math] and [math]\delta = u_b/{\sigma}_u[/math]. Best-fit values of the coefficients [math]\alpha[/math] and [math]\beta[/math] were based on measured (non-normal) distribution of [math]\tau_b[/math] due to its dependence on [math]{u_{b}^{2}}[/math] (quadratic law). For the plot in Fig. 10, which also includes data from Lake Apopka (Mehta et al. [38]), the selected values are [math]\rho_w = 1,000 \; kg m^{-3}, \; u_b = 4.09 \times 10^{-2} \; m s^{-1}, \; \sigma_u = 4.09 \times 10^{-2} \; m s^{-1}, \; M = 4.79 \times 10^{-3} \; kg N^{-1} s^{-1}, \; \tau_s = 0.14 \; Pa, \; \alpha = 30, \; \beta = 70.[/math]
Equation (30) is a polynomial approximation of Eq. (29) with sediment dependent coefficients [math]a_1[/math] through [math]a_4[/math]. However, the severity of approximation makes Eq. (30) entirely empirical. Thus a restriction on use is that other than (measured) [math]\tau_s[/math] the coefficients must be obtained by tuning. An advantage is that in some cases it may be sufficient to consider just one term within the brackets, which reduces the expression to a linear, quadratic or third-order polynomial, each with a single free coefficient. Selected values in Fig. 10 are [math]\tau_s = 0.12 \;Pa, a_1 = -1.14, \; a_2 = 10.9, \; a_3 = -5.87, \; a_4 = -1.37[/math].
In Eq. (31) the stochastic basis of Eq. (29) has been extended by treating [math]\tau_s[/math] as the sum of the spatial mean value [math]\bar \tau_s[/math] and a component [math]\tau'_s[/math] varying over the bed surface. The quantities [math]\phi(\tau_b)[/math] and [math]\phi(\tau_s)[/math] are the frequency distributions of [math]\tau_b[/math] and [math]\tau_s[/math], respectively, and [math]\phi_E[/math] is a characteristic erosion-related volume fraction. The distribution [math]\phi(\tau_b)[/math] is produced using the quadratic law and Monte Carlo simulation from random distribution of turbulent velocity [math]u[/math]. Thus [math]\phi({\tau_b})[/math] does not have a prescribed canonical form (unless one is deduced from experimental data). Due to the absence of adequate data, the [math]\phi(\tau_s)[/math] distribution is conveniently taken as normal. The Heavyside function [math]H(\operatorname{\theta})[/math] = 0 if [math]\operatorname{\theta}[/math] < 0, 1 if [math]\operatorname{\theta}[/math] > 0 and 0.5 if [math]\operatorname{\theta}[/math] = 0. Parametric values are: [math]\phi_E = 4.06 \times 10^{-4}, \; \rho_s = 1,873 \; kg m^{-3}, \; \bar \tau_s = 0.15 \; Pa[/math]. Additionally the standard deviations of bed shear stress [math]\sigma_b[/math] (0.035 Pa) and floc shear strength [math]\sigma_s[/math] (0.020 Pa) are required (Letter and Mehta[39]). A limitation of the method is that there is no close-form expression for calculating the erosion flux.
Empirical Eq. (32), which is the linear (empirical) form of Eq. (30) with erosion flux constant [math]M'[/math], was originally proposed by Ariathurai [40]. The plot is based on [math]M'= 0.09 \; kg N^{-1} s^{-1} \; \tau_s = 0.10 \; Pa[/math]. It shows an abrupt transition at the critical shear stress which is not quite supported by the data indicating a gradual transition.
Erosion shear strength
The shear strength [math]\tau_s[/math] is determined by a variety of field- and laboratory-based devices. These tests can be both costly and time consuming, and as a result for rough estimation of [math]\tau_s[/math] it is convenient to use the following empirical relationship of Migniot[1] relating [math]\tau_s[/math] to the yield stress [math]\tau_y[/math], which can be readily measured in a rotary viscometer
[math]{{\tau }_{s}}=\left\{ \begin{align} & {{\alpha }_{0}}{{\rho }_{w}}\sqrt{{{\tau }_{y}}};\quad {{\tau }_{y}}\le {{\tau }_{y}}_{0} \\ & {{\beta }_{0}}{{\rho }_{w}}{{\tau }_{y}};\quad \quad {{\tau }_{y}}\gt {{\tau }_{y}}_{0} \\ \end{align} \right. \qquad (33)[/math]
Equation (33) in two segments with [math]\tau_{y0} =1.37 \; Pa[/math] appears to hold for a wide variety of cohesive sediments as seen by the data sets of Migniot[1] and of Ohtsubo and Muraoka [41] ([math]\alpha_0 = 2.20 \times 10^{-4}, \; \beta_0 = 1.88 \times 10^{-4},[/math] [math] \rho_w = 1,000 \; kg m^{-3}[/math]). In a fractal floc as part of a “bed” subjected to shear in a viscometer, the number of inter-particle bonds at the plane of failure is by definition independent of bed floc diameter [math]d_f[/math] (Kranenburg [14]). In other words, [math]K[/math], the product of [math]\tau_y[/math] and the characteristic maximum cross-sectional area [math]\pi d_{f}^{2}/4[/math] does not vary with [math]d_f[/math]
[math]{{\tau }_{y}}\frac{\pi }{4}d_{f}^{2}=K. \qquad (34)[/math]
Using Eq. (11) yields
[math]{{\tau }_{y}}={{K}_{0}}\Delta \rho _{f}^{\frac{2}{(3-D)}};\quad {{K}_{0}}=\frac{4K} {\pi d_{p}^2 \Delta \rho _s^{\frac{2}{(3-D)}}}. \qquad (35)[/math]
The validity of Eq. (35) was demonstrated by Kranenburg[14] using yield stress data of Krone[42] for marine and aquatic muds. It was shown that the fractal basis was reasonable; a representative value of [math]D[/math] was about 2.2. From Eqs. (11) and (35)
[math]{{\tau }_{y}} = K_0 \Delta {\rho_s}^{\frac{2}{(3-D)}}\left( \frac{d_p}{d_f} \right)^2 \qquad (36)[/math]
in which [math]K_0[/math] is essentially a calibration constant. For given cohesive sediment it indicates a relationship between the floc diameter [math]d_f[/math] and [math]\tau_y[/math]. It appears that for a wide range of sediments, [math]K_0 = 9.8 \times 10^{-6}, \; \Delta \rho_s =1,650 \; kg m^{-3}, \; D = 2.2, \; d_p = 0.1 \; \mu m[/math] (Mehta and Letter[43]). Note that as Eq. (23) relates [math]\tau_y[/math] to the floc volume fraction [math]\phi_f[/math], there is an implied dependence of [math]\phi_f[/math] on [math]d_p[/math]; however, this dependence has not been found for fractal flocs.
Characteristic shear stresses
Unlike cohesionless sediment transport in which erosion and deposition are characterized by the critical shear stress for erosion [math]\tau_c[/math], cohesive sediment requires specification of the erosion shear strength [math]\tau_s[/math] and the critical shear stress for deposition [math]\tau_d[/math]. Floc deposition can occur when its buoyant weight exceeds the hydrodynamic lift force, but erosion requires the lift force to exceed the sum of buoyant weight and cohesion which attaches the floc to the bed. Thus, the lift force needed to erode the floc is greater than that at which deposition can occur. In turn, as the bed shear stress is proportional to lift, [math]\tau_s[/math] is characteristically larger than [math]\tau_d[/math].
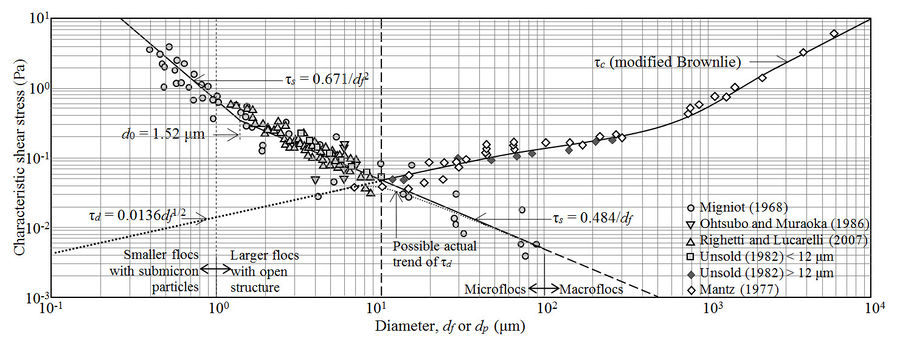
In Fig. 12 an effort has been made to represent [math]\tau_s, \; \tau_d[/math] and [math]\tau_c[/math] in a single plot as functions of floc/particle diameter. For this purpose, in Eq. (33) [math]\tau_y[/math] has been replaced by [math]d_f[/math] with the help of Eq. (36) (and [math]d_p = 0.1 \mu m[/math]). For cohesionless sediment down to 11 μm, which is close to the nominal 10 μm mentioned earlier, [math]\tau_c[/math] can be related to particle diameter [math]d_p[/math] using the empirical Brownlie[44] equation in a slightly modified form
[math]{{\tau }_{c}}=g\Delta {{\rho }_{s}}\left[ \left( \frac{0.1050}{\operatorname{Re}_{*}^{0.6}}-\frac{0.0142}{\operatorname{Re}_{*}^{1.03}} \right)+ \left(0.770e^{-102.7\operatorname{Re}_*} - 0.135e^{-15.95\operatorname{Re}_*} \right)+{0.068\cdot 10^{\frac{-4}{{\operatorname{Re}_*}^{0.6}}}}\right]{{d}_{p}}, \qquad (37)[/math]
where [math]\operatorname{Re}_{*}={{\rho }_{w}}{{u}_{*}}{{d}_{p}}/\eta [/math].
The deposition stress [math]\tau_d[/math] is based on the relationship
[math]{{\tau }_{d}}={{\tau }_{{{d}_{p}}}}\sqrt{\frac{d_f}{d_p}}\qquad (38)[/math]
as proposed by Mehta and Letter[43] based on flume data of Mehta and Lott[45] for kaolinite deposition with [math]\tau_{d_p} = 4.29 \times 10^{-3},[/math] and [math]d_p = 0.1 \mu m[/math]. The equation line is conveniently selected to intersect the junction of Eqs. (33) and (37), although in reality intersection can vary somewhat from its value at the junction depending on clay mineral composition.
An important feature of Fig. 12 is that the abscissa represents both [math]d_f[/math] and [math]d_p[/math] depending on the characteristic stress, which makes the entire representation somewhat subjective. The transition diameter [math]d_T[/math] (11μm) and the diameter for Eq. (37) refer to particles, whereas Eq. (33) for diameters larger than [math]d_0 = 1.52 \mu m[/math] relates to [math]d_f[/math]. Diameters smaller than [math]d_0[/math], mainly submicron, can be [math]d_p[/math] or [math]d_f[/math], however, Eq. (33) in this range as well as Eq. (38) are based on [math]d_f[/math].
The difference between [math]\tau_s[/math] and [math]\tau_d[/math] at a given diameter notionally begins at [math]d_T[/math] and increases with decreasing diameter. In reality the difference between these two stresses cannot be nil for flocs of diameter [math]d_f[/math] larger than [math]d_p = d_T[/math], although it can be expected to decrease rapidly as the flocs become open-structured and lighter with increasing diameter. One may anticipate the real trend in [math]\tau_d[/math] to resemble the sketched curve.
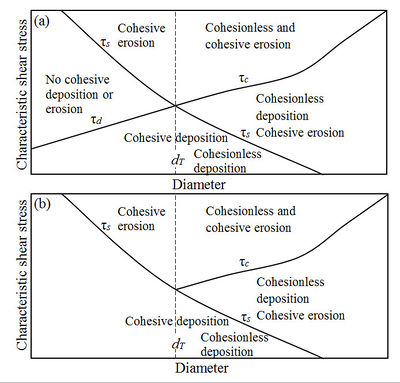
Referring to Fig. 13, Fig. 13a describes zones of erosion and deposition. Sediment load calculations for cohesionless particles (diameter greater than [math]d_T[/math]) encounter [math]\tau_c[/math] as the only characteristic shear stress. Conveniently assuming the instantaneous bed shear stress [math]\tau_b[/math] as having an unbounded (e.g. normal) distribution, when [math]\tau_b[/math] is greater than [math]\tau_c[/math] there is erosion only, and when [math]\tau_c \lt \tau_b[/math] there can be only deposition. Thus, as long as erodible particles are present, over any unit area large enough to represent the bed (Fig. 8), it can either erode or deposit on an instantaneous basis. Therefore, in general there will be simultaneous erosion and deposition along the entire channel reach.
When the sediment is cohesive, simultaneous erosion and deposition will not occur when the floc diameter is smaller than [math]d_T[/math] and [math]\tau_b[/math] is greater than [math]\tau_d[/math] but less than [math]\tau_s[/math]. In reality such “blank” periods do not occur because: (1) floc diameter has a characteristically graded distribution with diameters smaller and larger than [math]d_T[/math], and (2) the diameter can change due to aggregation (Sanford and Halka[15]). A simple example of this is given in Fig. 14, which shows a floc settling test conducted in a 4.25 m tall and 0.29 m diameter column containing sediment from the Ems Estuary in the Netherlands. An oscillating grid system inside the column was used to impart a uniform shear rate of [math]7.3 \; s^{-1}[/math] during the settling process (van Leussen [18]). The initial suspension ([math]\phi = 3.9 \times 10^{-4}[/math]) consisted of uniform-size microflocs ([math]d_f = 17 \mu m[/math]).

As observed, after 180s shear-induced aggregation led to a shift in the initial mass of the microflocs with the production of larger microflocs (92 μm) from the microflocs, and after 1280 s, 200 μm macroflocs were formed with further shift in mass. A numerical model (1D vertical) accounting for aggregation and using multi-class particle population balance was used for simulation purposes (Hsu et al. [47], Lee et al. [46]). In single size class modeling the best approximation for avoiding the (unreal) blank zone is by selecting [math]\tau_d = 0[/math] (Fig. 13b) (Winterwerp and van Kesteren[10]).
Fluid mud entrainment
When a layer of fluid mud occurs between the bed and “dilute” suspension (in which settling is characteristically not in the hindered mode), the transport of flocs can be complicated by simultaneous entrainment and hindered settling of fluid mud as well as its advection. Modeling advection requires consideration of the viscoplastic properties of mud (Whitehouse et al. [48]).
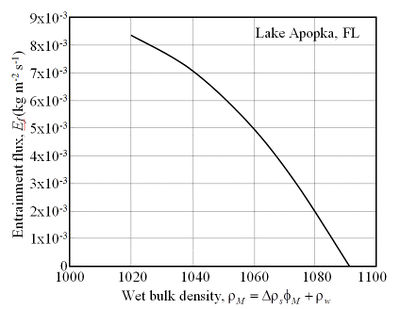
The entrainment flux [math]E_f[/math] of fluid mud by water flowing with inner boundary layer thickness [math]h_b[/math] and velocity [math]u_b[/math] may be roughly estimated from
[math]{{E}_{f}}={{\rho }_{s}}{{\phi }_{m}}{{u}_{b}}\left( \frac{{{A}_{E}}}{Ri}-{{B}_{E}}Ri \right);\quad Ri=\frac{{g}'{{h}_{b}}}{u_{b}^{2}};[/math]
[math]{g}'=g{{\phi }_{M}}\left( \frac{{{\rho }_{s}}}{{{\rho }_{w}}}-1 \right), \qquad (39)[/math]
where [math]Ri[/math] is the gradient Richardson number and [math]\phi_M[/math] is the volume fraction of fluid mud (Mehta and Srinivas[49]). The coefficients [math]A_E[/math] and [math]B_E[/math] depend on the environment, but their starting values could be [math]5 \times 10^{-3}[/math] and [math]1 \times 10^{-4}[/math], respectively.
In Fig. 15, [math]E_f[/math] is plotted against fluid mud wet bulk density [math]\rho_M[/math] using parametric values based on Lake Apopka with [math]h_b = 1 \; m, u_b = 0.20 \; m s^{-1}, \; \rho_s = 1,873 \; kg m^{-3}, [/math] [math]\rho_w = 1,000 \; kg m^{-3}, \; A_E = 5 \times 10^{-3}, \;B_E = 1 \times 10^{-5}[/math]. The wet bulk density [math]\rho[/math] of fluid mud consisting of organic-rich sediment ranges from [math]1,020\; [/math]to [math]1,170 \;kg m^{-3} [/math] (Mehta et al. [34]). As [math]\rho_M[/math] increases its buoyant weight decreases and the entrainment flux rapidly decreases. Fluid mud with [math]\rho_M[/math] greater than about [math]1,090 \;kg m^{-3}[/math] is not entrained.
Basin sedimentation
Coastal fluid mud is a common source of sedimentation in ports and harbors. Small-craft basins with single entrances provide convenient “meso-scale” illustrations of sedimentation in a deposition-dominated prototype environment. The basin in Fig. 16a is in a shallow bay with a semi-diurnal tidal range of about 1.7 m. Outside the basin the sea bed is sandy, and as the concentration ([math]\phi[/math] in the range of [math]4 \times 10^{-5} - 1 \times 10^{-4}[/math]) of suspended clayey sediment is generally low, fluid mud is not readily formed locally, so its known presence as a layer of about 5 cm thickness is believed to be due to advection from an exogenous alluvial source. Fine-medium sand and mud enter the basin during flood flow but little material leaves during ebb. A 3D hydrodynamic model was used to transport sand (as bed load and suspended load) and clay flocs entrained from fluid mud. A sand trap was placed in the entrance channel. The plotted deposition isopleths after a 30-day period of simulation (Fig. 16b) indicated that the trap was successful in capturing most sand but little cohesive material, which spread into the deeper part of the basin.
Acknowledgment
Thanks are due to Prof. Minwoo Son for his comments on an earlier draft. The third author (AM) was partly supported by USGS co-operative agreement (G11AC20352) with HR Wallingford (DDS0280), and the HR Wallingford project “Fine Scale - Dynamics of Fine-grained Cohesive Sediments at Varying Spatial and Temporal Scales” (DDY0523).
Related articles
Sediment transport formulas for the coastal environment
Manual Sediment Transport Measurements in Rivers, Estuaries and Coastal Seas
Bed roughness and friction factors in estuaries
Definitions, processes and models in morphology
Process-based morphological models
References
- ↑ 1.0 1.1 1.2 Migniot, C. (1968) A study of the physical properties of different very fine sediments and their behavior under hydrodynamic action, La Houille Blanche, 7, 591-620 (in French, with abstract in English).
- ↑ McCave, I.N., Manighetti, B., Robinson, S.G. (1995) Sortable silt and fine sediment size/composition size slicing: parameters for palaeocurrent speed and palaeoceanography. Paleoceanography, 10, 593-610.
- ↑ Mehta, A.J., Letter, J.V., Jr., (2015). Cohesive/cohesionless sediment transition diameter from settling velocity data, Ocean Dynamics, DOI 10.1007/s10236-015-0865-3.
- ↑ 4.0 4.1 van Olphen, H. (1977). An Introduction to Clay Colloid Chemistry, 2nd ed., Wiley.
- ↑ Eisma, D. (1986). Flocculation and de-flocculation of suspended matter in estuaries, Netherlands Journal of Sea Research, 20(2/3), 183-199.
- ↑ Gerbersdorf, S.U., Bittner, R., Lubarsky, H., Manz, W. and Paterson, D.M. (2009). Microbial assemblages as ecosystem engineers of sediment stability, Journal of Soils and Sediments, 9, 640-652.
- ↑ 7.0 7.1 Rouse, H. (1937). Nomogram for the settling velocity of spheres, Exhibit D, Report of the Commission on Sedimentation 1936-37, Division of Geology and Geography, National Research Council, Washington DC, 57-64.
- ↑ 8.0 8.1 8.2 Julien, P.Y. (2010). Erosion and Sedimentation, 2nd ed., Cambridge.
- ↑ 9.0 9.1 Lick, W. (2009). Sediment and Contaminant Transport is Surface Waters, CRC Press.
- ↑ 10.0 10.1 10.2 10.3 Winterwerp, J.C., van Kesteren, W.G.M. (2004). Introduction to the Physics of Cohesive Sediment in the Marine Environment. Elsevier.
- ↑ Mayer, L.M., Wells, M.L. (2011). Aggregation of colloids in estuaries, In: Wolanski E. and McLusky D.S. eds.,Treatise on Estuarine and Coastal Science, Vol. 4, Academic Press, 143-159.
- ↑ Liggett, J.A. (1994). Fluid Mechanics, McGraw-Hill.
- ↑ Fugate, D.C., Friedrichs, C.T. (2003). Controls on suspended aggregate size in partially mixed estuaries, Estuarine Coastal and Shelf Science, 58, 389-404.
- ↑ 14.0 14.1 14.2 14.3 Kranenburg, C. (1994). The fractal structure of cohesive sediment aggregates, Estuarine Coastal and Shelf Science, 39(5), 451-460.
- ↑ 15.0 15.1 Son, M., Hsu, T.-J. (2011). The effects of flocculation and bed erodibility on modeling cohesive sediment resuspension, Journal of Coastal Research, 116, C03021, doi:10.1029/2010JC006352 Cite error: Invalid
<ref>tag; name "SH" defined multiple times with different content - ↑ McAnally, W.H. (1999). Transport of fine sediments in estuarial waters, PhD Thesis, University of Florida, Gainesville.
- ↑ Winterwerp, J.C. (1998). A simple model for turbulence induced flocculation of cohesive sediment, Journal of Hydraulic Research, 36(3), 309-326.
- ↑ 18.0 18.1 van Leussen, W. (1994). Estuarine macroflocs: their role in fine-grained sediment transport, PhD thesis, Utrecht University, the Netherlands.
- ↑ 19.0 19.1 19.2 Manning, A.J. (2001). A study of the effects of turbulence on the properties of flocculated mud. Ph.D. Thesis, University of Plymouth, Plymouth, UK.
- ↑ Krone, R.B. (1962). Flume studies of the transport of sediment in estuarial shoaling processes, Final Report, Hydraulic Engineering Laboratory and Sanitary Engineering Research Laboratory, University of California, Berkeley.
- ↑ Overbeek, J.T.G. (1952). Colloid Science, Vol. 1, in: Kinetics of Flocculation, H.R. Kruyt ed., Elsevier, 278-300.
- ↑ Manning, A.J. (2006). LabSFLOC – A laboratory system to determine the spectral characteristics of flocculating cohesive sediments, Technical Report TR 156, HR Wallingford, Wallingford UK.
- ↑ Manning, A.J. and Dyer, K.R. (2002). The use of optics for the in-situ determination of flocculated mud characteristics, Journal of Optics A: Pure and Applied Optics, 4, S71-S81.
- ↑ 24.0 24.1 24.2 Mehta, A.J., Manning, A.J., Khare, Y.P. (2014). A note of the Krone deposition equation and significance of floc aggregation, Marine Geology, 354, 34-39.
- ↑ Teeter, A.M. (2001). Clay-silt sediment modeling using multiple grain classes. Part I: settling and deposition, In: Coastal and Estuarine Fine Sediment Processes, W.H. McAnally and A.J. Mehta eds., Elsevier, 157-171.
- ↑ Richardson, J.F., Zaki, W.N. (1954). The sedimentation of a suspension of uniform spheres under conditions of viscous flow, Chemical Engineering Science, 3, 65-73.
- ↑ 27.0 27.1 Galichon, P., Feral, A., Granboulan, F., Viguier, F. (1990). Variations in rheological properties of muds in the Gironde estuary, Proceedings of the International Conference on Coastal Engineering, ASCE, New York, 2936-2949.
- ↑ Einstein, H.A. (1950). The bed-load function for sediment transportation in open channel flows, Technical Bulletin No. 1026, U. S. Department of Agriculture.
- ↑ van Rijn, L.C. (1984a). Sediment transport, Part I: bed load transport, Journal of Hydraulic Engineering, 110(10), 1431-1455.
- ↑ van Rijn, L.C. (1984b). Sediment transport, Part II: suspended load transport, Journal of Hydraulic Engineering, 110(11), 1613-1641.
- ↑ Brown, C.B. (1950). Sediment transportation, In: Engineering Hydraulics, Chapter 12, H. Rouse, ed., Wiley.
- ↑ Powell, M.A., Thieke, R.J., Mehta, A.J. (2006). Morphodynamic relationships for ebb and flood delta volumes at Florida’s tidal entrances. Ocean Dynamics, 56, 295-307.
- ↑ Winterwerp, J.C., van Kesteren, W.G.M., van Prooijen, B., Jacobs, W. (2012). A conceptual framework for shear-flow induced erosion of soft cohesive sediment beds. Journal of Geophysical Research, C10020, doi:10.1029/2012JC008072.
- ↑ 34.0 34.1 Mehta, A.J., Hwang, K.-N., Khare, Y.P. (2015). Critical shear stress for mass erosion of organic-rich fine sediments, Estuarine, Coastal and Shelf Science, 165, 97-103.
- ↑ So, S., Khare, Y., Park, K., Mehta, A. (2013). Critical wind and turbidity rise in a shallow Florida lake, WIT Transactions on Ecology and the Environment, 169, doi:10.2495/CP130211.
- ↑ Partheniades, E. (1965). Erosion and deposition of cohesive soils, Journal of the Hydraulics Division of ASCE, 91(1), 105-138.
- ↑ van Prooijen, B.C., Winterwerp, J.C. (2010). A stochastic formulation for erosion of cohesive sediments. Journal of Geophysical Research, 115, C01005, doi:10.1029/2008JC005189.
- ↑ Mehta, A.J., Jaeger, J.M., Valle-Levinson, A., Hayter, E.J., Wolanski, E., Manning, A.J. (2009). Resuspension dynamics in Lake Apopka, Florida, Final Report, Submitted to St. Johns River Water Management District, Palatka, FL
- ↑ Letter, J.V., Jr., Mehta, A.J. (2011). A heuristic examination of cohesive sediment bed exchange in turbulent flows, Coastal Engineering, 58, 779-789.
- ↑ Ariathurai, R. (1974). A finite element model for sediment transport in estuaries, PhD Thesis, University of California, Davis.
- ↑ Ohtsubo, K., Muraoka, K. (1986). Re-suspension of cohesive sediments by currents. In: Proceedings of the 3rd International Symposium on River Sedimentation, University of Mississippi, Oxford, 1680-1689.
- ↑ Krone, R.B. (1963). A study of rheological properties of estuarial sediments, Technical Bulletin No. 7, Committee on Tidal Hydraulics, U.S. Army Engineer Waterways Experiment Station, Vicksburg, MS.
- ↑ 43.0 43.1 43.2 43.3 Mehta A.J., Letter, J.V., Jr. (2013). Comments on the transition between cohesive and cohesionless sediment bed exchange, Estuarine, Coastal and Shelf Science, 131, 319-324.
- ↑ Brownlie, W.R. (1981). Prediction of flow depth and sediment discharge in open channels, PhD Thesis, Caltech, California.
- ↑ Mehta, A.J., Lott, J.W. (1987). Sorting of fine sediment during deposition. Pro¬ceedings of Coastal Sediments’87, ed. Kraus, N. C., ASCE, 348-362.
- ↑ 46.0 46.1 Lee, B.J., Toorman, E., Molz, F.J., Wang J. (2011). A two-class population balance equation yielding bimodal flocculation of marine or estuarine sediments, Water Research, 45, 2131-2145.
- ↑ Hsu, T.-J., Traykovski, P.A., Kineke, G.C. (2007). On modeling boundary layer and gravity-driven fluid mud transport, Journal of Geophysical Research, 112(C04011), doi:10.1029/2006JC003719.
- ↑ Whitehouse, R., Soulsby, R., Roberts, W., Mitchener, H. (2000). Dynamics of Estuarine Muds: A Manual for Practical Applications, Thomas Telford.
- ↑ Mehta A.J. and Srinivas R. (1993). Observations on the entrainment of fluid mud in shear flow. In: Nearshore and Estuarine Cohesive Sediment Transport, A.J. Mehta ed., American Geophysical Union, Washington, DC, 224-246.

