File list
This special page shows all uploaded files.
| Date | Name | Thumbnail | Size | Description | Versions |
|---|---|---|---|---|---|
| 22:06, 28 July 2026 | OilImpact.jpg (file) |  |
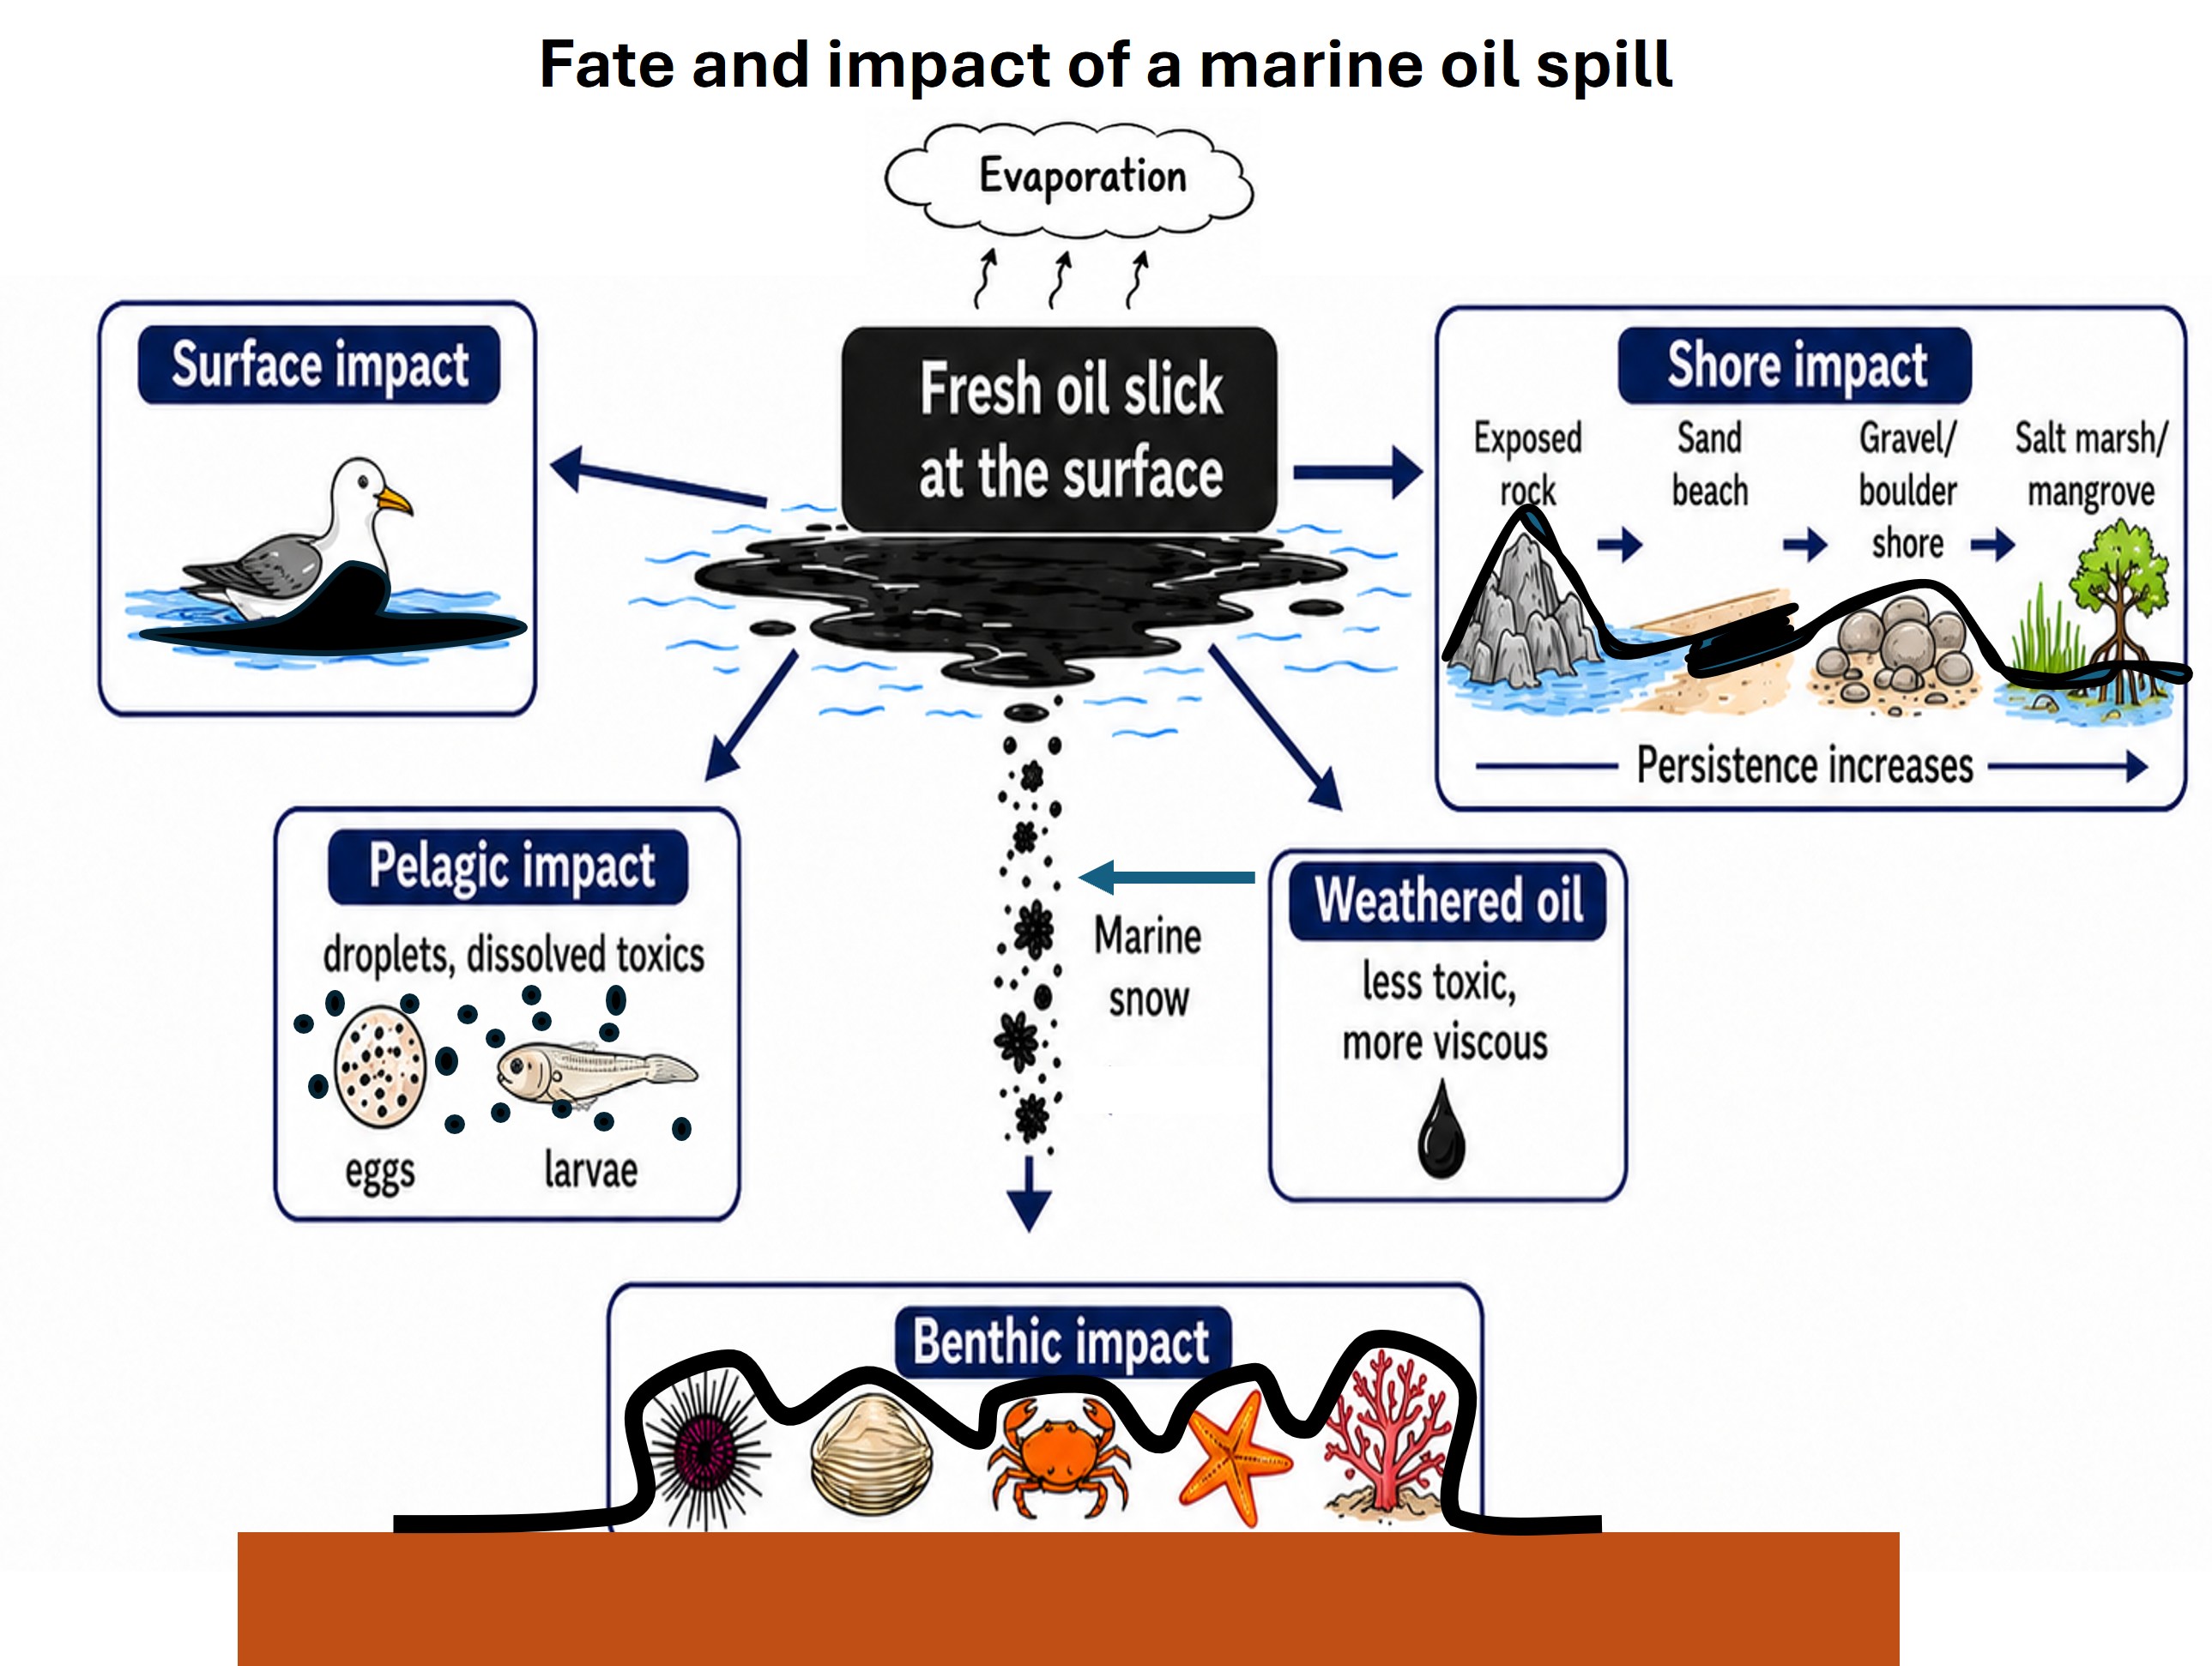
562 KB | Schematic of oil spill impact on the marine ecosystem. | 1 |
| 15:00, 26 July 2026 | Nematode.jpg (file) |  |
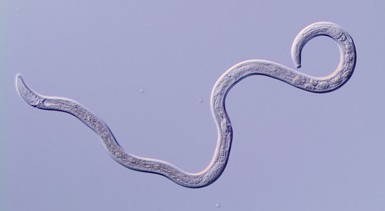
10 KB | Nematode ''Sabatieria longisetosa''. Photo credit Daniel Leduc. https://www.nemys.ugent.be/photogallery.php?album=777&pic=184838 | 1 |
| 14:59, 26 July 2026 | HarpactacoidCopepod.jpg (file) |  |
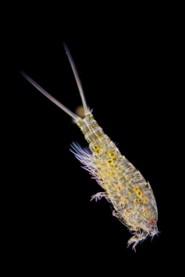
6 KB | Harpactacoid copepod. Photo credit Lodewijk van Walraven. https://plankton.photography/harpacticoid-copepods/ | 1 |
| 14:59, 26 July 2026 | Foraminifer.jpg (file) |  |
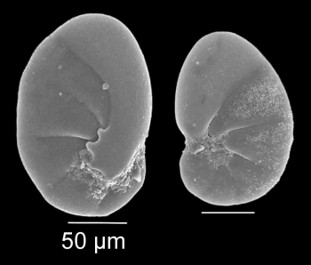
15 KB | Foraminifer ''Nonionella stella''. Photo credit Isabel Mendes. https://www.marinespecies.org/photogallery.php?album=772&pic=47554 | 1 |
| 14:58, 26 July 2026 | Gastrotrich.jpg (file) |  |
13 KB | Gastrotrich Photo credit Jasper Nance. http://www.flickr.com/photos/nebarnix/ Jasper Nance | 1 |
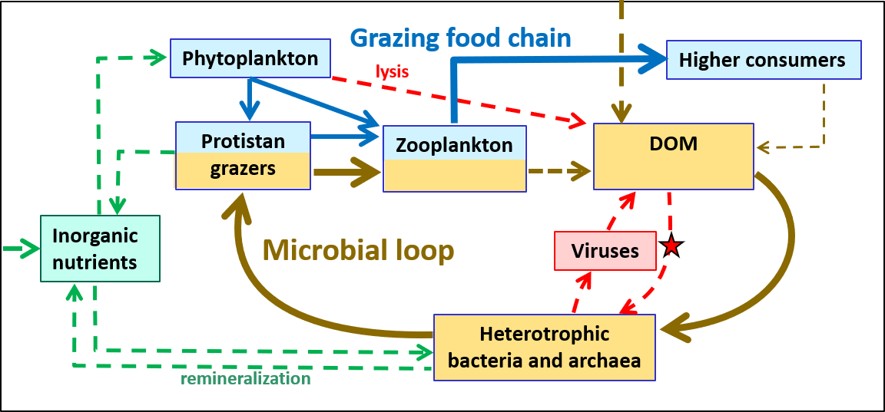
| 17:37, 24 July 2026 | MicrobialLoop.jpg (file) |  |
77 KB | Schematic representation of the microbial loop and its position in the pelagic food web. | 1 |
| 22:48, 23 July 2026 | MarineMicroorganisms.jpg (file) |  |
180 KB | Simplified classification of the principal groups commonly referred to as marine microorganisms. | 1 |
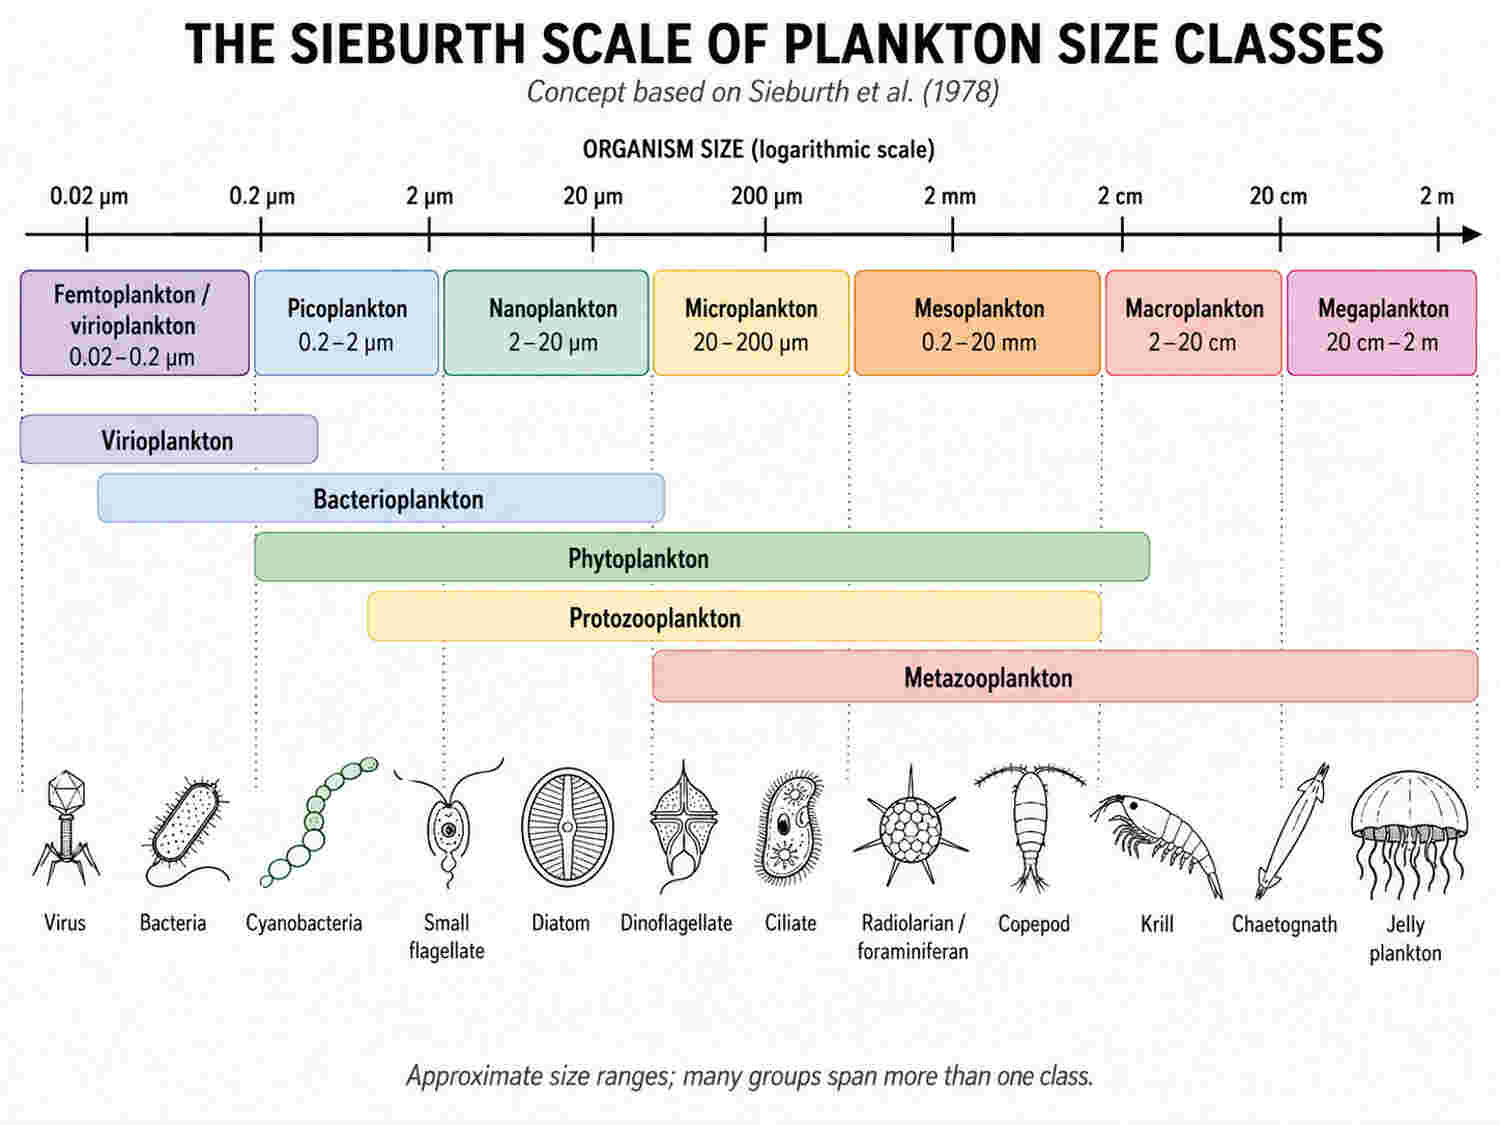
| 23:07, 22 July 2026 | SieburthPlanktonScale.jpg (file) |  |
60 KB | The ‘Sieburth-scale’, redrawn from Sieburth et al. (1978<ref> Sieburth, J. Mn., Smetacek, V. and Lenz, J. 1978. Pelagic ecosystem structure: Heterotrophic compartments of the plankton and their relationship to plankton size fractions. Limnology and... | 1 |
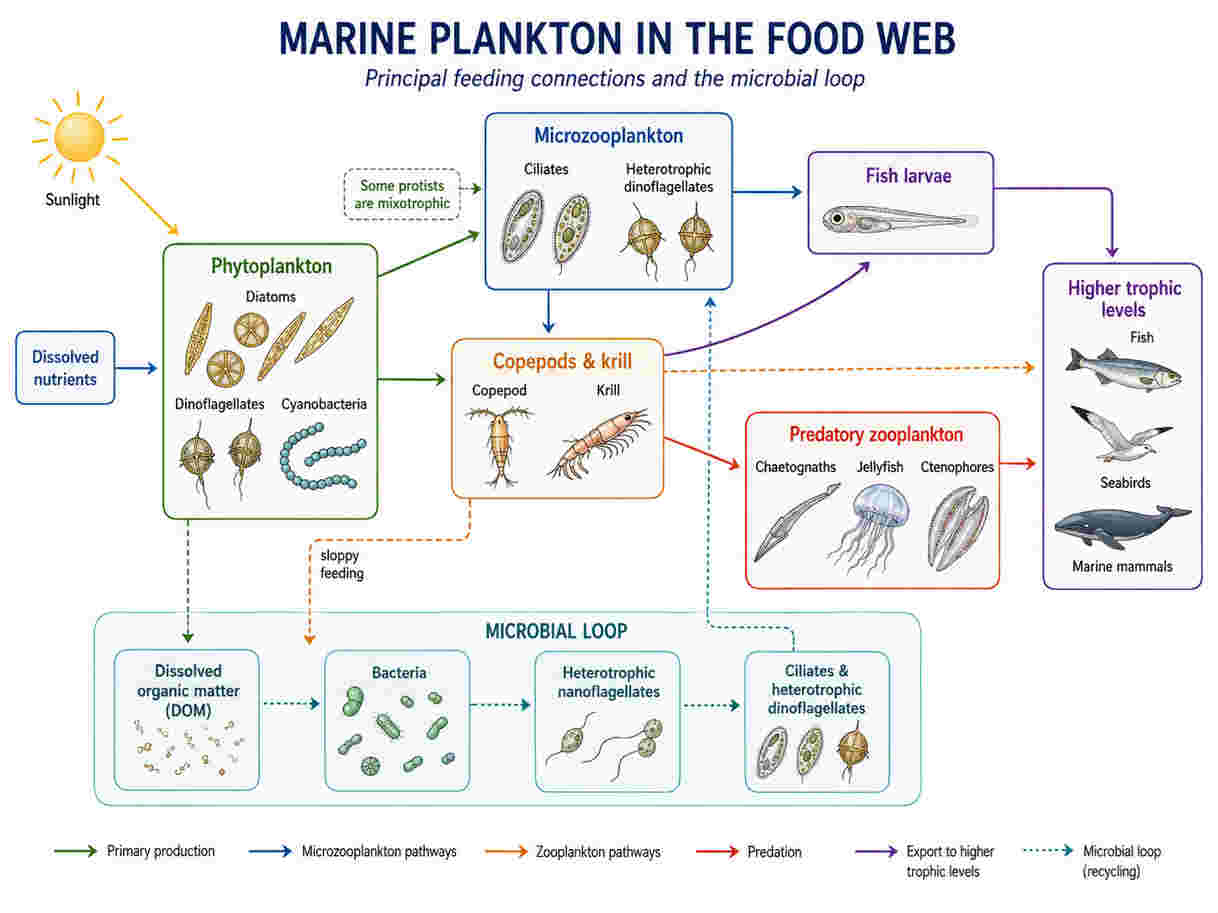
| 21:34, 22 July 2026 | PlanktonFoodWeb.jpg (file) |  |
47 KB | Marine plankton in the food web. Schematic illustration of food-web relationships within the plankton community and their role in the marine ecosystem. | 1 |
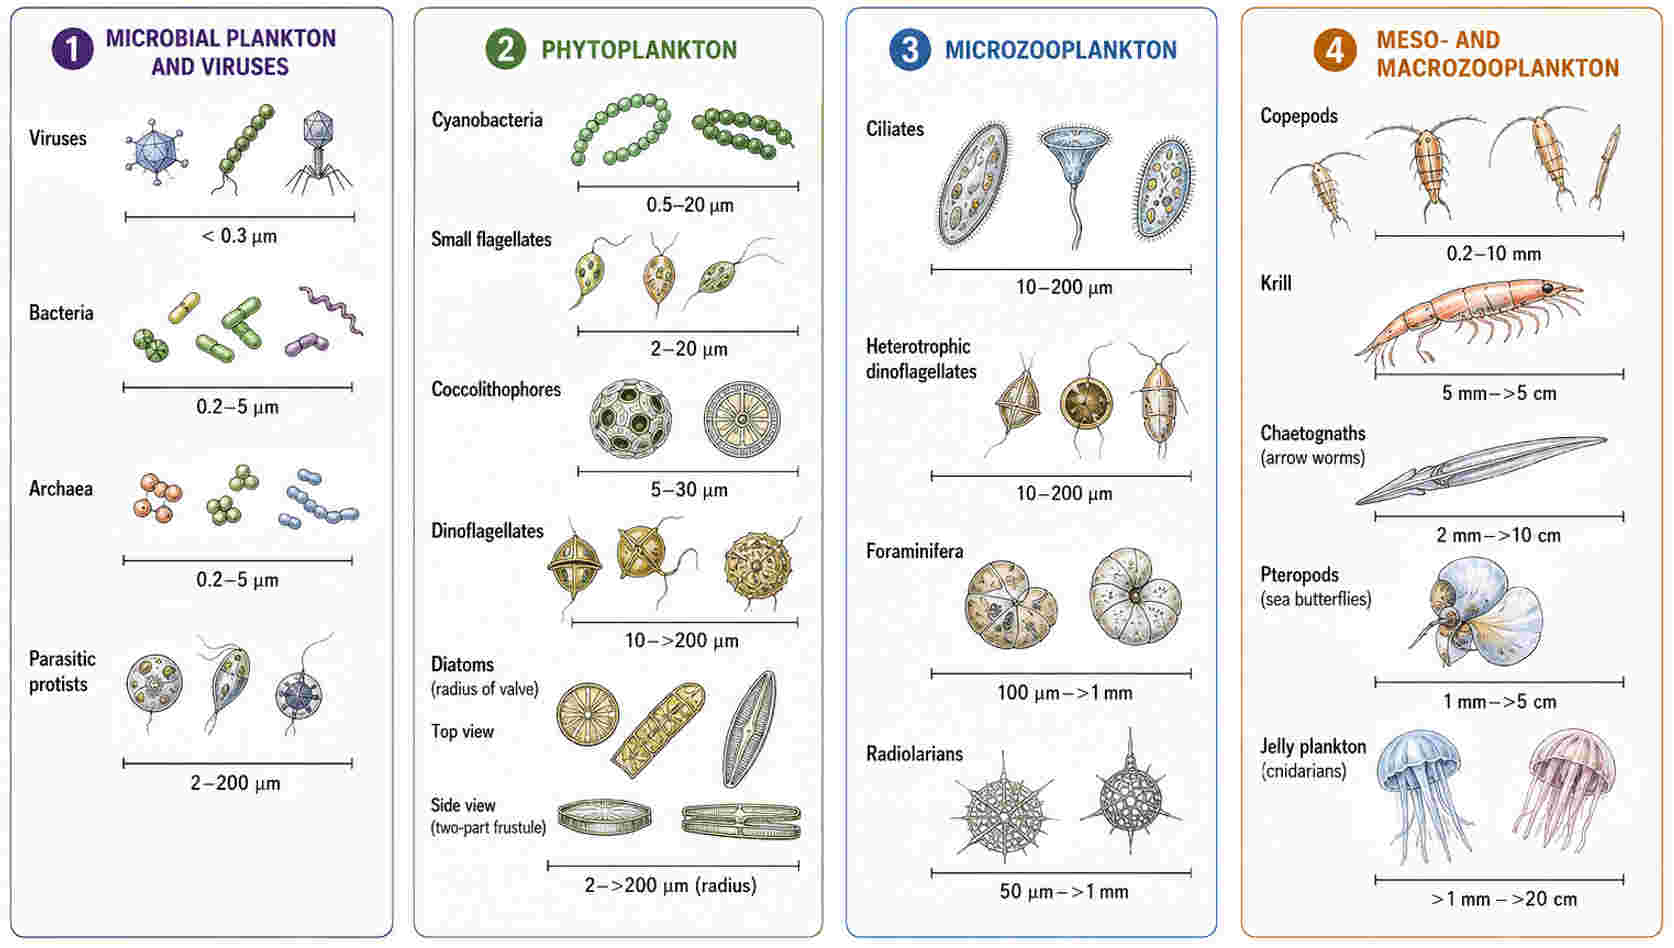
| 21:34, 22 July 2026 | PlanktonCommunity.jpg (file) |  |
69 KB | Principal groups of marine plankton, arranged approximately according to increasing organism size. | 1 |
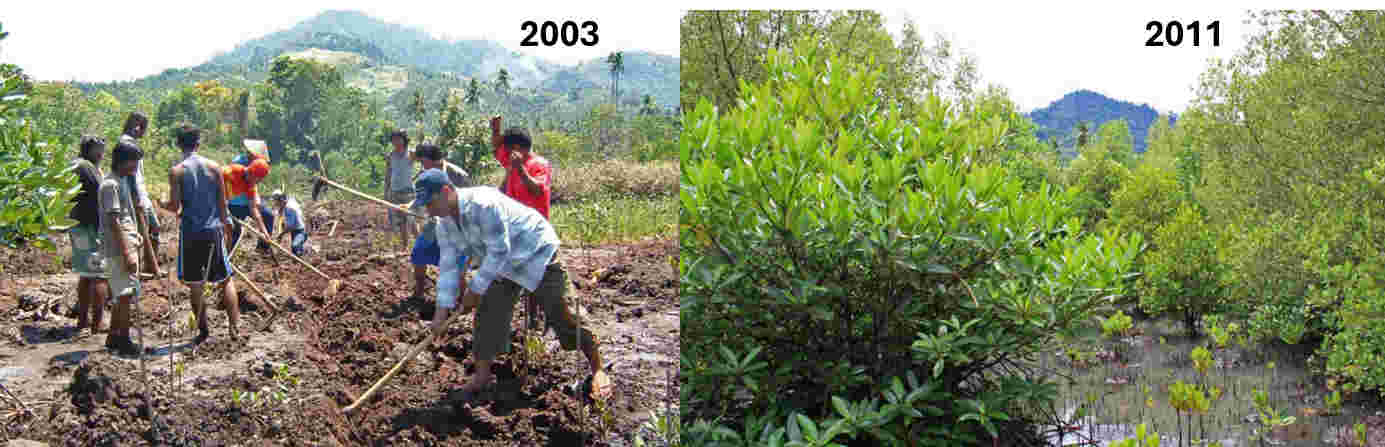
| 20:38, 21 July 2026 | MangroveRestorationTiwoho.jpg (file) |  |
40 KB | Hydrological rehabilitation of abandoned aquaculture ponds at Tiwoho, North Sulawesi, Indonesia. Photo credit Ben Brown, Rignolda Djamaluddin<ref>Brown, B. and Djamaluddin, R. 2017. A site history and field guide for Ecological Mangrove Rehabilitation... | 2 |
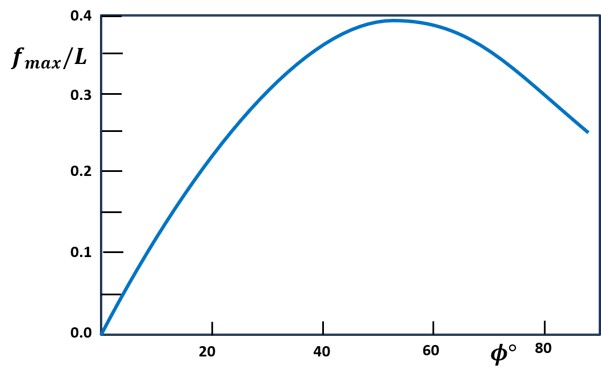
| 12:49, 17 July 2026 | CreekDispersion.jpg (file) |  |
21 KB | The maximum dispersion by a tidal creek due to a phase difference between filling/emptying and the channel current. The corresponding scaled dispersion function <math>f_max/L</math> is shown as a function of the phase <math>\phi</math>. | 1 |
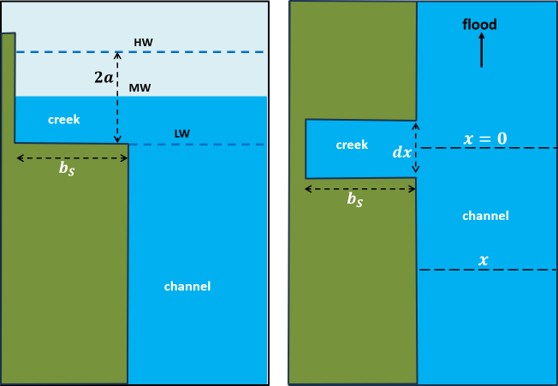
| 12:48, 17 July 2026 | CreekSketch.jpg (file) |  |
27 KB | Definition sketch of a tidal creek. | 1 |
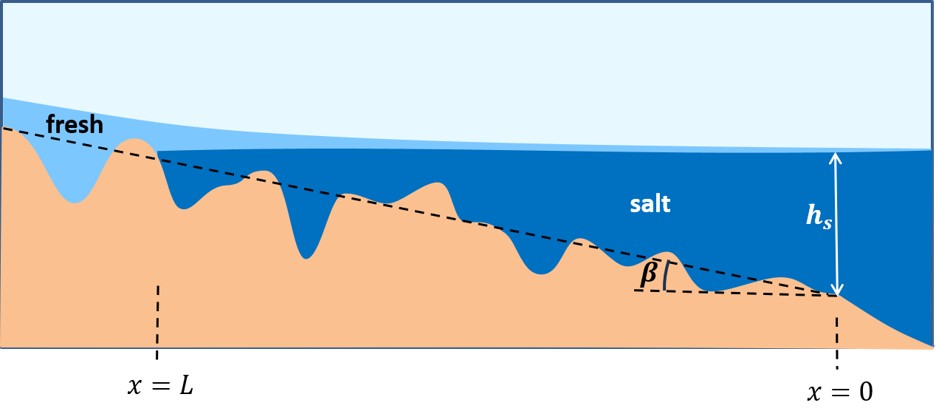
| 15:18, 7 July 2026 | SaltWedgeSlopingBed.jpg (file) |  |
36 KB | In an estuary with bed slope <math>\tan \beta</math>, the salt-wedge length tends to the limiting value <math>L_b=h_s/\tan \beta</math> when the river discharge is small. | 1 |
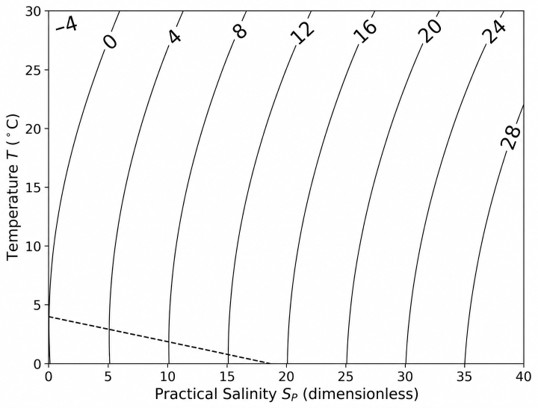
| 15:26, 3 July 2026 | SalinityTemperatureDensityPlot.jpg (file) |  |
34 KB | Curves of density anomaly [kg m<sup>-3</sup>] for temperatures in the range 0-30°C , salinities in the range 0-40 and atmospheric pressure, based on the EOS-80/UNESCO polynomial. | 1 |
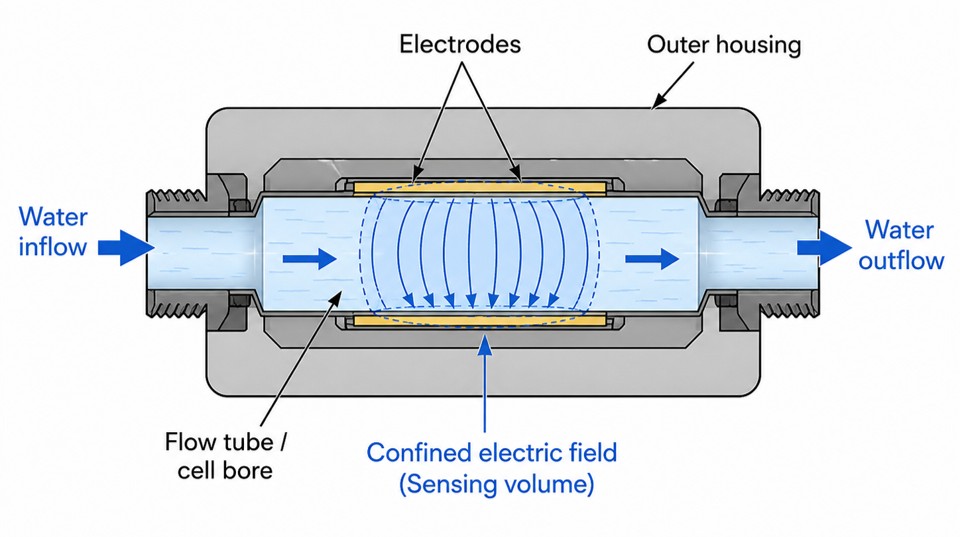
| 17:04, 2 July 2026 | ConductivityCell.jpg (file) |  |
78 KB | Flow-through conductivity cell. Seawater is pumped through a narrow bore containing platinum electrodes. | 1 |
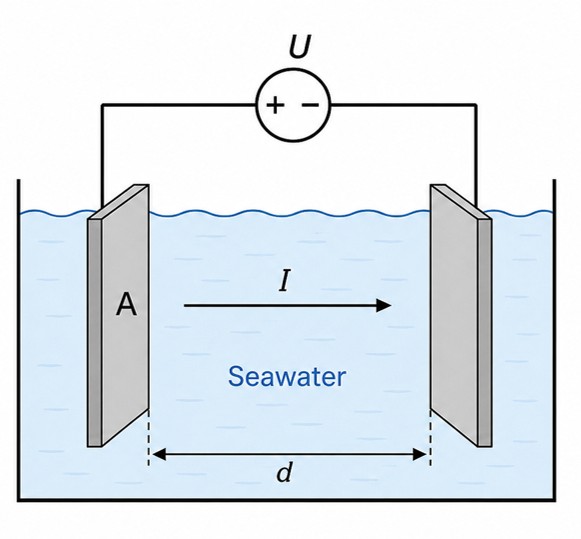
| 17:04, 2 July 2026 | ConductivityPrinciple.jpg (file) |  |
37 KB | Electrode conductivity principle. | 1 |
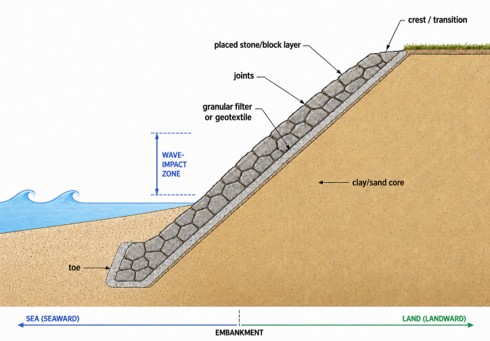
| 15:37, 29 June 2026 | RevetmentSection.jpg (file) |  |
37 KB | Schematic cross-section of a pattern-placed revetment on an earthen embankment. | 1 |
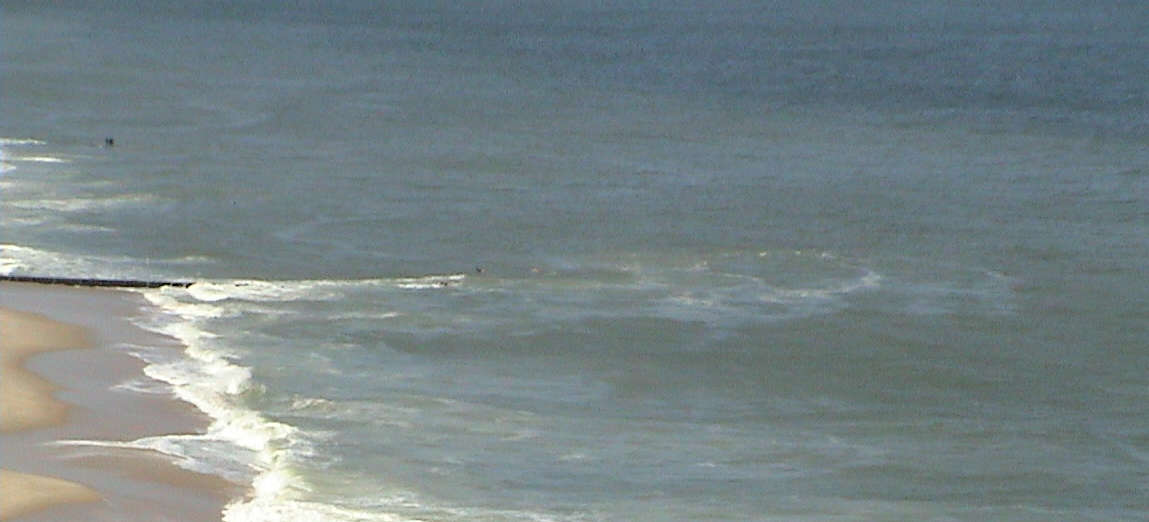
| 22:39, 25 June 2026 | GroyneRip.jpg (file) |  |
43 KB | Boundary rip: Offshore deviated longshore current along a groyne, carrying sediment outside the surf zone. Photo credit Dr. Wendy Carey, Delaware Sea Grant. https://www.weather.gov/safety/ripcurrent-photos | 1 |
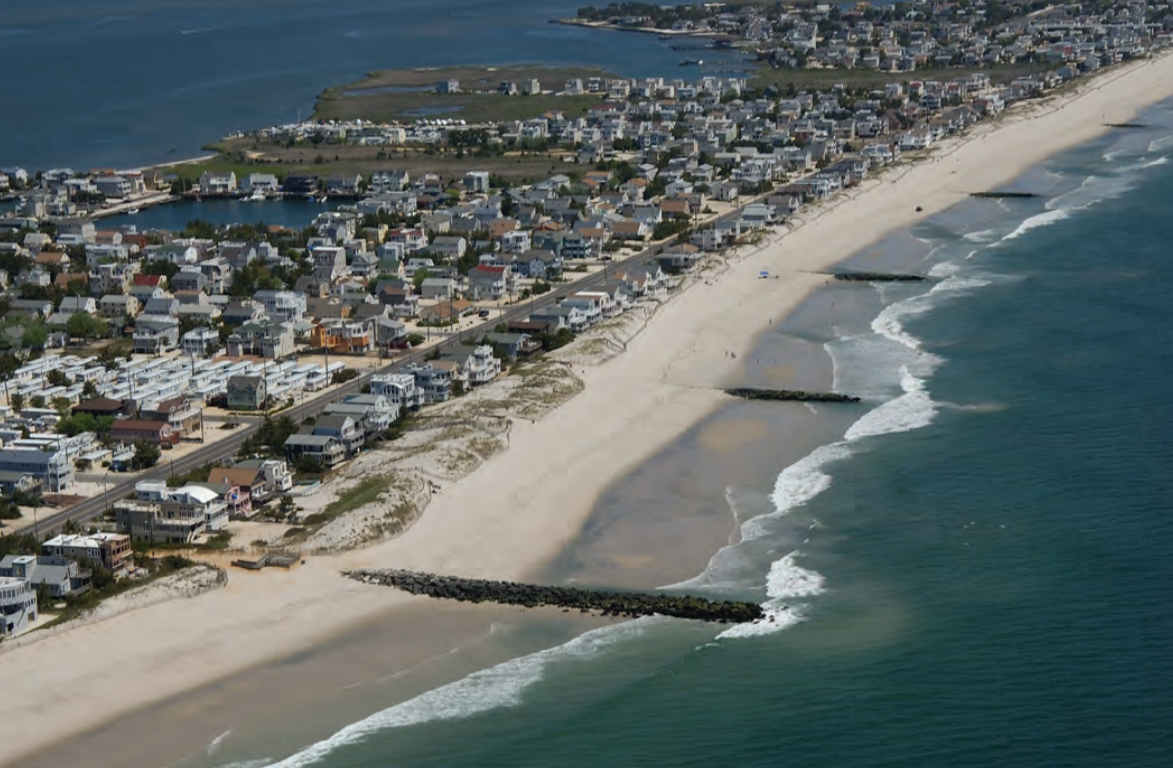
| 22:38, 25 June 2026 | GroyneFieldRip.jpg (file) |  |
79 KB | Groin field at Beach Haven, New Jersey (USA), showing boundary rips. From Hapke et al. (2010<ref name=H10>Hapke, C.J., Himmelstoss, E.A., Kratzmann, M.G., List, J.H. and Thieler, E.R. 2010. National Assessment of Shoreline Change: Historical Shoreline... | 1 |
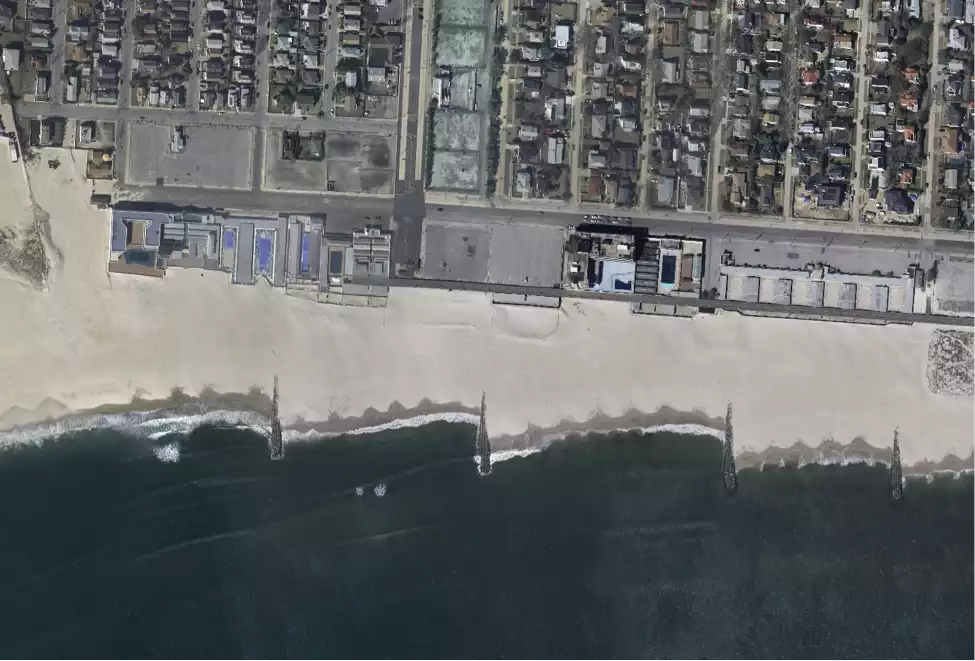
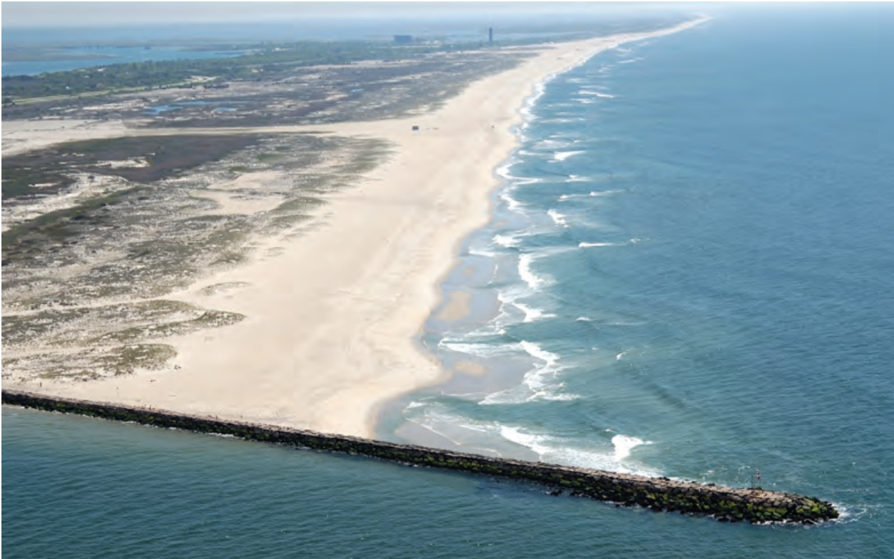
| 22:38, 25 June 2026 | GroyneFieldBeachResponse.jpg (file) |  |
55 KB | Typical saw-tooth shoreline pattern (updrift accretion and downdrift erosion) in a groyne field on the Long Island coast, NY. Image credit USGS EarthExplorer. | 1 |
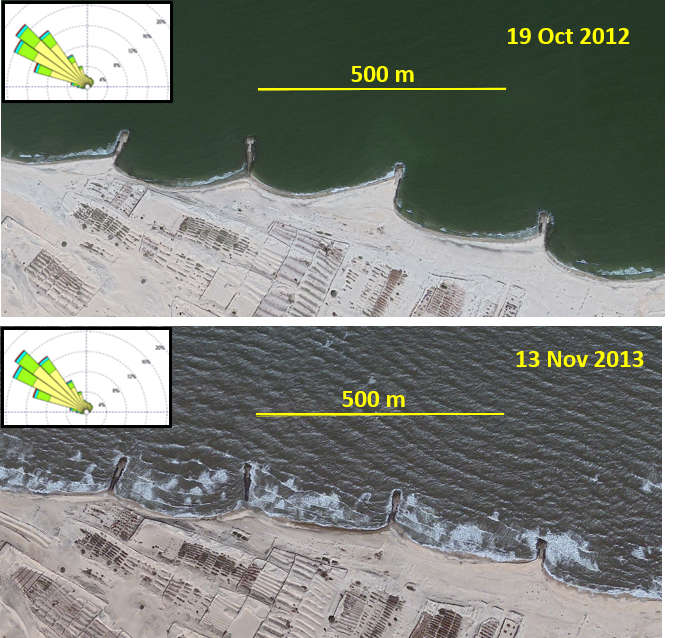
| 22:37, 25 June 2026 | BurullusGroynes.jpg (file) |  |
68 KB | A groyne field on the Nile delta coast (near Burullus) at two consecutive years, showing insufficient protection of the groyne field from beach erosion. Insert: wave rose at Damietta. Upper panel: The typical saw-touth shoreline pattern for oblique wav... | 1 |
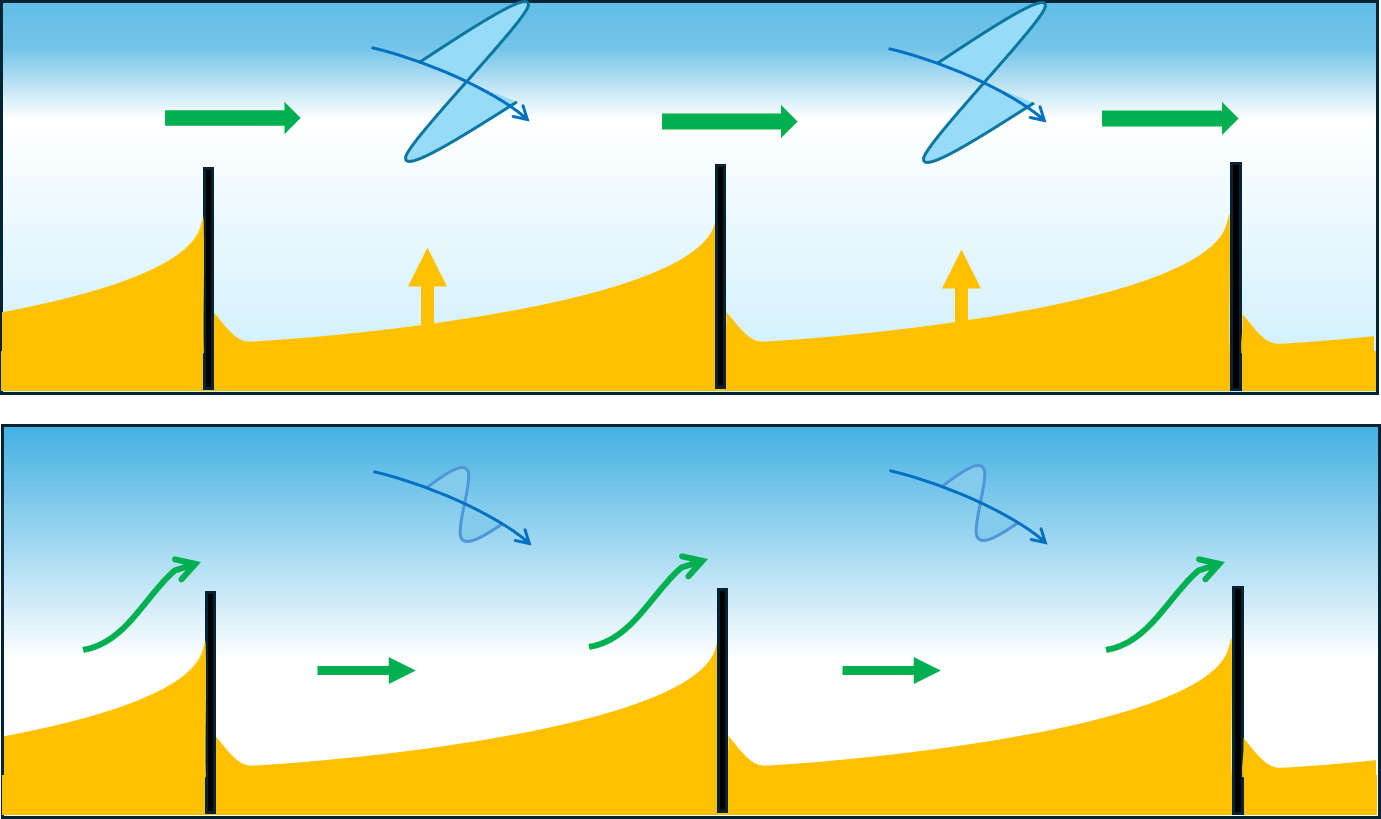
| 22:37, 25 June 2026 | HighMediumObliqueWaveDrift.jpg (file) |  |
68 KB | Groyne field with oblique wave incidence and characteristic saw-tooth shoreline pattern. Upper panel: High energetic waves create a wide surf zone where the major part of the littoral drift passes almost undisturbed by the groyne field. Cross-shore tra... | 1 |
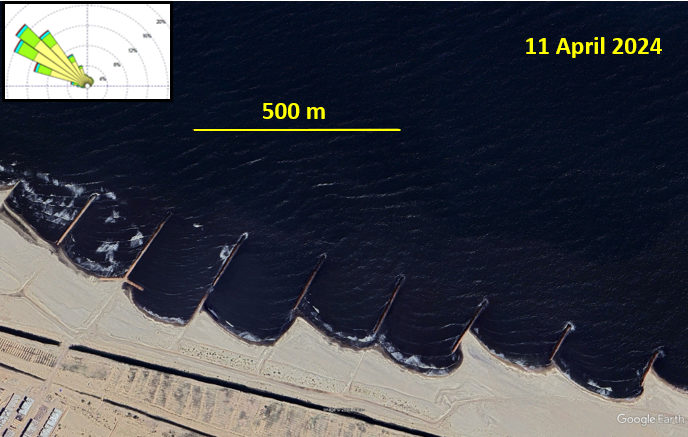
| 22:36, 25 June 2026 | GroynesTooClose.jpg (file) |  |
61 KB | Narrow-spaced groyne field on the Nile delta coast, east of Kitchener drain. Insert: Damietta wave rose. The saw-touth shoreline pattern is inverted. | 1 |
| 22:35, 25 June 2026 | JettyRips.jpg (file) |  |
82 KB | Beach rip pattern updrift of an inlet jetty at Jones Beach, New Jersey. The alongshore rhythmiticy of the rip pattern is probably due to edge waves reflected from the jetty. From Hapke et al. (2010<ref name=H10>Hapke, C.J., Himmelstoss, E.A., Kratzmann... | 1 |
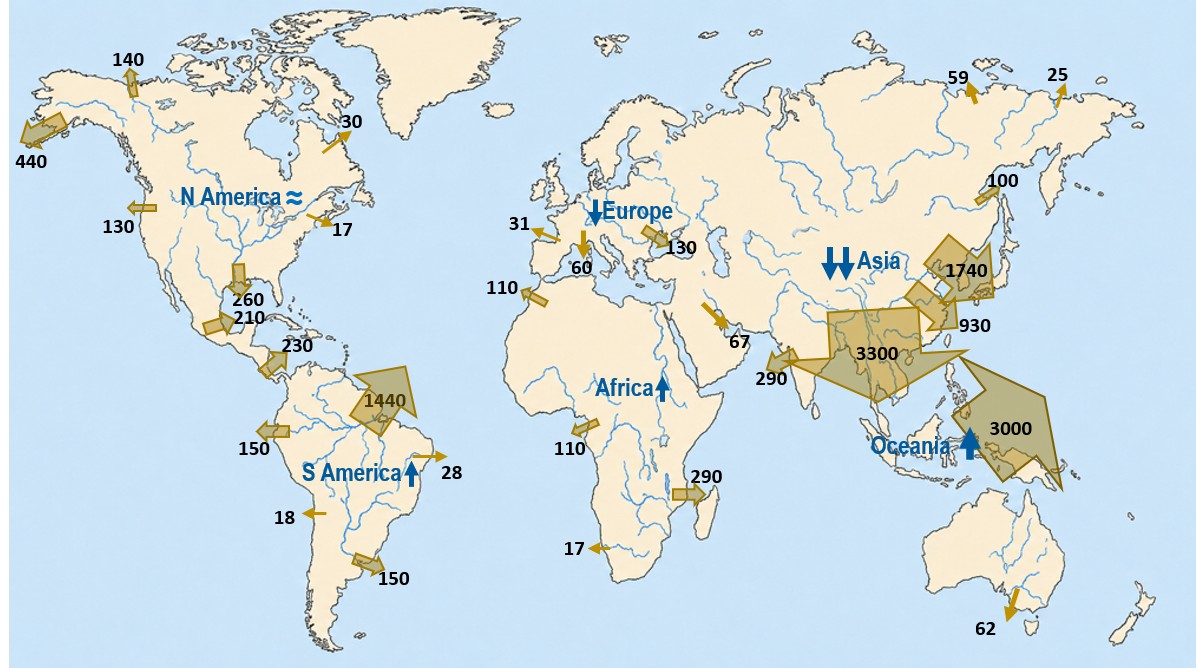
| 22:04, 23 June 2026 | GlobalSedimentDischarges.jpg (file) |  |
167 KB | Annual fluvial sediment discharge to the coastal ocean according to the classic global inventory of Milliman and Meade (1983<ref> Milliman, J. D. and Meade, R. H. 1983. World-wide delivery of sediment to the oceans. Journal of Geology 91, 1–21</ref>)... | 1 |
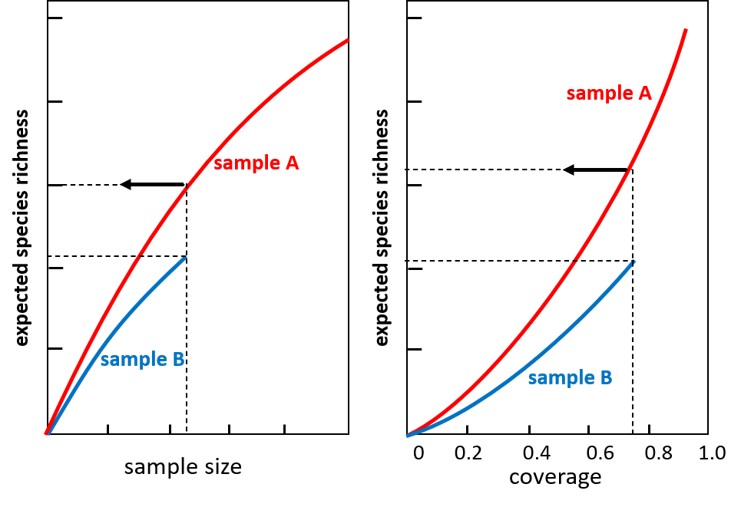
| 14:33, 22 June 2026 | Size Coverage Curves.jpg (file) |  |
53 KB | When comparing the species richness of two communities represented by a large sample A and a small sample B respectively, the results depend on the rarefaction method for sample A: rarefied to the same sample size or rarefied to the same coverage. | 1 |
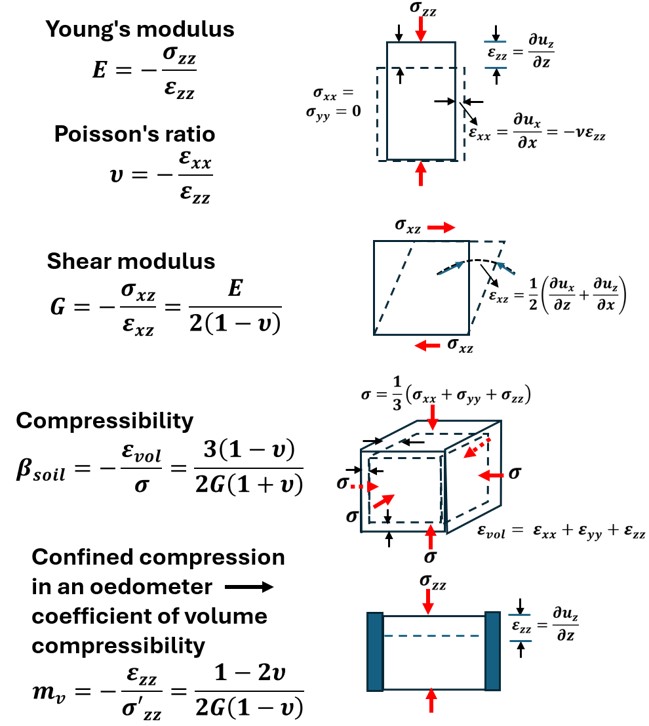
| 10:21, 19 June 2026 | ElasticSoilModuli.jpg (file) |  |
79 KB | Definitions of elastic soil deformation moduli .Adapted from USACE 2012. Coastal Engineering Manual. EM 1110-2-1100 Part VI. | 2 |
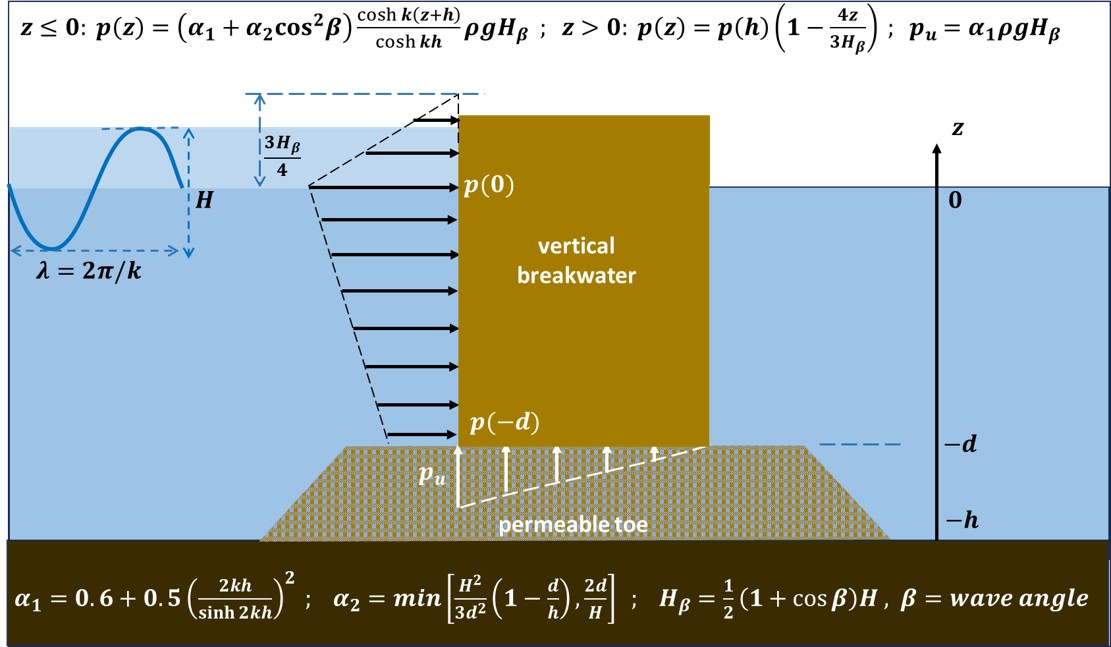
| 12:44, 18 June 2026 | ShorewardWaveLoadBreakwater.jpg (file) |  |
93 KB | Goda’s formula for forward wave pressure loading on a vertical breakwater<ref name=G74>Goda, Y. 1974. A new method of wave pressure calculation for the design of composite breakwater. In Proceedings of the 14th Conference on Coastal Engineering. ASCE... | 2 |
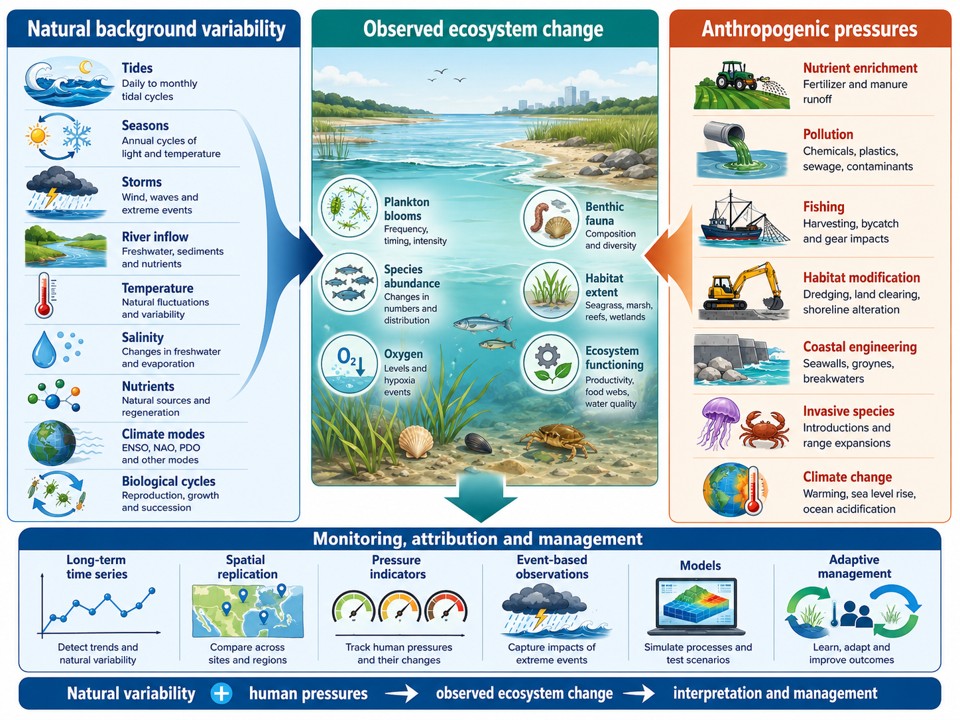
| 21:59, 11 June 2026 | EcosystemChange.jpg (file) |  |
244 KB | Conceptual illustration of natural background variability, anthropogenic pressures and observed ecosystem change. AI-generated with ChatGPT/DALL·E based on the article Natural variability and change in coastal ecosystems. | 1 |
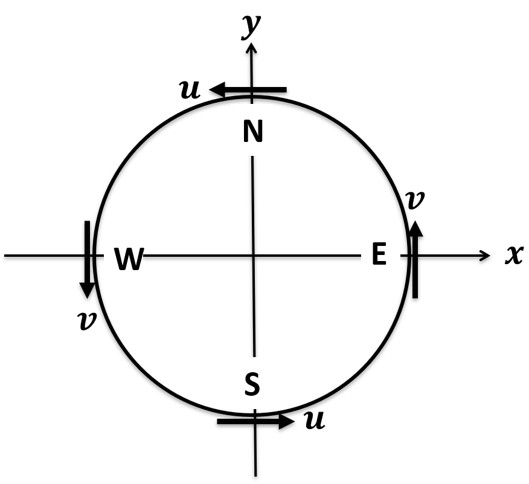
| 12:10, 4 June 2026 | EddyMotion.jpg (file) |  |
21 KB | Schematic of a cyclonically rotating idealized circular eddy in the northern Hemisphere. | 1 |
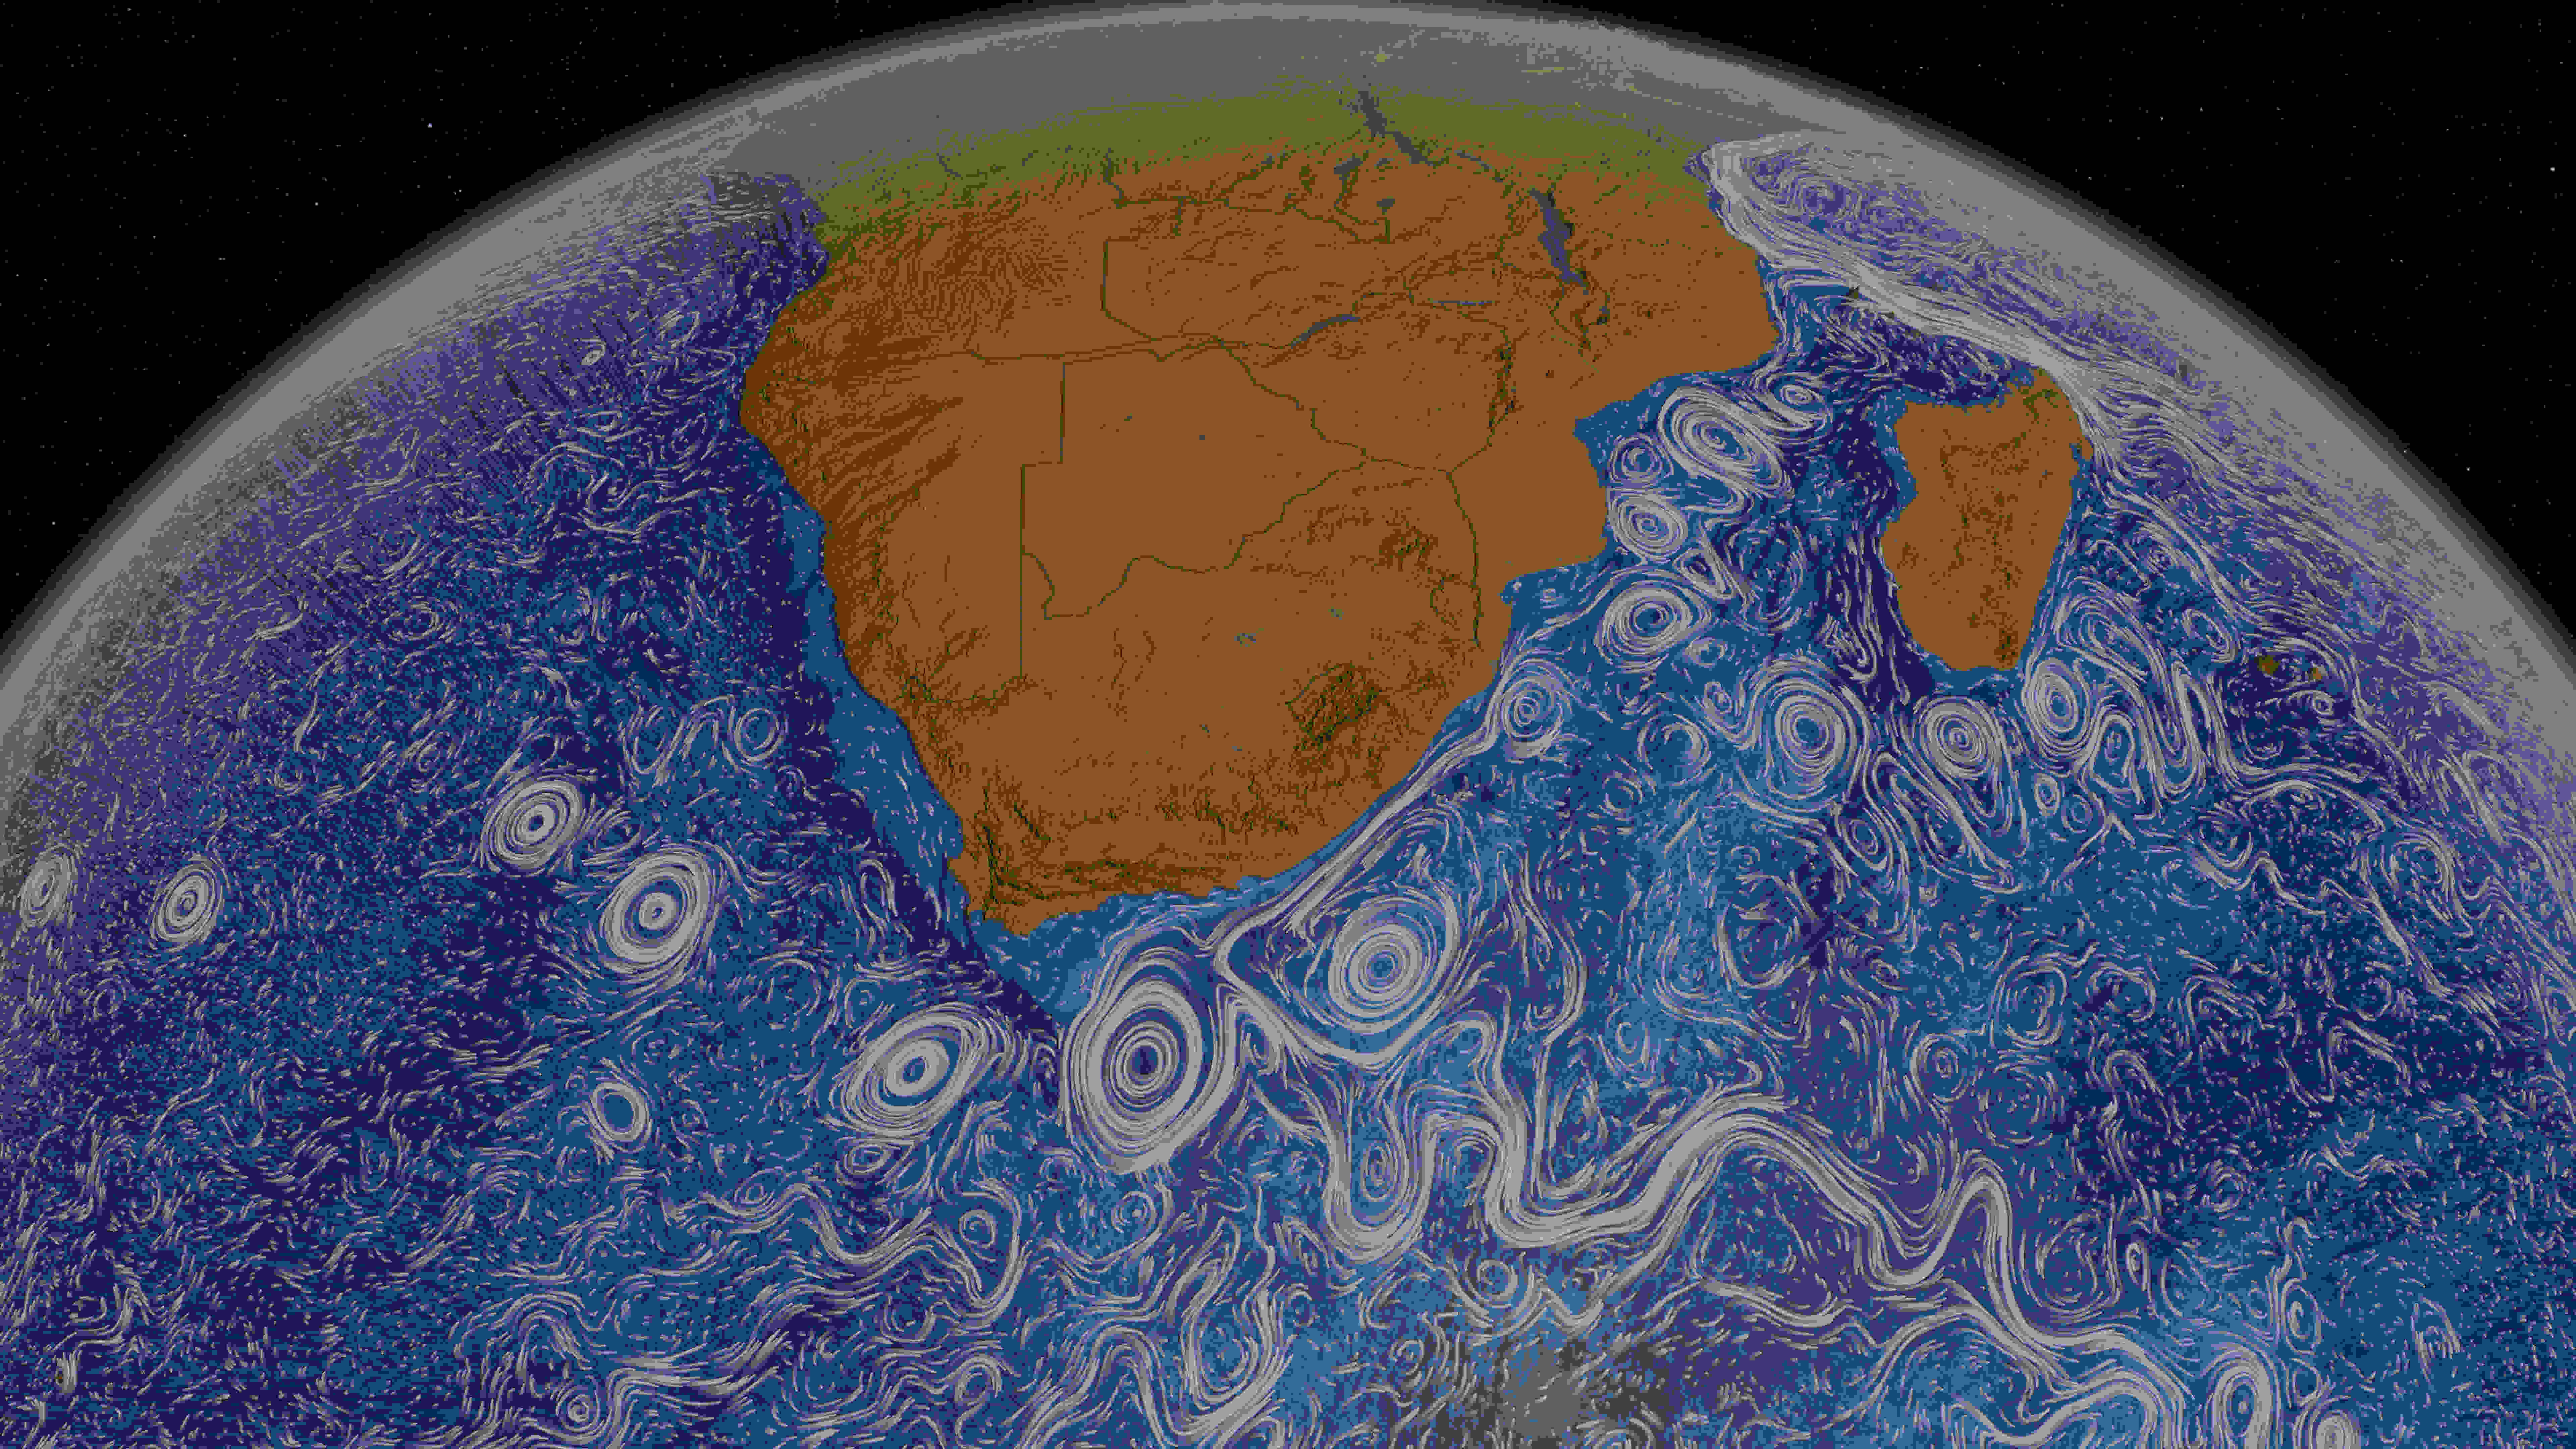
| 16:26, 3 June 2026 | AgulhasMesoScaleEddies.jpg (file) |  |
514 KB | Mesoscale eddies pinched off from meanders of the Agulhas current. Photo credit NASA. https://svs.gsfc.nasa.gov/3827/?utm | 1 |
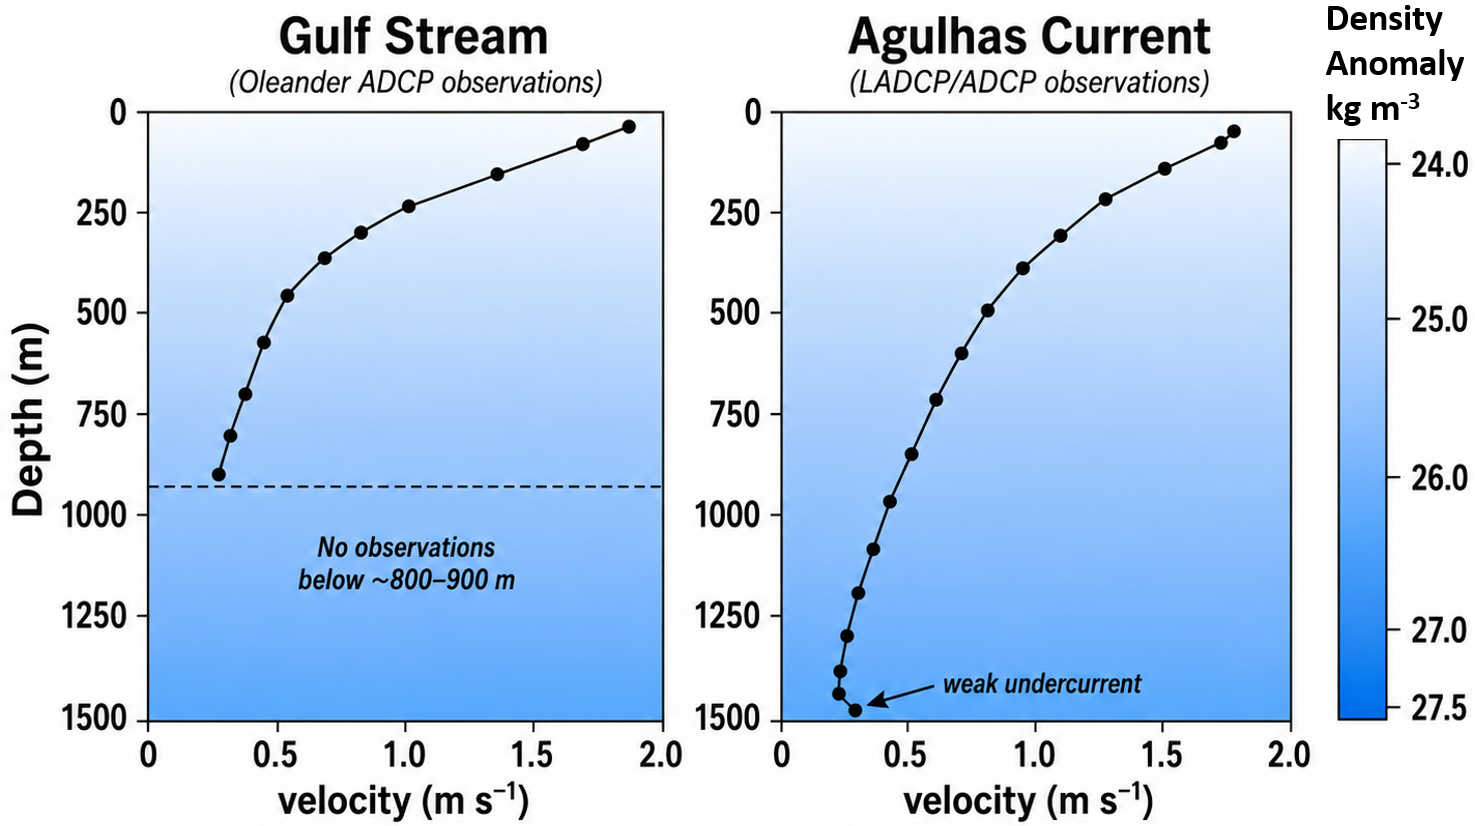
| 20:47, 27 May 2026 | WesternBoundaryCurrents.jpg (file) |  |
77 KB | Velocity profiles measured in the Gulf Stream (adapted from Rossby et al., 2019<ref>Rossby, T., Flagg, C.N., Donohue, K., Fontana, S., Curry, R., Andres, M. and Forsyth, J. 2019. Oleander is more than a flower: Twenty-five years of oceanography aboard... | 1 |
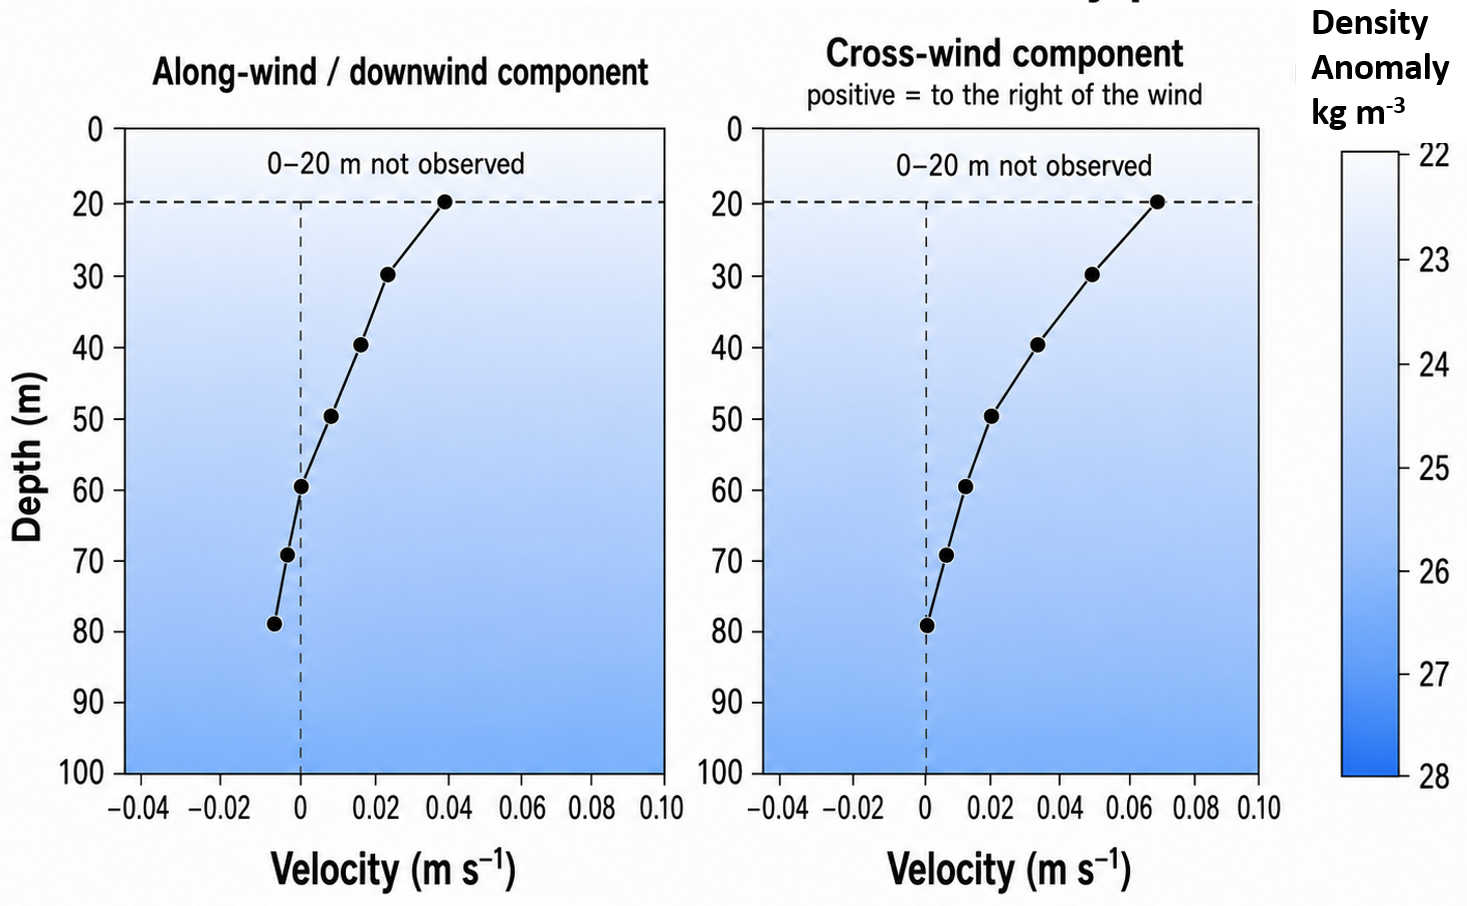
| 20:46, 27 May 2026 | OceanEkmanProfile.jpg (file) |  |
78 KB | Ekman mean velocity profiles measured at 10°N in the western/central tropical North Pacific. Adapted from (Price and Sundermeyer(1999<ref>Price, J.F. and Sundermeyer, M.A. 1999. Stratified Ekman layers. Journal of Geophysical Research: Oceans 104: 20,... | 1 |
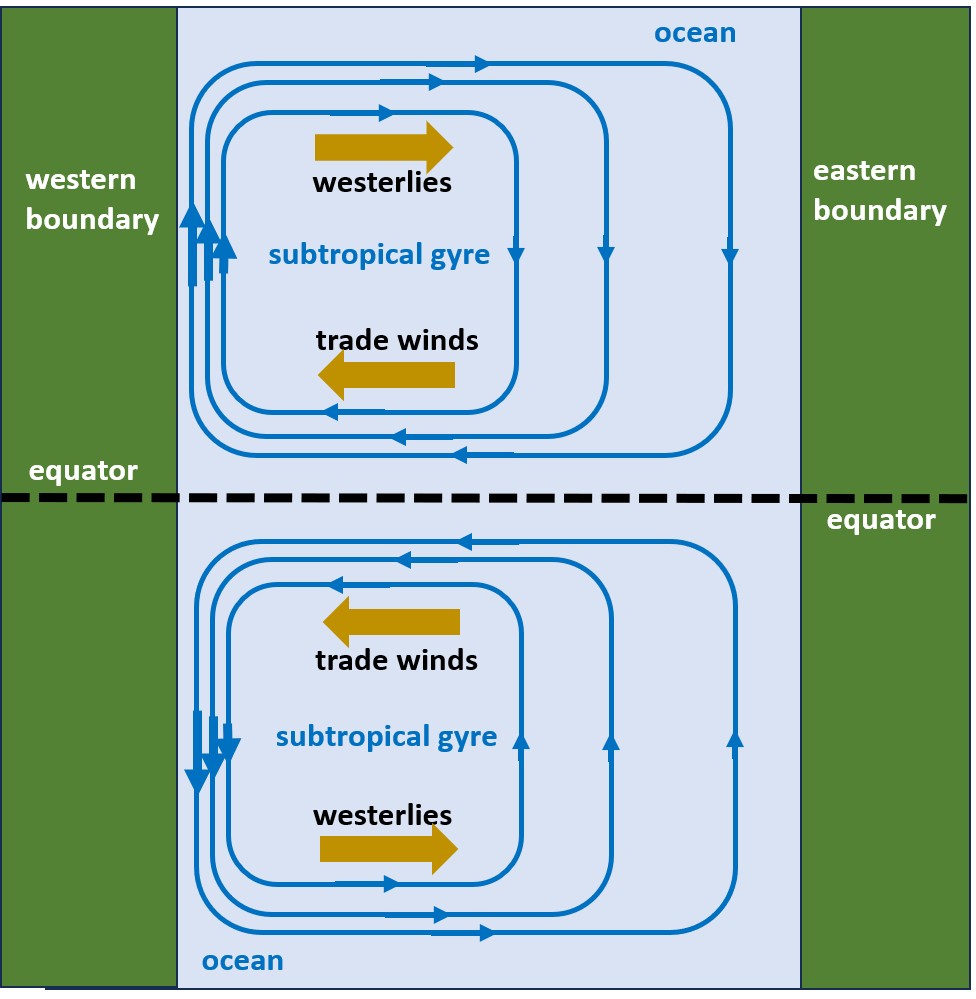
| 20:21, 21 May 2026 | SubtropicalGyres.jpg (file) |  |
127 KB | Schematic of subtropical gyres with western boundary currents trapped in a narrow band against the continental margin. | 1 |
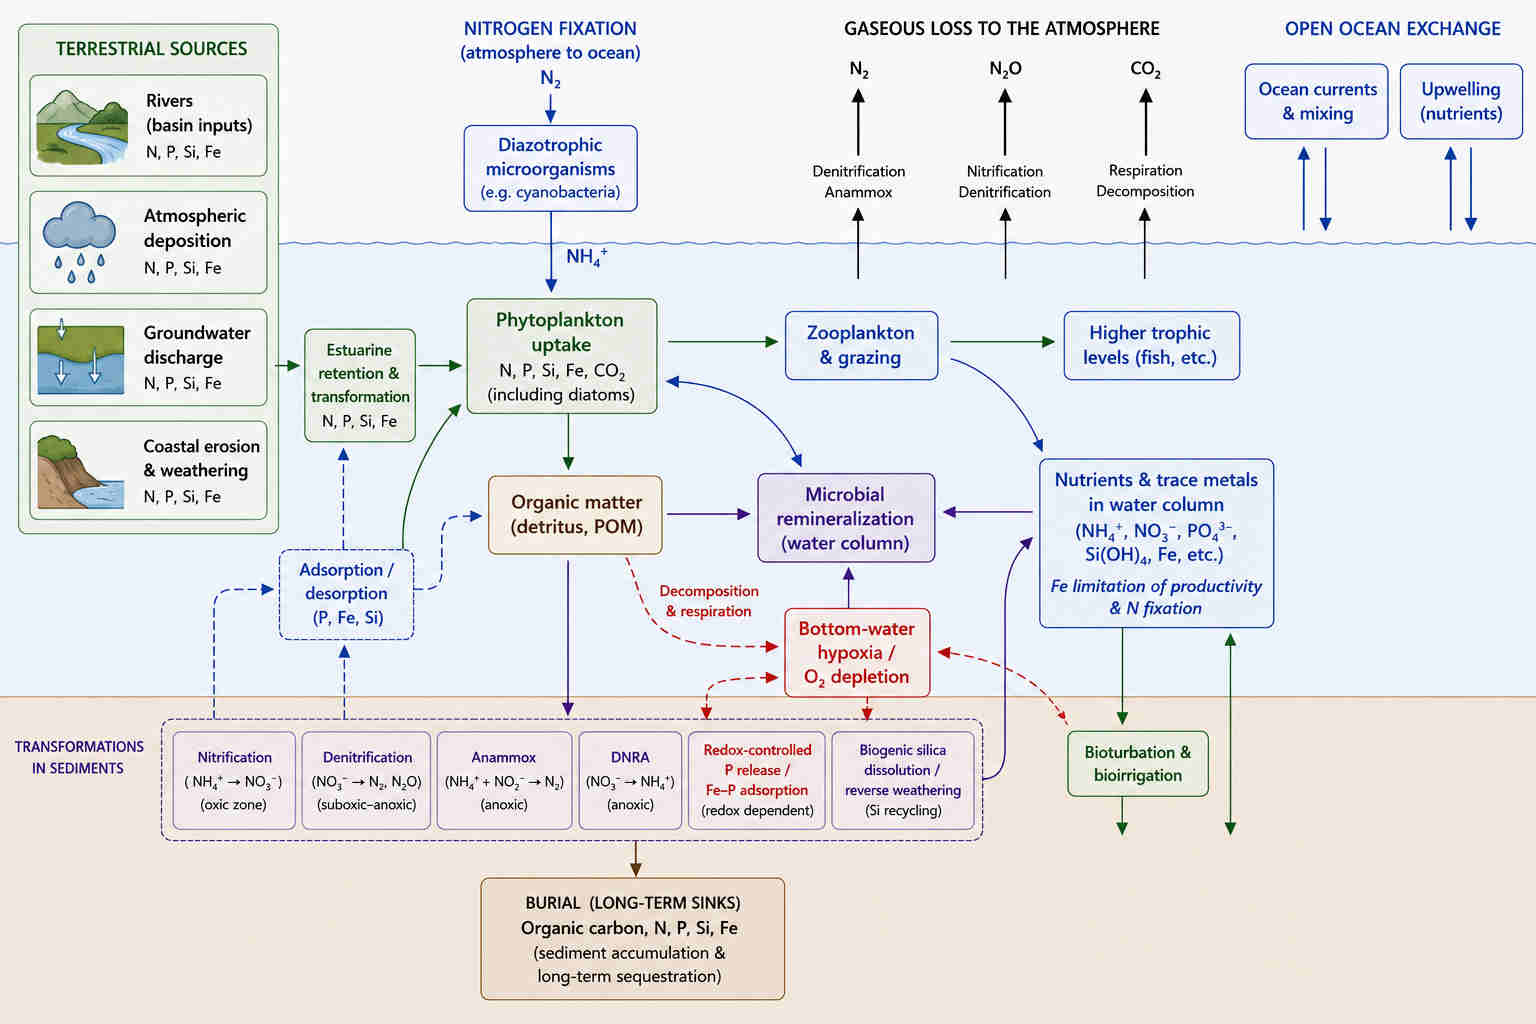
| 12:01, 17 May 2026 | NutrientCycleCZ.jpg (file) |  |
95 KB | Major pathways and processes involved in nutrient conversion in the coastal marine environment. | 1 |
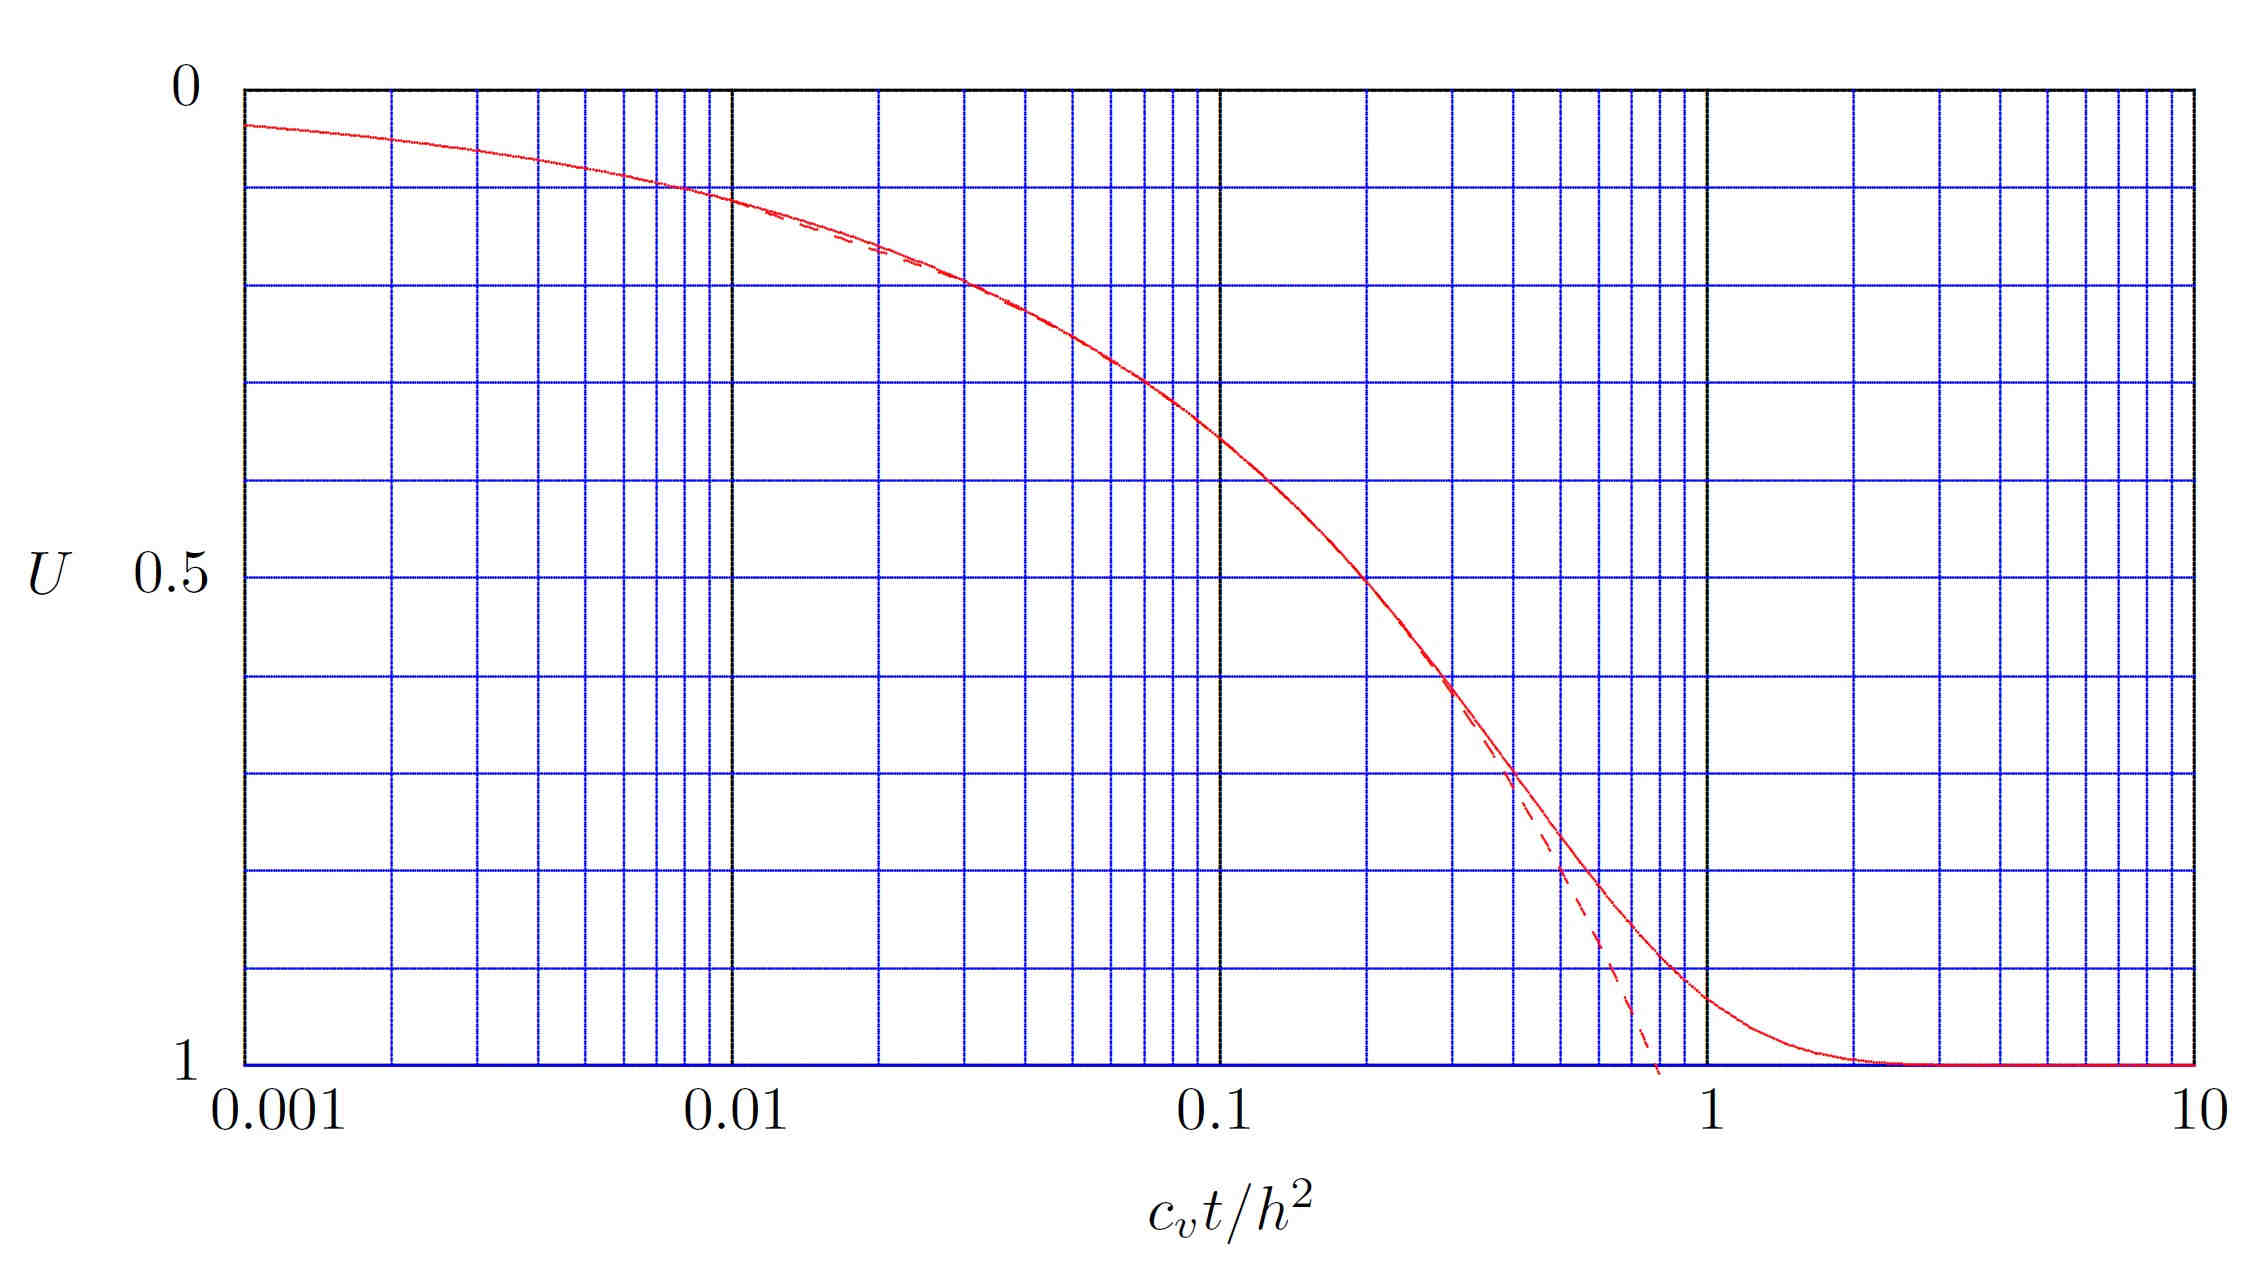
| 10:42, 27 April 2026 | MudConsolidation.jpg (file) |  |
173 KB | Theoretical mud consolidation curve. | 2 |
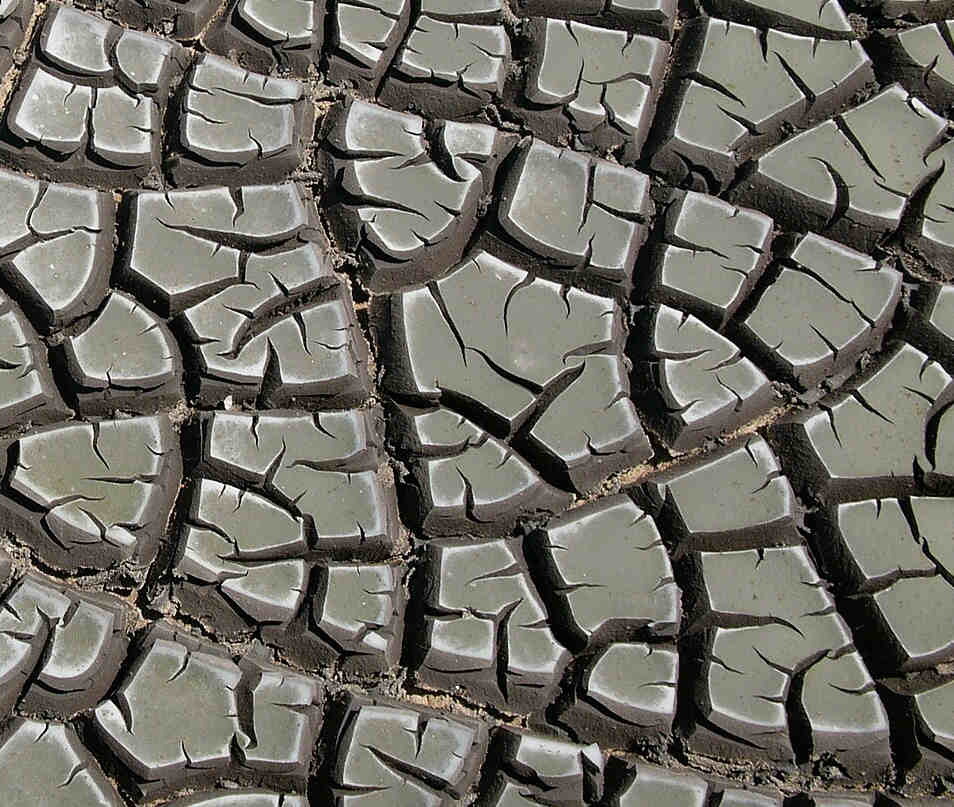
| 10:33, 27 April 2026 | MudCracks.jpg (file) |  |
88 KB | Crackled desiccated mud surface. Photo credit Hannes Grobe, Creative Commons Licence CC-BY-SA-2.5 | 1 |
| 21:27, 19 April 2026 | ApalachicolaBay.jpg (file) |  |
42 KB | Google Earth image of Apalachicola Bay, a large restricted lagoon on the Gulf coast of Florida. | 2 |
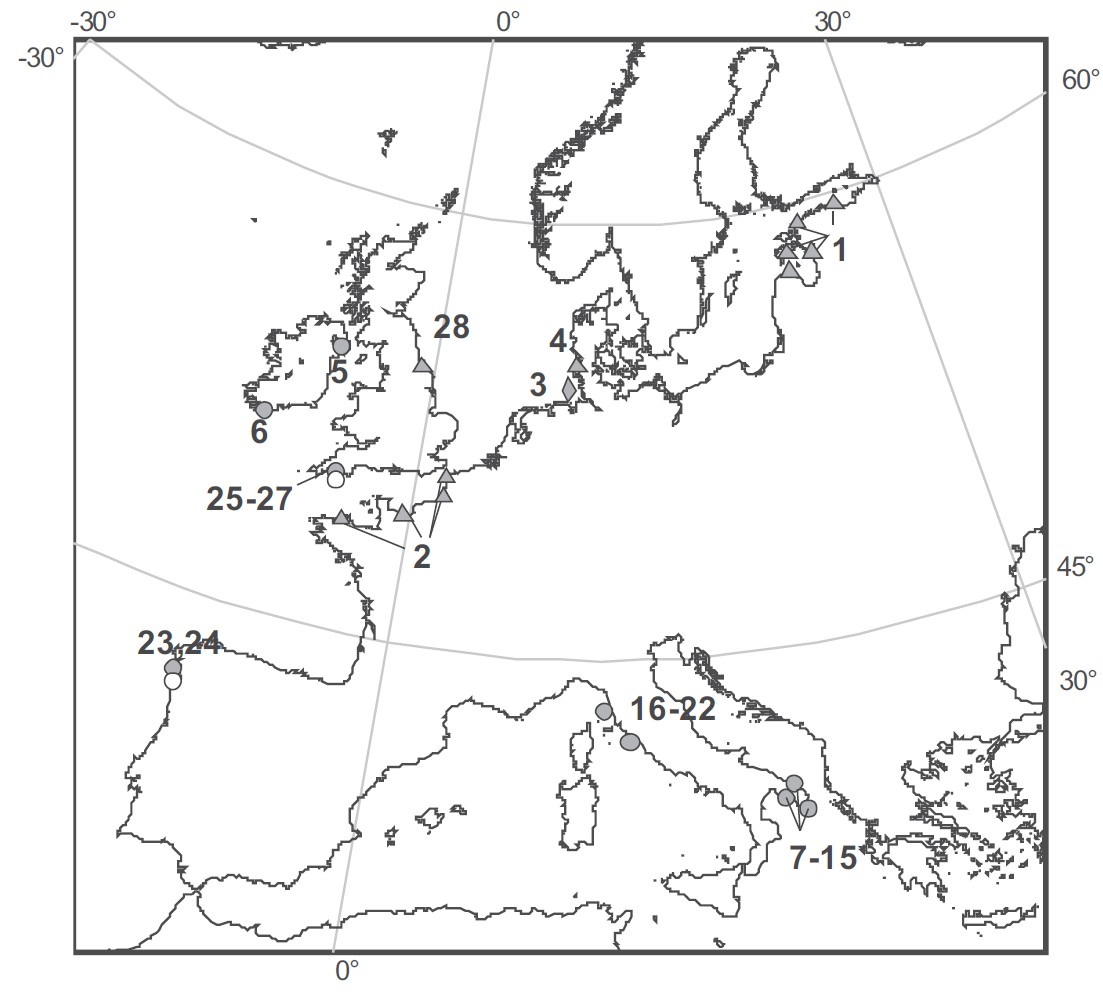
| 12:29, 15 April 2026 | BIOFUSEsamplingSites.jpg (file) |  |
141 KB | Sampling sites of the BIOFUSE project | 1 |
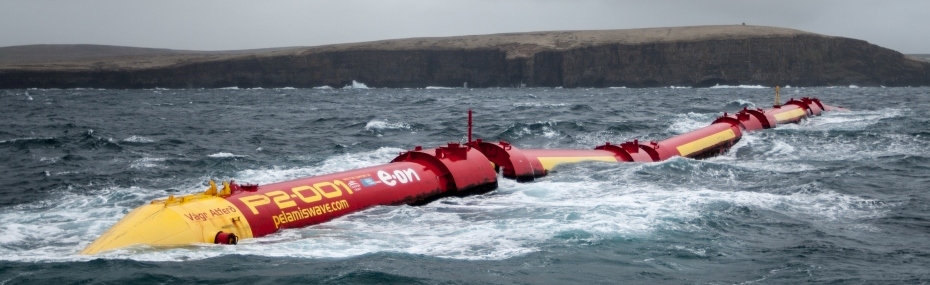
| 12:06, 1 April 2026 | Pelamis.jpg (file) |  |
170 KB | Pelamis wave energy converter | 1 |
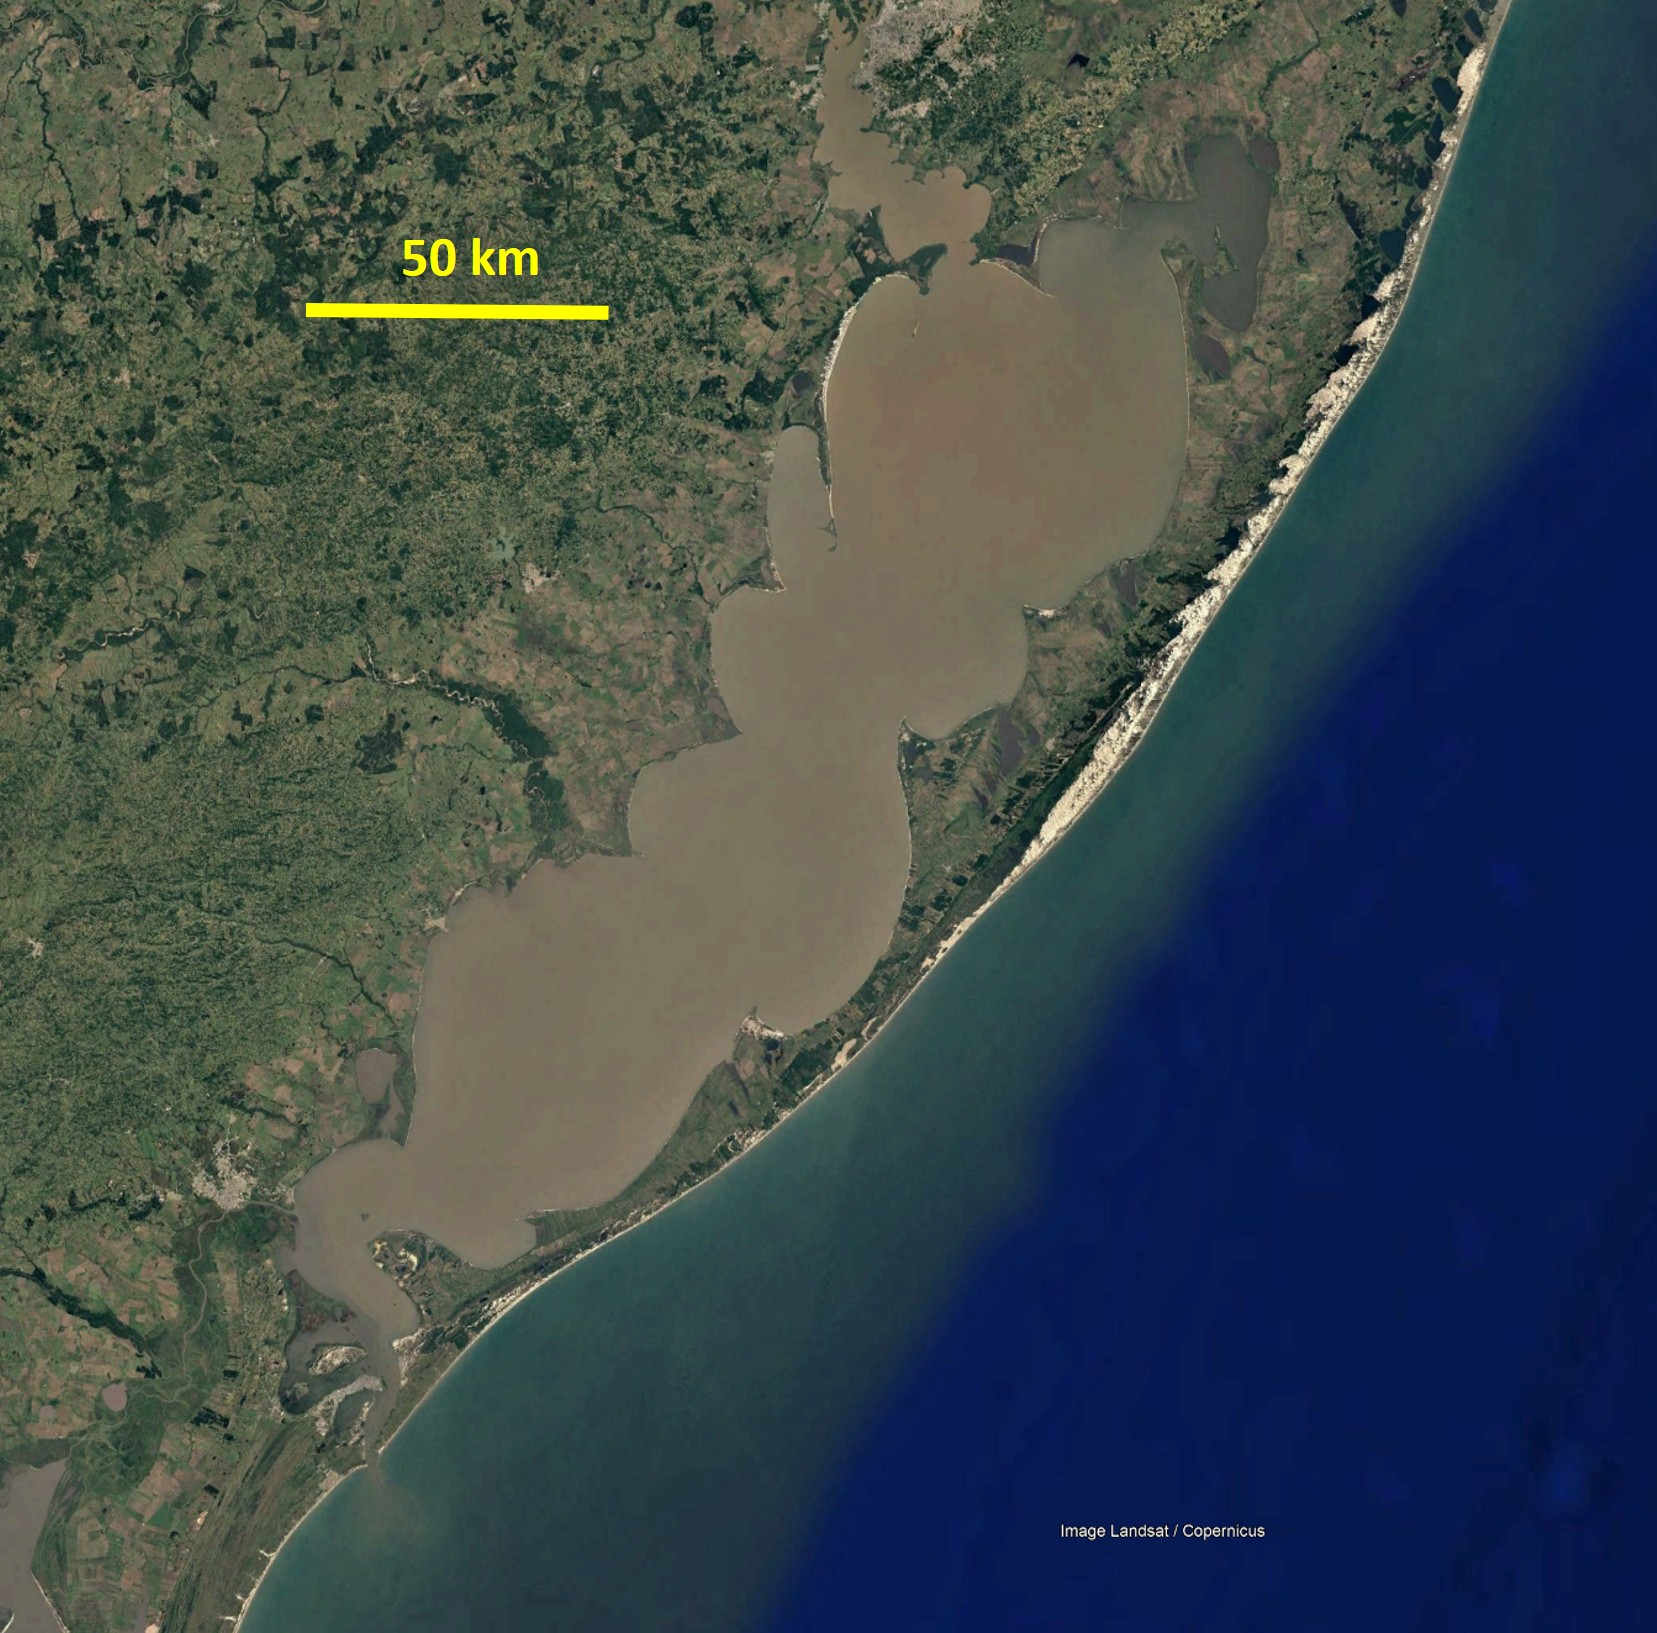
| 22:56, 26 March 2026 | LagoaDosPatos.jpg (file) |  |
499 KB | Google Earth image of Lagoa dos Patos, Brazil – the world's largest 'choked' lagoon. | 1 |
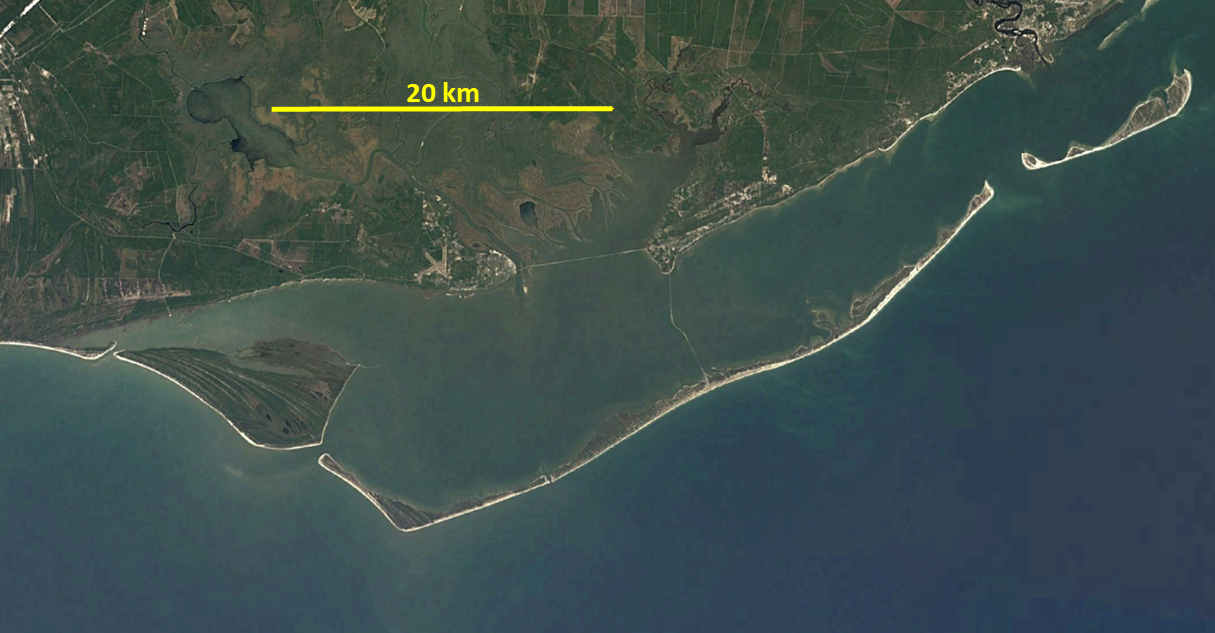
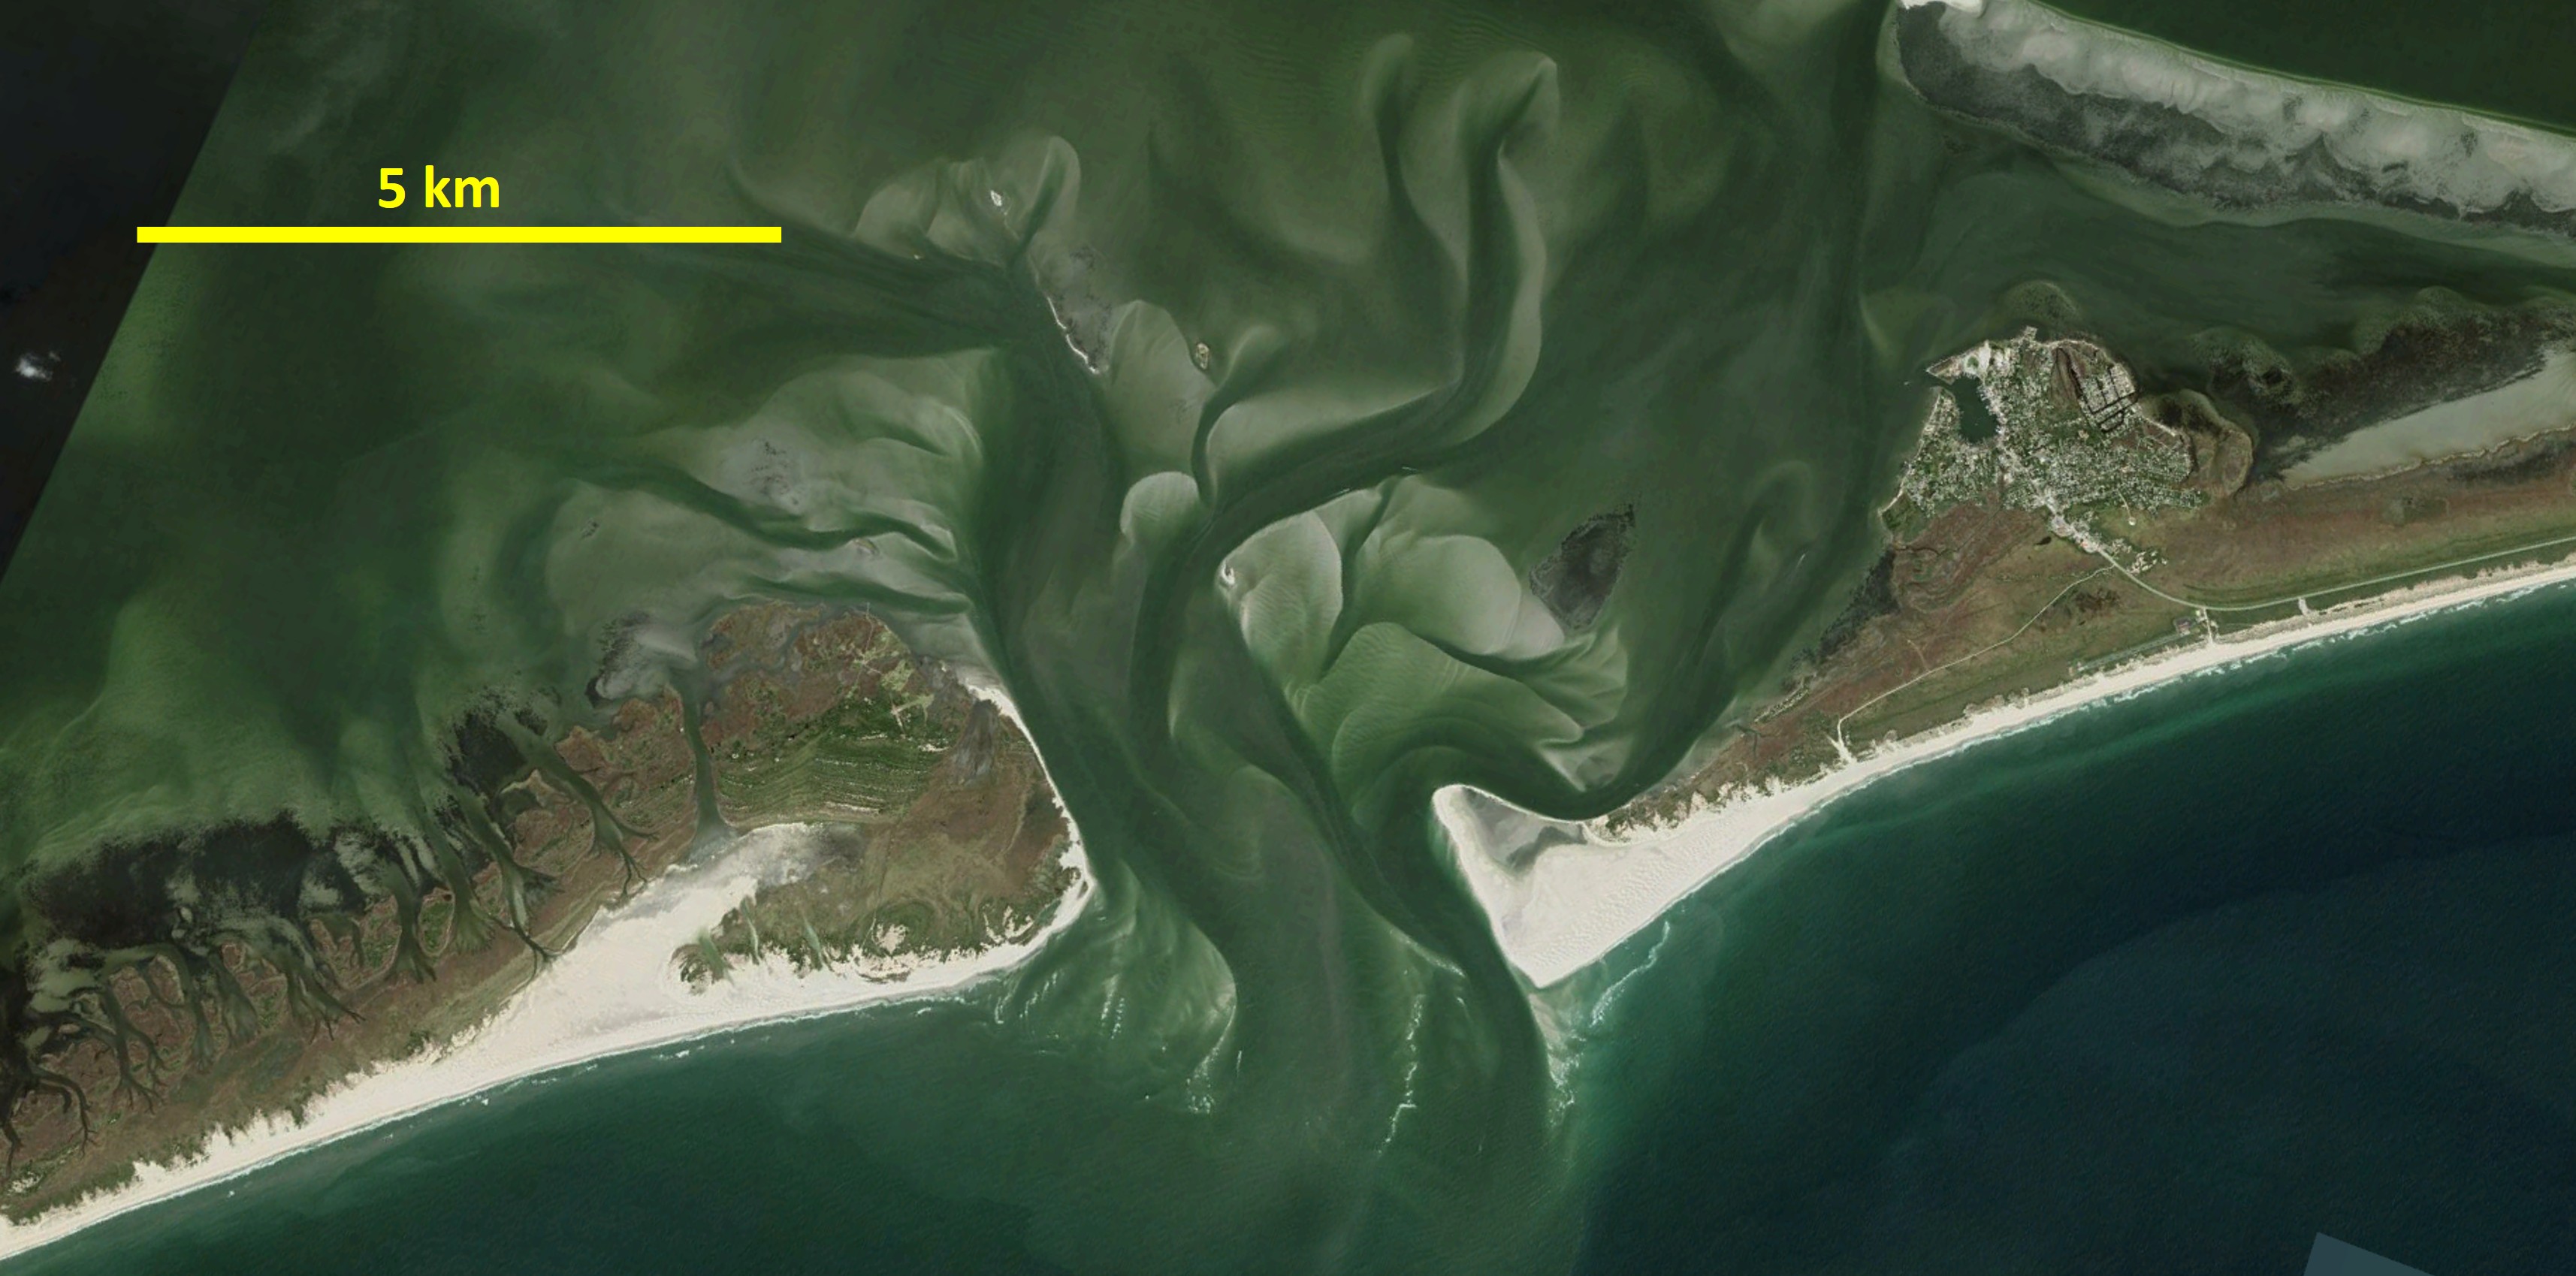
| 22:55, 26 March 2026 | OcracokePamlicoInlet.jpg (file) |  |
713 KB | Google Earth image of Ocracoke inlet of Pamlico Sound, USA – a constricted lagoon. | 1 |
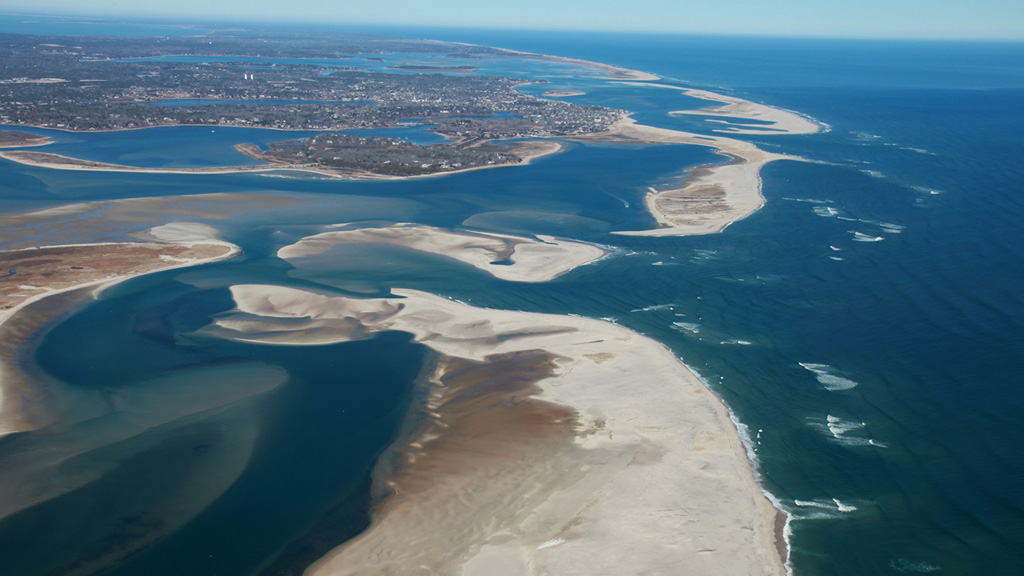
| 10:58, 25 March 2026 | LagoonsCapeCod.jpg (file) |  |
193 KB | Lagoons along the shore of Cape Cod (USA). Photo credit Spencer Kennard, Kelsey-Kennard Photo-Gallery. NASA's Earth Observatory | 1 |
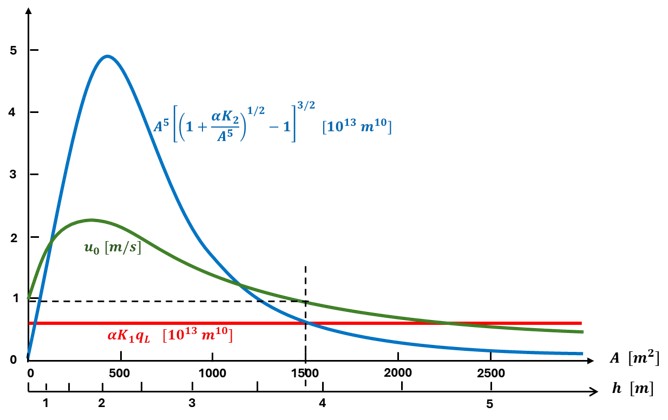
| 22:34, 21 March 2026 | InletEquilibriumCurve.jpg (file) |  |
35 KB | Lagoon inlet cross-section and velocity equilibrium curves | 1 |
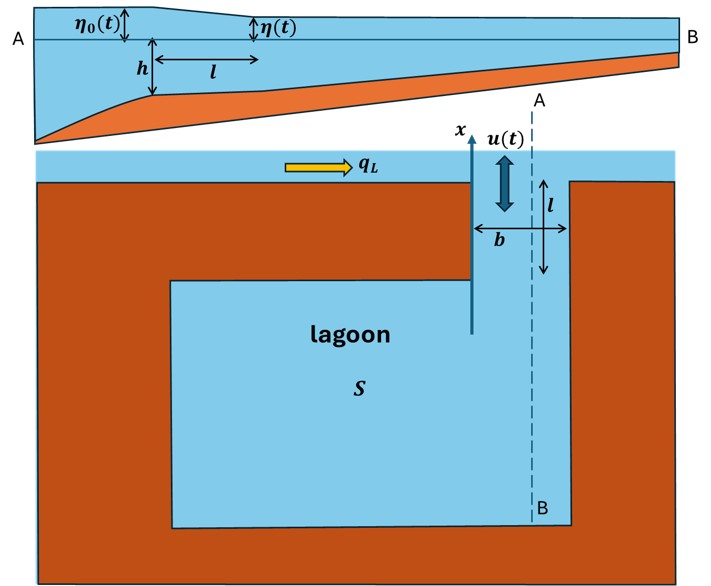
| 00:15, 21 March 2026 | LagoonLayoutSymbols.jpg (file) |  |
46 KB | Schematic lagoon layout and symbols. Top: Longitudinal section along A-B. Bottom: Plan view. | 1 |
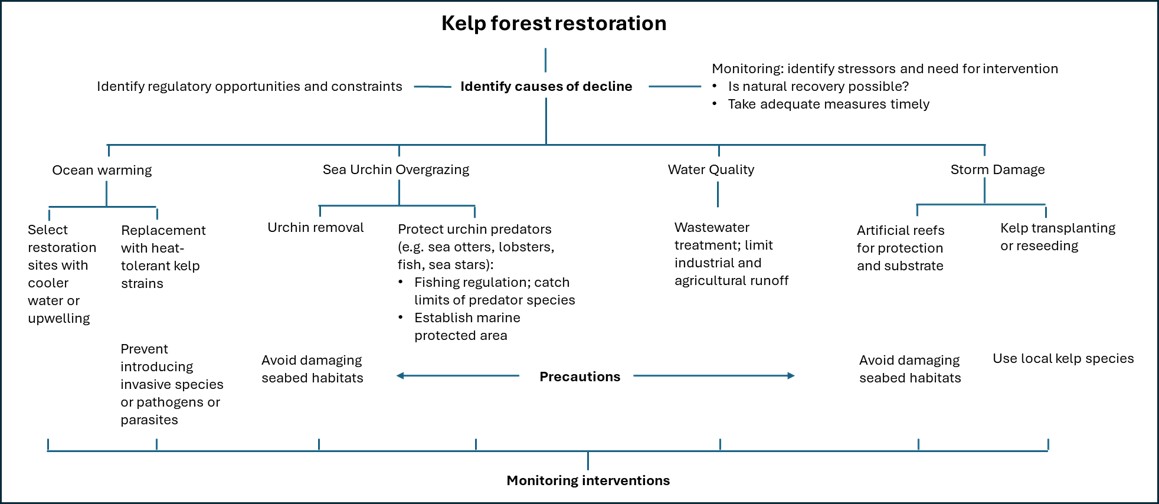
| 17:11, 15 March 2026 | KelpRestoration.jpg (file) |  |
94 KB | Process scheme of recommended actions and interventions for kelp forest restoration | 1 |
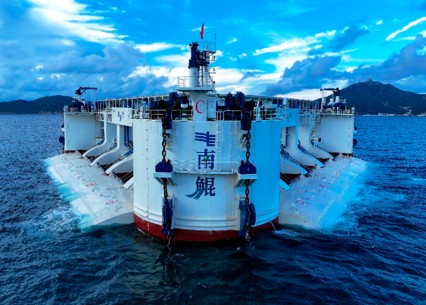
| 12:55, 7 March 2026 | NankunWEC.jpg (file) |  |
48 KB | The 1-MW wave energy converter (WEC) Nankun, also known as Sharp Eagle, consists of multiple wave-energy-absorbing buoys mounted on a semi-submersible floating platform. The name 'Sharp Eagle' refers to the shape and pitching motion of the buoys.<ref n... | 1 |
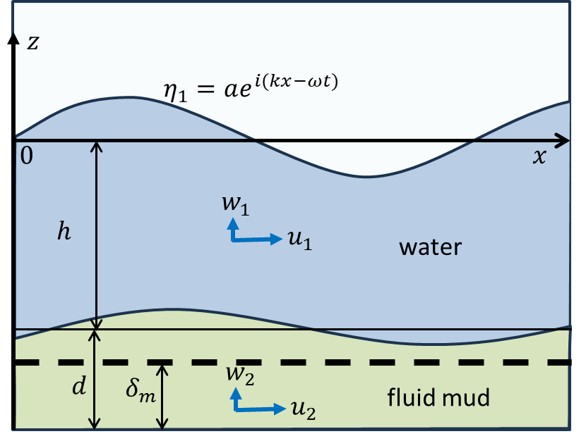
| 18:16, 15 February 2026 | MudLayer.jpg (file) |  |
34 KB | Definition sketch of wave propagation over a thin fluid mud layer. | 1 |
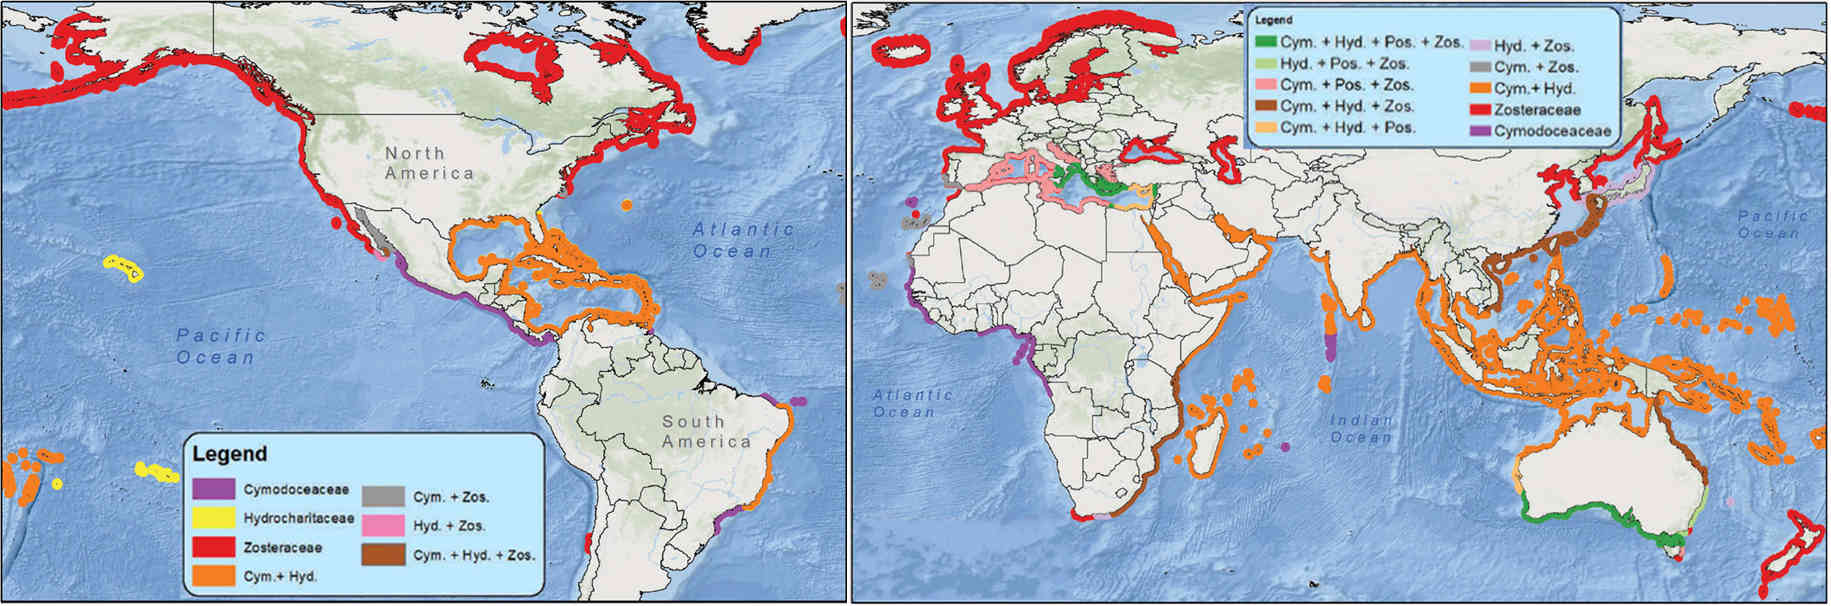
| 12:11, 9 February 2026 | SeagrassGlobalDistribution.jpg (file) |  |
129 KB | Global distribution of seagrass species. Data Source: IUCN, Map created by T. Bakirman. https://doi.org/10.1080/22797254.2018.1544838 Creative Commons Licence. | 1 |