File list
This special page shows all uploaded files.
| Date | Name | Thumbnail | Size | User | Description | Versions |
|---|---|---|---|---|---|---|
| 17:04, 8 May 2023 | NAOspectrum.jpg (file) |  |
63 KB | Dronkers J | Global NAO spectrum based on wavelet analysis of the NAO index annual time series for the period 1860-2005. Redrawn after Massei et al. (2007). | 1 |
| 16:24, 5 May 2023 | AlexandriaAbuQirBeach.JPG (file) |  |
385 KB | Dronkers J | Abu Qir beach, Alexandria. | 1 |
| 14:12, 5 May 2023 | SymphonyOfTheSeas.jpg (file) |  |
99 KB | Dronkers J | The mega-cruise ship Royal Caribbean’s Symphony of the Seas. Photo credit Darthvadrouw, Creative Commons Licence. | 1 |
| 11:42, 4 May 2023 | BuoyMotion.jpg (file) |  |
74 KB | Dronkers J | Balance of vertical forces on a buoy in a wave field. | 1 |
| 09:36, 4 May 2023 | BuoyantBody.jpg (file) |  |
75 KB | Dronkers J | Balance of vertical forces on a buoyant body in a wave field . | 1 |
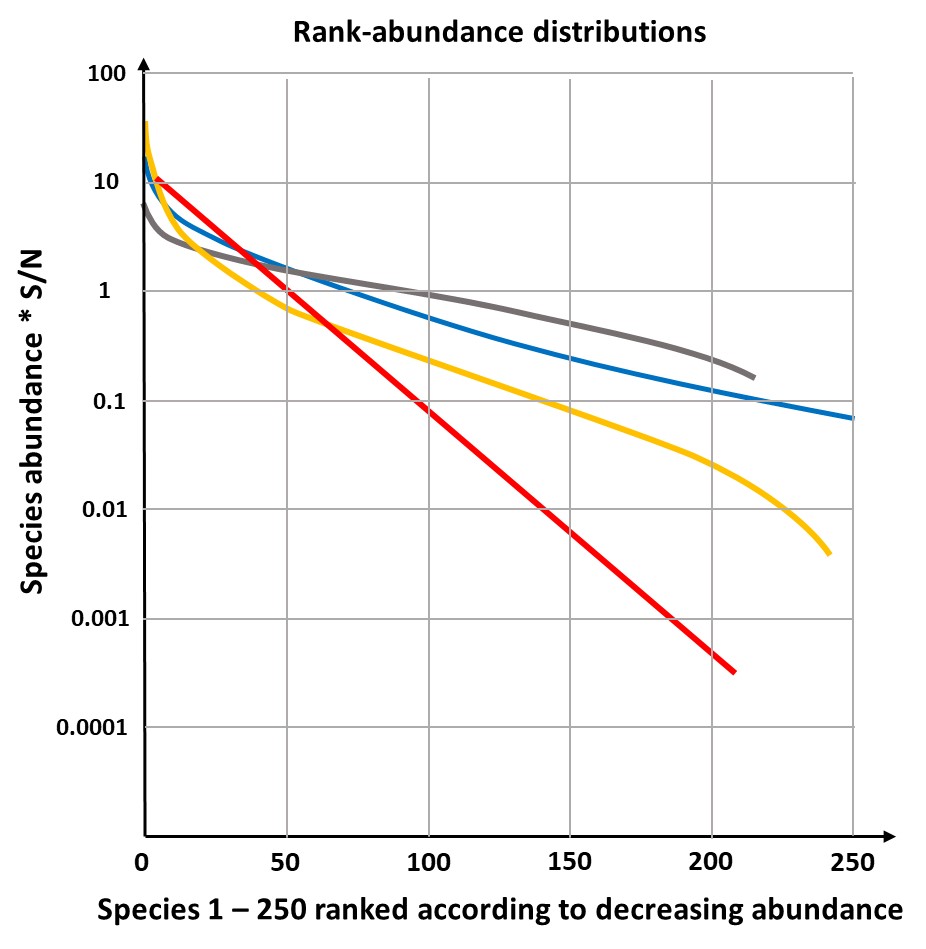
| 17:07, 27 April 2023 | RankAbundanceDistributions.jpg (file) |  |
95 KB | Dronkers J | Rank-abundance distributions according to the four models 'log series model' (blue curve), 'log-normal model' (yellow curve), 'geometric model' (red curve) and 'broken-stick model' (grey curve). | 2 |
| 10:32, 25 April 2023 | HypoxiaNutrientConversion.jpg (file) |  |
133 KB | Dronkers J | Schematic influence hypoxia on nutrient conversion. OM=organic matter. Redrawn after Dai et al. (2023). | 1 |
| 21:11, 23 April 2023 | GoldCoastCyclone.jpg (file) |  |
64 KB | Dronkers J | Gold Coast, Australia, before and after the June 1967 cyclone. Observed shoreface profiles showing recovery of the initial close-to-equilibrium profile after strong perturbation by an extreme event. Redrawn after Patterson, D.C. and Nielsen, P. (2016). | 1 |
| 10:24, 20 April 2023 | UpperLowerShoreface.jpg (file) |  |
46 KB | Dronkers J | Theoretical equilibrium profile for the upper and lower shoreface. | 1 |
| 19:47, 18 April 2023 | RarefactionPlot.jpg (file) |  |
43 KB | Dronkers J | Rarefaction plot. Red: Benthic community altered by increased organic input. Blue: Benthic community recovering after abatement of organic input. Redrawn after Pierson and Rosenberg (1978). | 1 |
| 19:45, 18 April 2023 | BiomassAbundancePlot.jpg (file) |  |
53 KB | Dronkers J | Comparison of k-dominance for abundance and biomass. a. Typical plot for a healthy ecosystem. b. Typical plot for a stressed degraded ecosystem. Redrawn after Warwick 1986. | 1 |
| 16:38, 7 April 2023 | Nodal-tide-estimate-nl.png (file) |  |
83 KB | FedorBaart | 1 | |
| 16:20, 24 March 2023 | MoonDeclination.jpg (file) |  |
131 KB | Dronkers J | Schematic of tide generation for different (exagerated) moon declinations. | 1 |
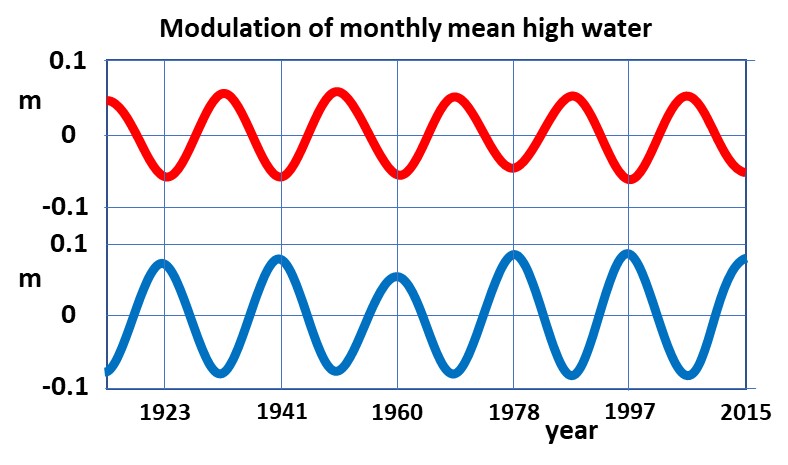
| 22:28, 23 March 2023 | MMMHW.jpg (file) |  |
75 KB | Dronkers J | Modulation of the monthly mean high water by the lunar nodal cycle. Blue curve: Case of semidiurnal tidal dominance (e.g. Brest, France). Red curve: Case of diurnal dominance (e.g. Victoria, Canada). Adapted from Peng et al. (2019) | 1 |
| 11:47, 27 February 2023 | YieldStressProbes.jpg (file) |  |
75 KB | Dronkers J | Measurement devices for in situ yield stress determination. Left: Graviprobe. Right: Rheotune. From Kirichek, A., Shakeel, A. and Chassagne, C. 2020. Using in situ density and strength measurements for sediment maintenance in ports and waterways. J. So... | 1 |
| 11:46, 27 February 2023 | NauticalDepthScheme.jpg (file) |  |
53 KB | Dronkers J | Illustration of nautical depth. From Kirichek, A., Shakeel, A. and Chassagne, C. 2020. Using in situ density and strength measurements for sediment maintenance in ports and waterways. J. Soils Sediments 20: 2546–2552, Creative Commons International... | 1 |
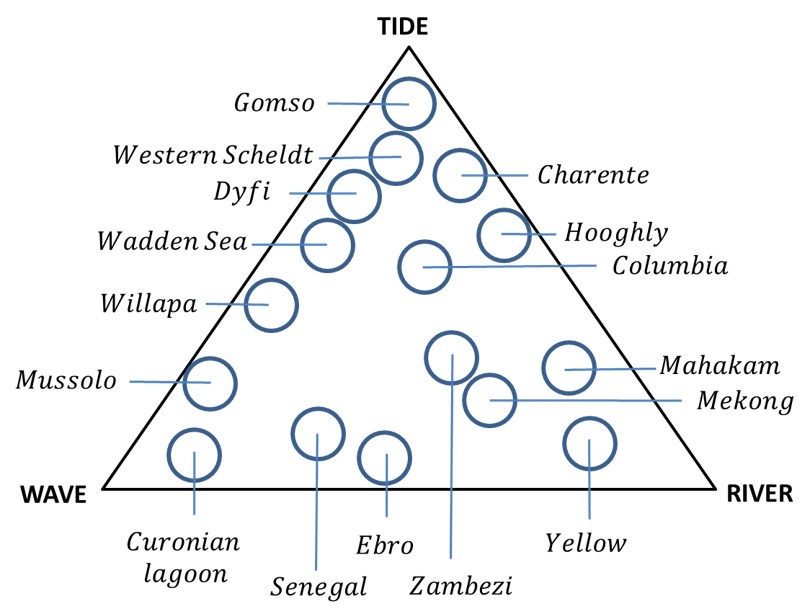
| 15:52, 21 February 2023 | EstuaryClassification.jpg (file) |  |
75 KB | Dronkers J | Estuary classification scheme. | 1 |
| 18:32, 18 February 2023 | TideEstuary.jpg (file) |  |
85 KB | Dronkers J | Schematic plan view of a tide-dominated estuary. | 1 |
| 18:31, 18 February 2023 | TideRiverEstuary.jpg (file) |  |
115 KB | Dronkers J | Schematic plan view of a tide- and river-dominated estuary. | 1 |
| 18:30, 18 February 2023 | WaveTideEstuary.jpg (file) |  |
62 KB | Dronkers J | Schematic plan view of a wave- and tide-dominated estuary. | 1 |
| 18:30, 18 February 2023 | RiverWaveEstuary.jpg (file) |  |
62 KB | Dronkers J | Schematic plan view of a river- and wave-dominated estuary. | 1 |
| 18:29, 18 February 2023 | RiverEstuary.jpg (file) |  |
84 KB | Dronkers J | Schematic plan view of a river-dominated estuary. | 1 |
| 18:29, 18 February 2023 | WaveEstuary.jpg (file) |  |
58 KB | Dronkers J | Schematic plan view of a wave-dominated estuary (oblique wave incidence). | 1 |
| 12:29, 7 February 2023 | BedformFormation.jpg (file) |  |
116 KB | Dronkers J | Schematic representation of bedform formation. Top: Steady flow from left to right. Two successive stages of bed perturbation developement are brown and yellow, respectively. The dark-blue dotted line is a near-bed streamline. The dark-blue arrows are... | 1 |
| 11:37, 2 February 2023 | PolicyOrganizationModels.jpg (file) | 156 KB | Dronkers J | Four alternative models for science-policy interaction. Red=Policy, Blue=Research, Green=Broker. After Cvitanovic et al. 2015. | 1 | |
| 16:13, 31 January 2023 | TransientLiquefaction.jpg (file) | 161 KB | Dronkers J | Principle of transient soil liquefaction. After De Groot et al. 2006. | 1 | |
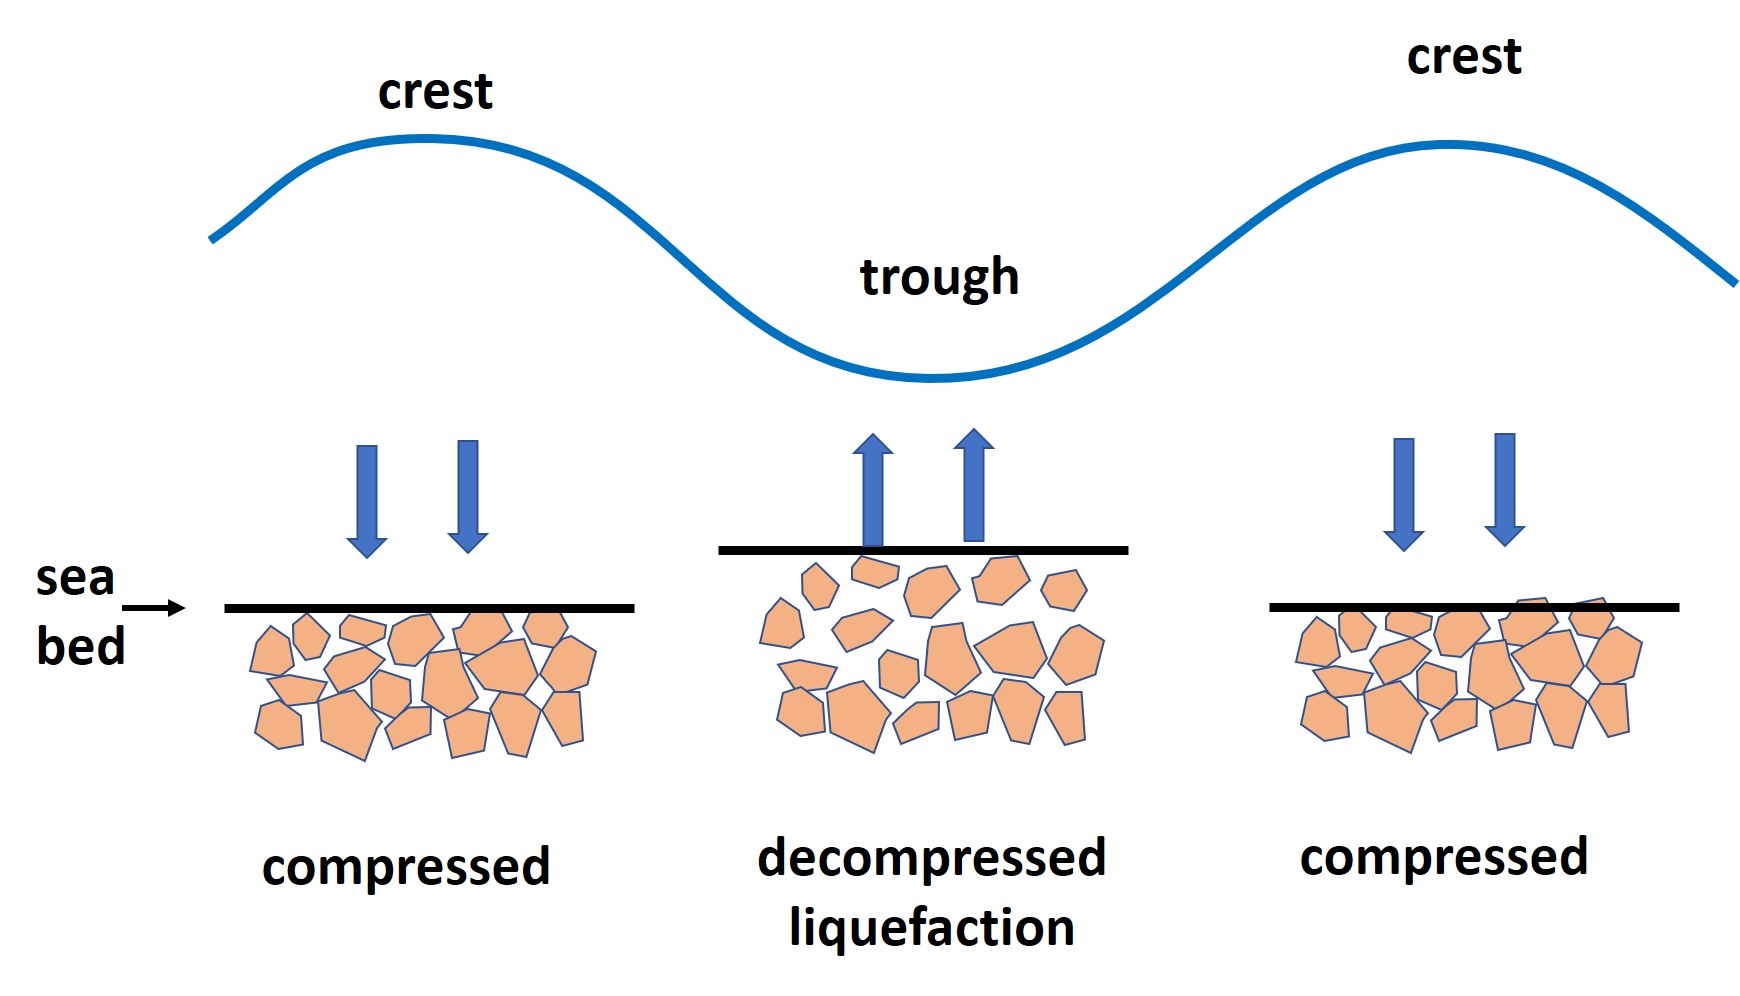
| 16:11, 31 January 2023 | ResidualLiquefaction.jpg (file) |  |
114 KB | Dronkers J | Residual liquefaction process of a silt-clay soil. Silt grains are yellow and clay particles are red. Left panel: Initial loosely packed silt-clay soil. Middle panel: Grain contact points are broken due to wave-induced grain rearrangement and pore pres... | 1 |
| 20:27, 27 January 2023 | BreakwaterOvertopDef.jpg (file) |  |
169 KB | Dronkers J | Waves overtopping a breakwater; definition of symbols. | 1 |
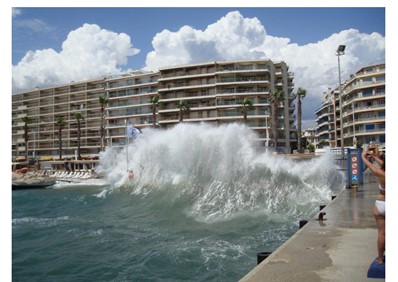
| 19:50, 29 December 2022 | WaveCollisionShock.jpg (file) |  |
63 KB | Dronkers J | Schematic of a wave breaking on a vertical wall. | 1 |
| 17:39, 29 December 2022 | WaveSplash.jpg (file) |  |
37 KB | Dronkers J | Wave splashing on a vertical wall. Photo Niels Mejlhede Jensen. | 1 |
| 22:27, 28 December 2022 | GlobalMeanWavePower.jpg (file) |  |
135 KB | Dronkers J | Mean wave power over the 30-year time interval considered (1989–2018) based on date from ERA5 (i.e.,ECMWF RE-analysis, fifth generation). From: Rusu, L. and Rusu, E. 2021. Evaluation of the Worldwide Wave Energy Distribution Based on ERA5 Data and Al... | 1 |
| 19:15, 28 December 2022 | VAPWEC.jpg (file) |  |
76 KB | Dronkers J | Vertical Axis Pendulum WEC (VAPWEC) | 1 |
| 12:16, 27 December 2022 | BarFormationTransports.jpg (file) | 462 KB | Dronkers J | Schematic of the major bar-building sediment transport processes. | 1 | |
| 21:42, 11 December 2022 | BruunRuleDefinition.jpg (file) |  |
211 KB | Dronkers J | Schematic representation of the shoreface shift in response to sea-level rise. The shaded eroded and deposited volumes are equal. The vertical/horizontal scale ratio is greatly exaggerated. | 1 |
| 16:33, 7 December 2022 | WedgeLengthObsMod6.jpg (file) |  |
109 KB | Dronkers J | Dimensionless salt wedge length for a prismatic estuary according to the analytic model and observed salt wedge lengths in the Rhône, Ebro, the Mississippi, Magdalena and Neretva estuaries at different discharges (corresponding to different internal r... | 1 |
| 16:35, 14 November 2022 | WedgeLengthObsMod.jpg (file) |  |
102 KB | Dronkers J | Dimensionless salt wedge length for a prismatic estuary and observed salt wedge lengths in the Rhône, Ebro, Mississippi and Magdalena estuaries at different discharges. | 2 |
| 15:32, 11 October 2022 | MarshErosionMontSaintMichel.jpg (file) |  |
159 KB | Dronkers J | Marsh retreat in the southern part of the bay of Mont-Saint-Michel caused by an adjacent meandering tidal channel in the period 2019-2022 and marsh accretion in the north. The left triangle indicates the Mont-Saint-Michel and the right triangle the Poi... | 1 |
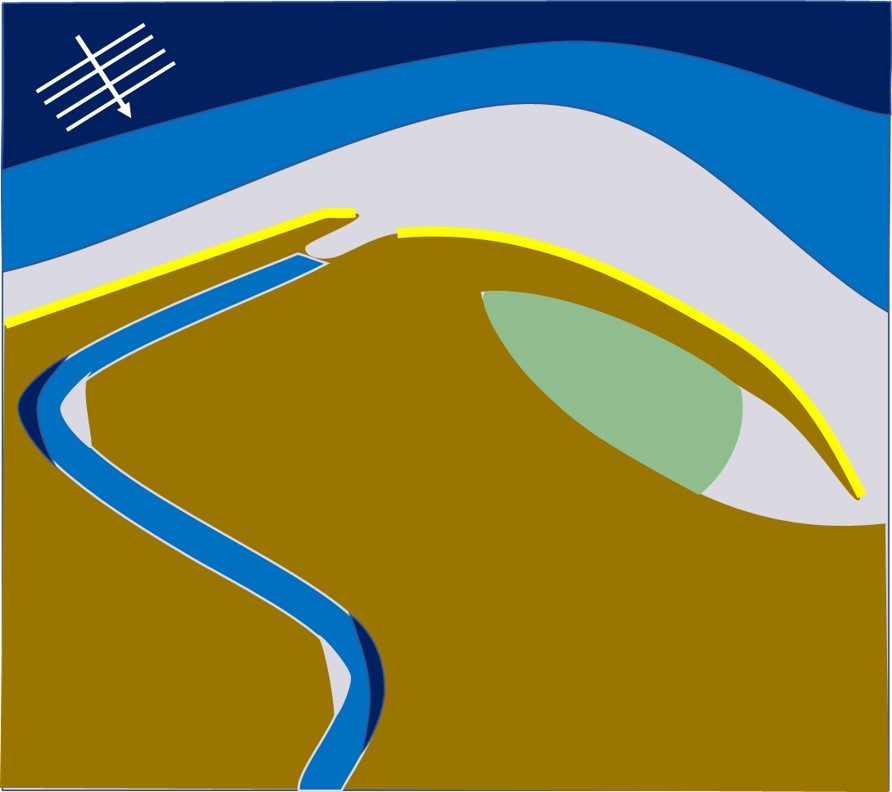
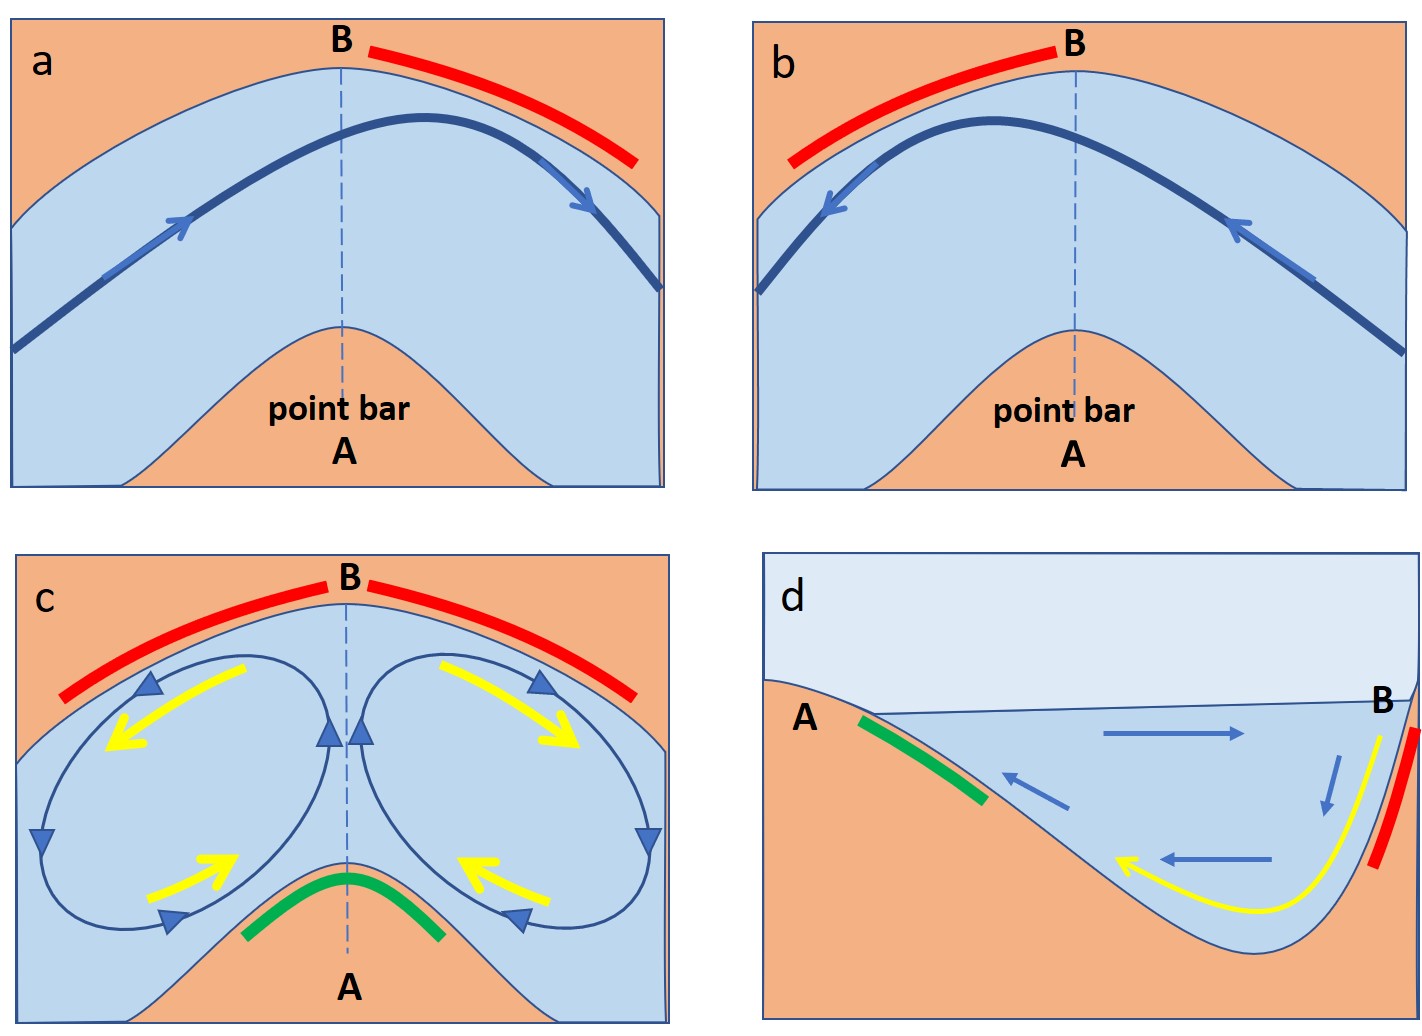
| 15:08, 11 October 2022 | TidalBendFlow.jpg (file) |  |
162 KB | Dronkers J | Schematic representation of tidal flow and sediment transport in a channel bend. a: flood flow path; b: ebb flow path; c: horizontal pattern of residual fluid flow (blue) and net sediment transport (yellow); d: cross-channel pattern of residual flow (... | 1 |
| 21:27, 10 October 2022 | MeandersMontSaintMichel.jpg (file) | 113 KB | Dronkers J | Dynamic meander pattern of tidal channels in the eastern part of the bay of Mont-Saint-Michel. Tidal channel are dark blue. | 1 | |
| 19:29, 9 October 2022 | GlobalDistributionSaltMarshes.jpg (file) |  |
203 KB | Dronkers J | Global distribution of salt marshes. From Mcowen et al. 2017. Creative Commons Licence https://creativecommons.org/licenses/by-nc/3.0/ | 1 |
| 09:51, 9 October 2022 | BeachCuspSwashScheme.jpg (file) |  |
159 KB | Dronkers J | Schematic representation of a beach cusp with wave uprush and downrush. | 2 |
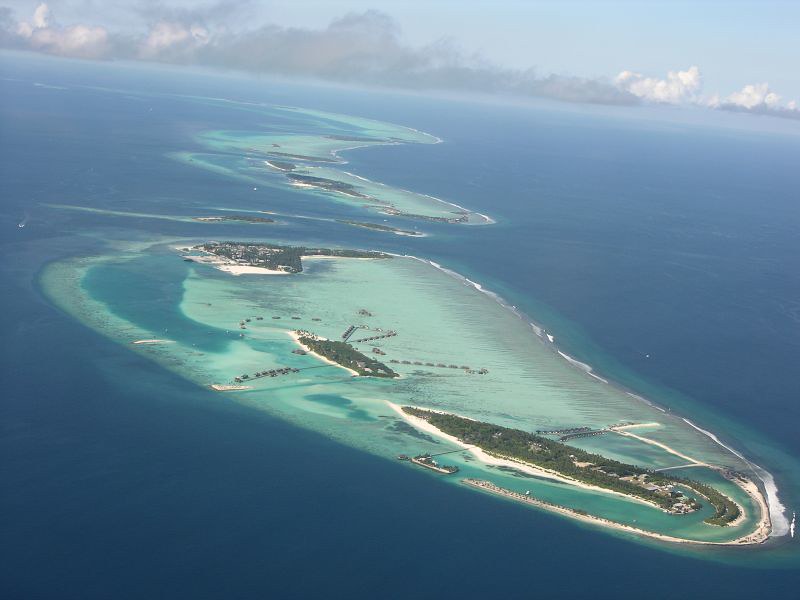
| 09:18, 6 October 2022 | Maldives FabioDiLupo.jpg (file) |  |
53 KB | Dronkers J | Maldives archipelago. Photo credit Fabio Di Lupo, Flickr Creative Commons. | 1 |
| 15:16, 1 October 2022 | BlueBioEconomy.jpg (file) |  |
120 KB | Dronkers J | Governmental policies for a blue bio-economy, adapted after Hasselström and Gröndahl (2021) | 1 |
| 16:10, 23 September 2022 | SeaweedRopeCulture.jpg (file) |  |
70 KB | Dronkers J | Lines seeded with juveniles sporophytes of Sacharina Latissima. The most common cultivation method consists of tying seedlings to monofilament lines strung between mangrove stakes which are pounded into the substrate. Image from Bermejo et al. (2022),... | 1 |
| 15:24, 23 September 2022 | SeaweedFarm.jpg (file) |  |
120 KB | Dronkers J | Cultivation of ''Kappaphycus'' in the Philippines. Image from Bermejo et al. (2022), photo credit Elisa Capuzzo. Creative Commons Attribution (CC BY) license (https://creativecommons.org/licenses/by/4.0/). | 1 |
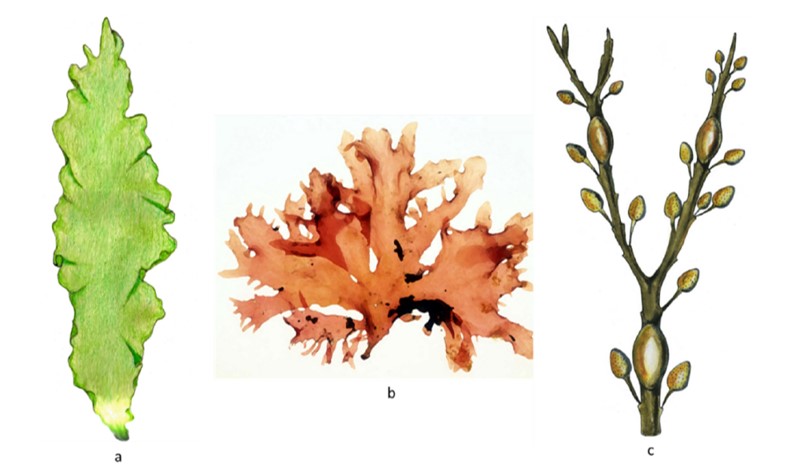
| 16:34, 21 September 2022 | SeaweedSpecies.jpg (file) |  |
56 KB | Dronkers J | Examples of the three main taxonomic groups: a. phylum Chlorophyta (green algae); b. phylum Rhodophyta (red algae); c. phylum Ochrophyta, class Phaeophyceae (brown algae). From Pereira (2021) Creative Commons Attribution (CC BY) license (https://creati... | 1 |
| 09:41, 18 September 2022 | BreakwaterDiffraction.jpg (file) |  |
120 KB | Dronkers J | Analytical solution of the diffraction of a linear water wave propagating over uniform depth in <math>y</math>-direction behind a rigid breakwater extending from <math>x=-\infty</math> to <math>0</math>. Blue curves are wavefronts and red curves are li... | 1 |
| 22:05, 9 September 2022 | GreatGarudaPlan.jpg (file) |  |
296 KB | Dronkers J | Lay-out of the Great Garuda Plan, Jakarta | 1 |
| 21:01, 9 September 2022 | HoChiMinhCityElevation.jpg (file) |  |
188 KB | Dronkers J | Elevation map of Ho Chi Minh City, relative to mean sea level. From Tran Thong Nhat, 2014. | 1 |
| 21:00, 9 September 2022 | BangkokElevationMap.jpg (file) |  |
319 KB | Dronkers J | Elevation map of Bangkok, meters above mean sea level. Image adapted from https://bkkbaseface.wordpress.com/2011/10/24/bangkok-flood-elevation-map/. | 1 |