File list
This special page shows all uploaded files.
| Date | Name | Thumbnail | Size | User | Description | Versions |
|---|---|---|---|---|---|---|
| 20:59, 9 September 2022 | ManilaFloodProne.jpg (file) |  |
279 KB | Dronkers J | Flood-prone zones of Manila. Image credit: Government of the Philippines. Mines and Geosciences Budrea. | 1 |
| 20:58, 9 September 2022 | MumbaiFlood2005.jpg (file) |  |
98 KB | Dronkers J | Inundated areas during the 2005 flood in Mumbai correspond to the reclaimed low-lying zones in between the former islands. Red lines are district borders. Image from the Fact Finding Committee on Mumbai floods (MCGM 2006). | 1 |
| 20:51, 4 September 2022 | SlopingFloorResonance.jpg (file) |  |
45 KB | Dronkers J | Largest resonance period <math>T</math> for a basin with uniformly sloping floor from the mouth (<math>h_0</math>) to the head (<math>h_1</math>), relative to the resonance period <math>T_0</math> for a basin with uniform depth <math>h_0</math>. | 1 |
| 16:35, 31 August 2022 | SheetFlow.jpg (file) |  |
153 KB | Dronkers J | Under strong wave action is transport in the sheet flow layer the dominant transport mode: more important than bedload transport through saltation and rolling and more important than suspended load transport. | 1 |
| 09:44, 31 August 2022 | Luto.jpg (file) |  |
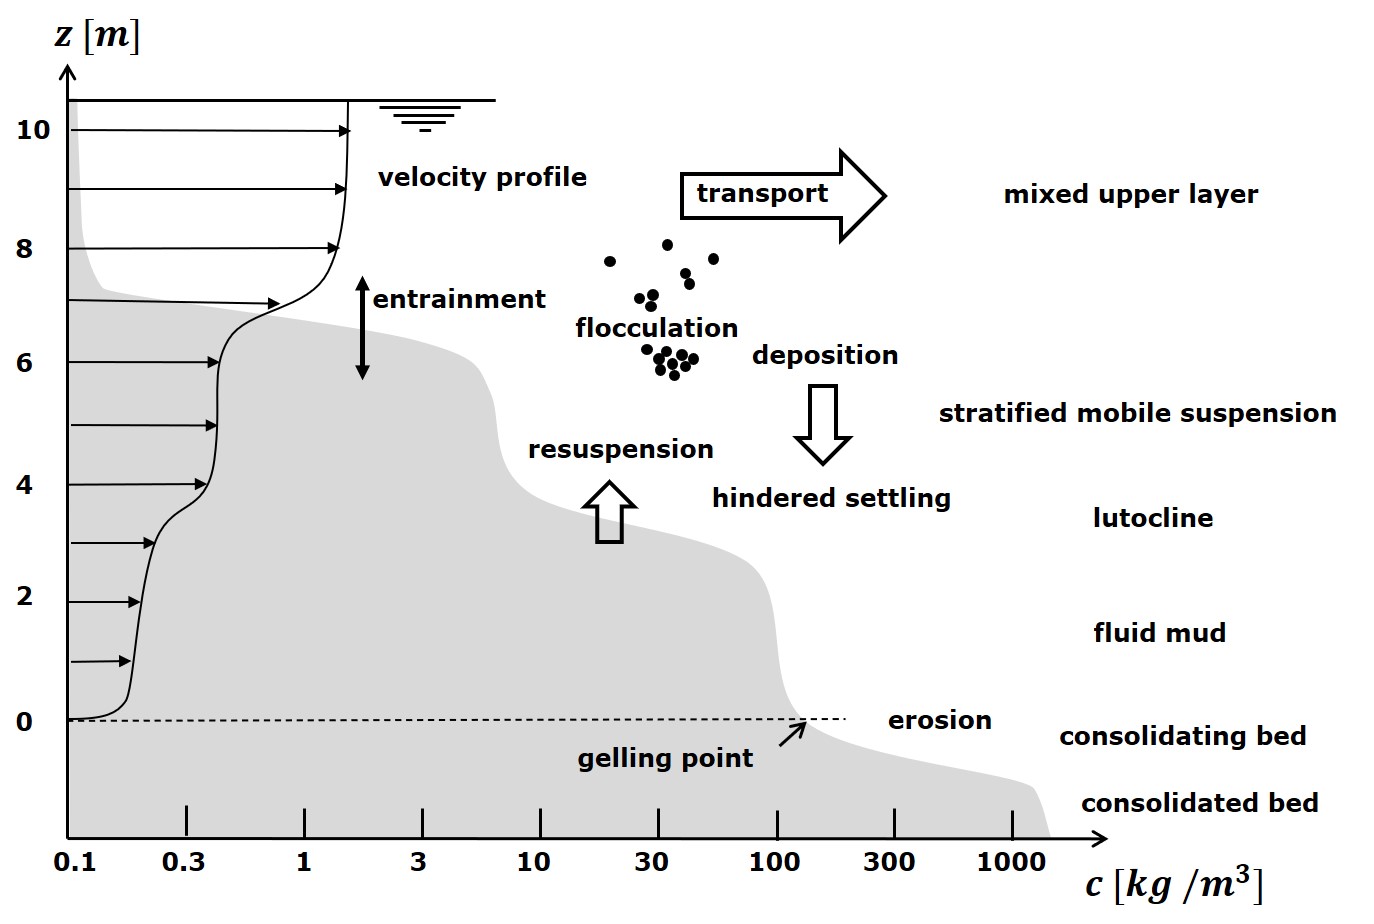
124 KB | Dronkers J | Schematic representation of suspended sediment layers in a turbid estuary. | 1 |
| 09:43, 31 August 2022 | Fallconc.jpg (file) |  |
107 KB | Dronkers J | Floc settling velocity as a function of the concentration, after Mehta (1986). | 1 |
| 21:39, 30 August 2022 | Floc.jpg (file) |  |
293 KB | Dronkers J | Schematic representation of a macrofloc made up of a multitude of microflocs. | 1 |
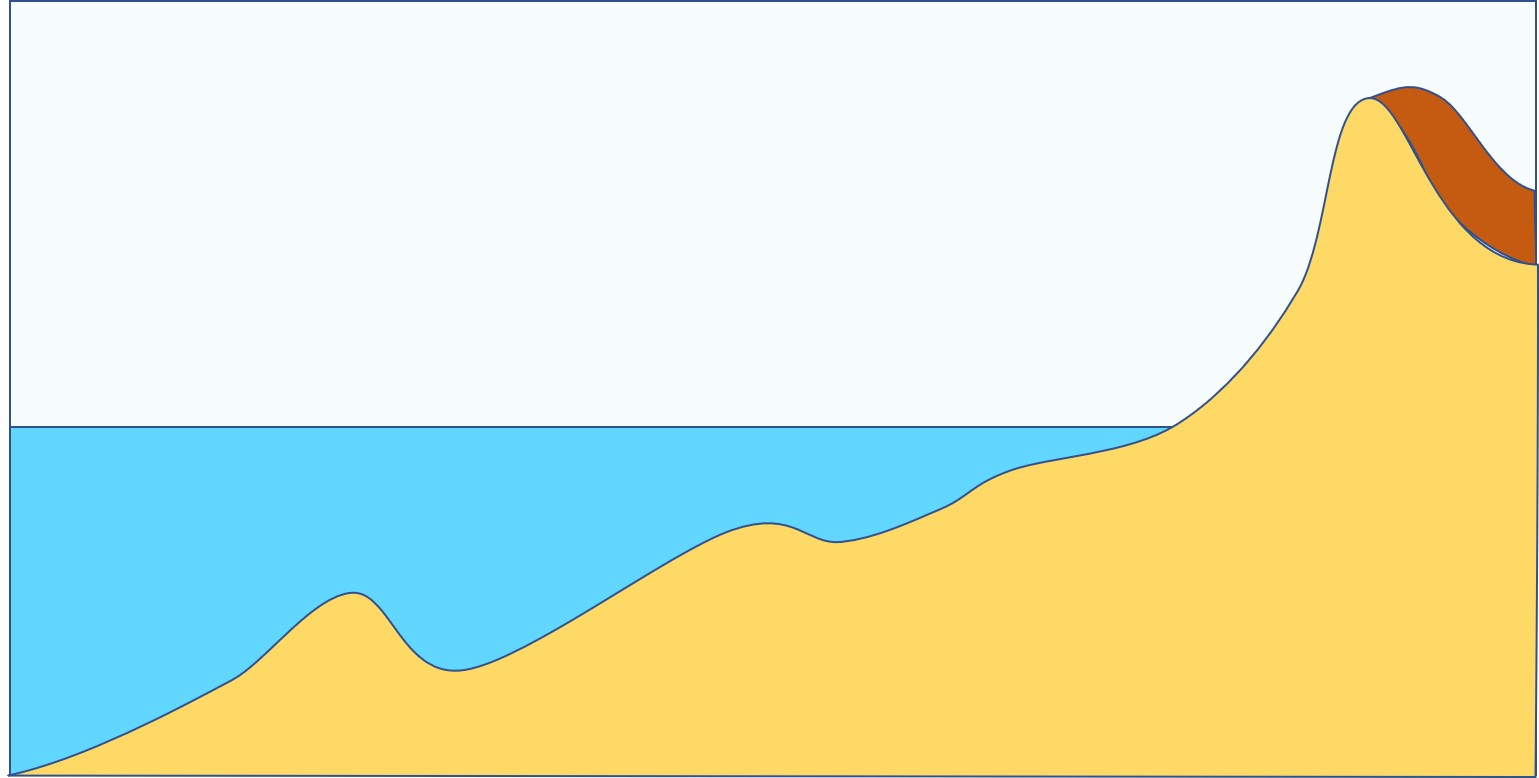
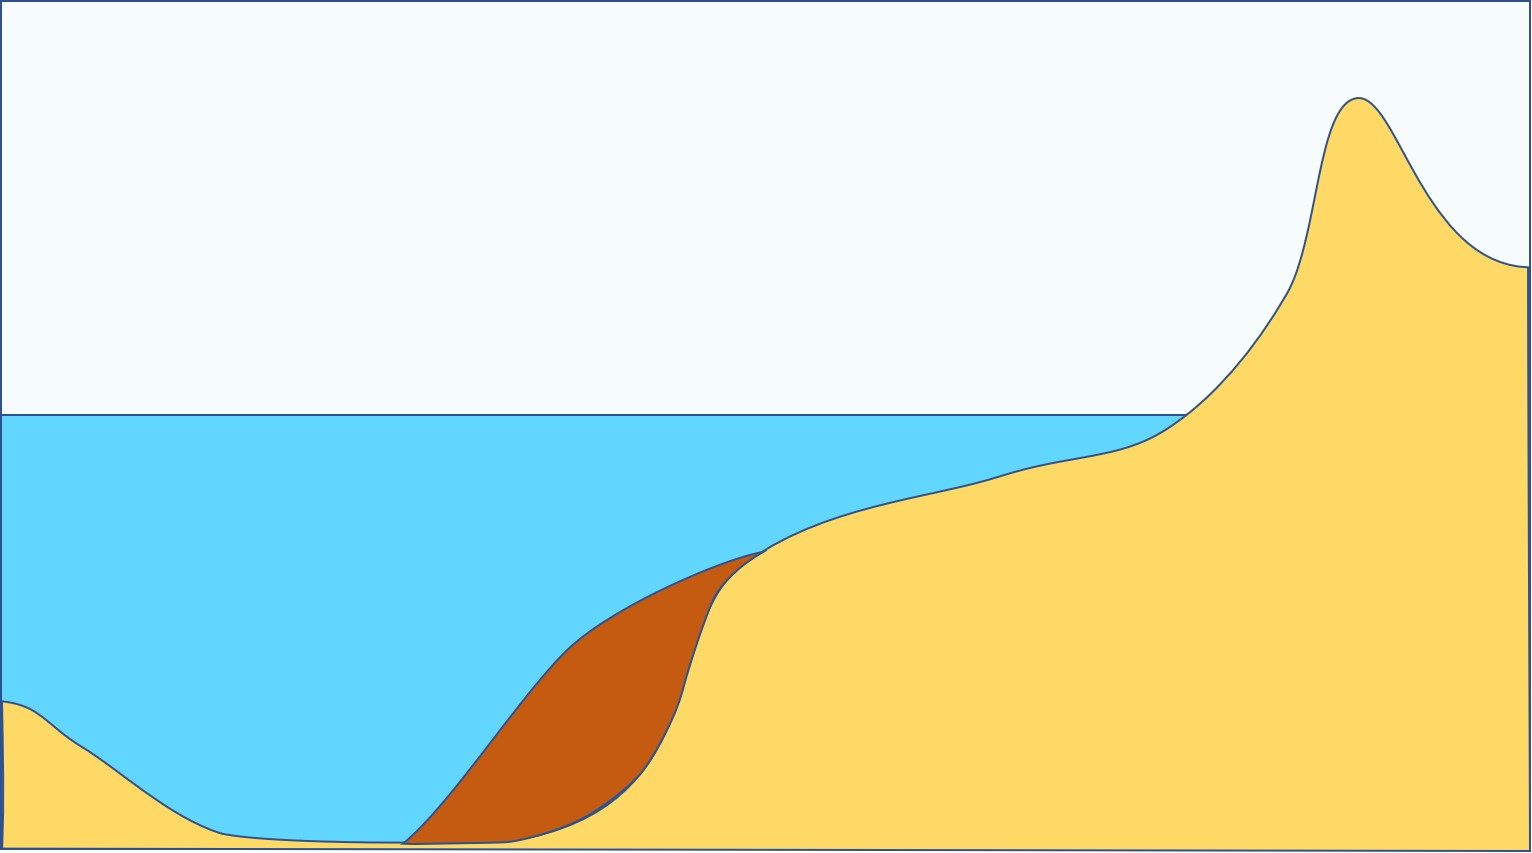
| 14:45, 26 August 2022 | SummerWinterBeachProfile.jpg (file) |  |
74 KB | Dronkers J | Schematic representation of summer and winter beach profiles. | 1 |
| 15:27, 10 August 2022 | DamBreakWettedChannel.jpg (file) |  |
51 KB | Dronkers J | Schematic representation of dam-break flow into a wetted channel of small relative depth. Blue pale: Dam-break wave. Blue: Channel water. The interface is not sharp but diffuse due to strong mixing. | 1 |
| 15:19, 10 August 2022 | DamBreakFrictionCelerity.jpg (file) |  |
63 KB | Dronkers J | The dimensionless celerity of the dam-break wave front as a function of dimensionless time. Blue: The frictionless Ritter solution. Red: The frictional model of Chanson (2009). | 1 |
| 15:17, 10 August 2022 | DamBreakFrictionScheme.jpg (file) |  |
61 KB | Dronkers J | Schematic representation of frictional dam-break flow according to the model of Chanson (2009). Blue pale: The wave shape following the frictionless solution of Ritter; Blue: The wave shape in the frictional tip region. | 1 |
| 18:08, 2 July 2022 | MorphoRip.jpg (file) |  |
184 KB | Dronkers J | Schematic view of a rip cell. Beach: yellow, sea: blue; shallow water: light blue; nearshore bars: hatched; flow pattern: red arrows. | 2 |
| 18:07, 2 July 2022 | TopoRips.jpg (file) |  |
108 KB | Dronkers J | Rip currents induced by a groyne under oblique wave incidence. Updrift side (right): Deflection rip current. Downdrift side (left): Shadow rip current. Beach: yellow; sea: blue; shallow water: light blue; wave breaking: white; rip currents: red arrows;... | 2 |
| 18:07, 28 June 2022 | WaveAsymmetries.jpg (file) |  |
149 KB | Dronkers J | Wave orbital velocity as function of the phase <math>\theta</math>. Left panel: Velocity skewness. Right panel: Acceleration skewness. Blue lines: Eq. (A1). Red lines: Eq. (A5). | 1 |
| 16:42, 25 June 2022 | BlackMangrove.jpg (file) |  |
333 KB | Dronkers J | Black mangrove (''Avicennia'') | 1 |
| 16:19, 25 June 2022 | RedMangrove.jpg (file) |  |
104 KB | Dronkers J | Red mangroves (''Rhizophora'') | 1 |
| 16:18, 25 June 2022 | BlackMangrove Flickr Commons.jpg (file) |  |
397 KB | Dronkers J | Black mangroves (''Avicennia'') | 1 |
| 14:05, 23 June 2022 | Ross Links.pdf (file) | 1.47 MB | Pat Doody | 1 | ||
| 15:32, 22 June 2022 | SandSpitDevelopment.jpg (file) |  |
101 KB | Dronkers J | Development of a sand spit at a bending shoreline. | 2 |
| 20:23, 21 June 2022 | FlyingSpitGrowth.jpg (file) |  |
81 KB | Dronkers J | Shoreline instability and development of a flying sand spit at a small initial shoreline bulge under highly oblique wave incidence. | 1 |
| 20:22, 21 June 2022 | DamiettaSpit.jpg (file) |  |
383 KB | Dronkers J | Strong littoral drift from west to east at the Damietta Nile outflow has generated a large sandspit to the east of the Damietta promontory, which is bent towards the coast by cross-shore sediment transport processes. | 1 |
| 12:53, 21 June 2022 | SandSpitsSenegalRiverNov2020.jpg (file) |  |
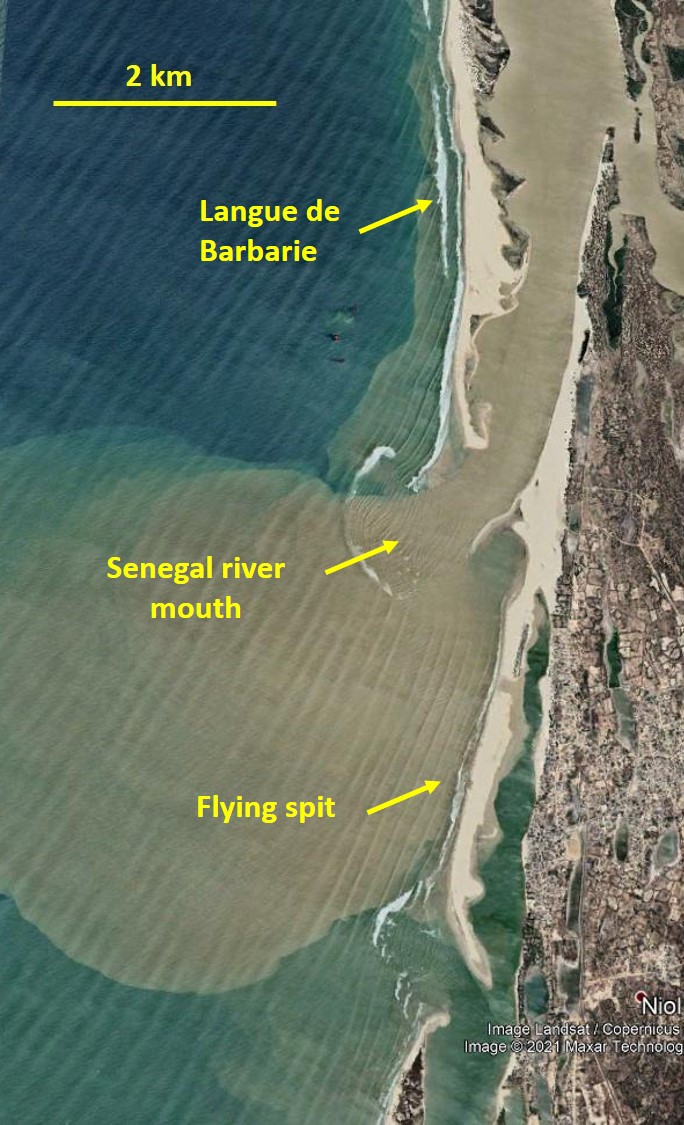
193 KB | Dronkers J | Sand spits at the mouth of the Senegal river. | 1 |
| 11:12, 12 April 2022 | WaveBreakingTypes.jpg (file) | 68 KB | Dronkers J | Schematic of wave evolution towards breaking, for swell waves (left panel) and sea waves (right panel). | 1 | |
| 09:59, 12 April 2022 | SpillingWave2.jpg (file) |  |
131 KB | Dronkers J | Spilling waves. Photo credit Andrew Dawley Flickr Creative Commons. | 1 |
| 09:58, 12 April 2022 | PlungingWave4.jpg (file) |  |
86 KB | Dronkers J | Plunging wave. Photo credit Kernowfile Flickr Creative Commons. | 1 |
| 19:18, 6 April 2022 | HarborRadiation.jpg (file) |  |
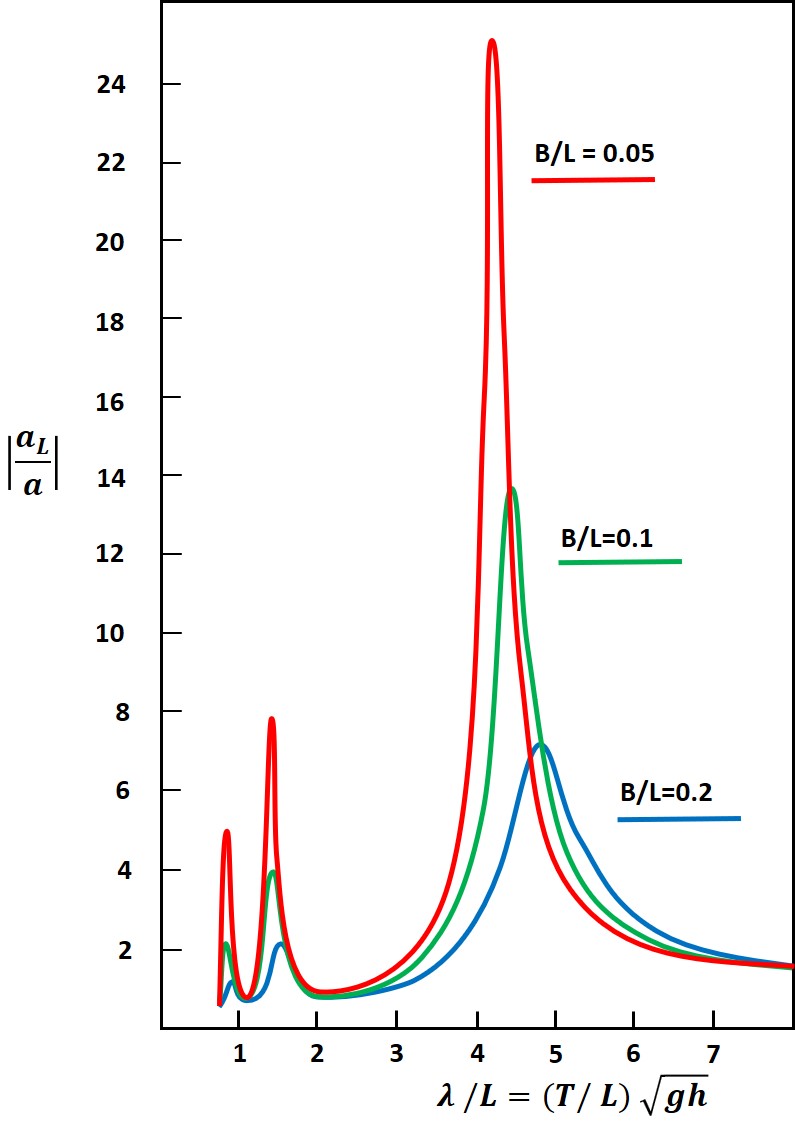
79 KB | Dronkers J | Amplification factor of an incident tsunami wave in a frictionless harbor of 1000 m length due to outward radiation of the reflected wave. Adapted from Berkhoff (1976). | 2 |
| 16:17, 5 April 2022 | SeicheRotterdamHarbour.jpg (file) |  |
212 KB | Dronkers J | Amplification of a meteo tsunami in the harbor of Rotterdam. From De Jong (2004). | 1 |
| 15:48, 5 April 2022 | SeicheNorthSea.jpg (file) |  |
259 KB | Dronkers J | Amplification of meteo-induced wave motion travelling southward across the Southern North Sea toward the coast of Holland. From De Jong (2004). | 1 |
| 21:34, 4 April 2022 | HarborFriction.jpg (file) |  |
51 KB | Dronkers J | Amplification factor of an incident tsunami wave in a harbor of 1000 m length due to bottom friction. | 1 |
| 21:26, 4 April 2022 | HarborPlanform.jpg (file) |  |
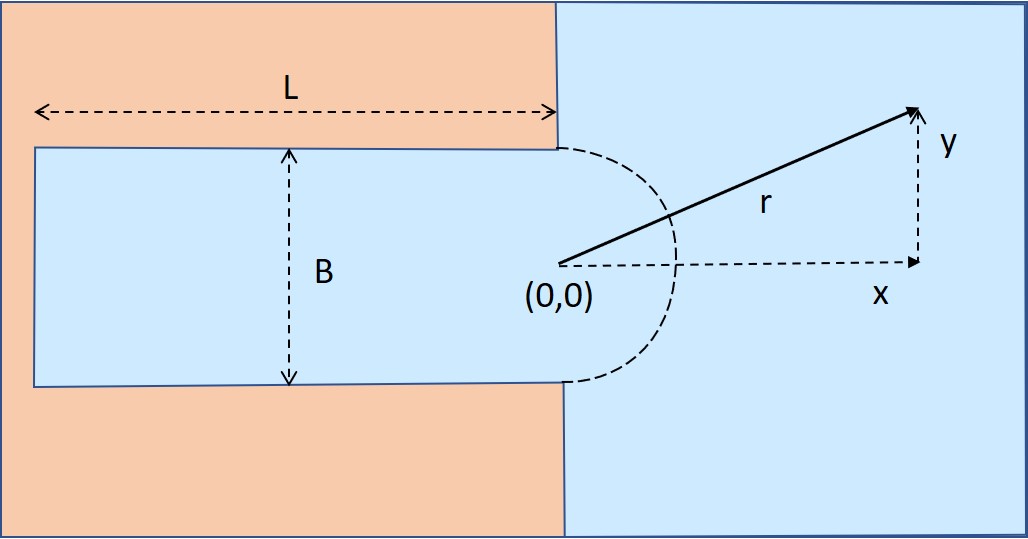
44 KB | Dronkers J | Planform of a rectangular harbor on a shelf sea with same uniform depth. | 1 |
| 16:17, 1 April 2022 | SeicheCiutadellaHarbour2.jpg (file) |  |
28 KB | Dronkers J | Harbour seiche in Ciutadella Inlet (Menorca Island, Spain) generated by a meteo tsunami on 15 June 1996 . Image from Montserrat et al. (2006), Creative Commons Licence. | 1 |
| 10:15, 21 February 2022 | MarineMicroorganisms.jpg (file) |  |
338 KB | Dronkers J | Classification of marine microorganisms. | 2 |
| 12:15, 20 February 2022 | SeafloorSediment.png (file) |  |
124 KB | Dronkers J | Distribution of sediment types on the seafloor. From [https://en.wikibooks.org/wiki/Historical_Geology/Marine_sediments Wikibooks] | 1 |
| 11:19, 19 February 2022 | WaterInjectionDredging.jpg (file) |  |
116 KB | Dronkers J | Cartoon of water injection dredging. | 1 |
| 17:06, 18 February 2022 | HarborEddy.jpg (file) |  |
91 KB | Dronkers J | Horizontal flow pattern at the entrance of a tidal harbor in the absence of flow adaptation constructions. Left panel: Ebb. Right panel: Flood. | 1 |
| 16:58, 18 February 2022 | HarborEddyWeakening.jpg (file) |  |
81 KB | Dronkers J | Schematic pictures of flow adaptation constructions for counteracting the formation of horizontal exchange flows at the harbor entrance during flood. Left panel: Sill and current deflection wall. Right panel: Upstream permeable groin. | 1 |
| 16:57, 18 February 2022 | HarborEddy.jpg .jpg (file) |  |
91 KB | Dronkers J | Horizontal flow pattern at the entrance of a tidal harbor in the absence of flow adaptation constructions. Left panel: Ebb. Right panel: Flood. | 1 |
| 17:25, 6 February 2022 | ShorefaceBathymetryKatwijk.jpg (file) |  |
185 KB | Dronkers J | Bathymetry of the shoreface at the Dutch coast (Katwijk, 11 August 1998) displaying 3 nearshore sandbars. Image credit E.J. Biegel. | 1 |
| 16:02, 18 January 2022 | EquilibriumNourishment.jpg (file) |  |
123 KB | Dronkers J | Morphological response to beach broadening, assuming initial equilibrium. | 1 |
| 12:29, 18 January 2022 | NourishmentLife.jpg (file) |  |
57 KB | Dronkers J | Lifespan of beach nourishments compared to the nourishment volume (Brand et al. 2022) | 1 |
| 22:31, 17 January 2022 | OuterBarNourishment.jpg (file) |  |
57 KB | Dronkers J | Nourishment at the seaside of the outer sand bar. | 1 |
| 22:30, 17 January 2022 | BeachNourishment.jpg (file) |  |
56 KB | Dronkers J | Beach nourishment. | 1 |
| 22:30, 17 January 2022 | BackshoreNourishment.jpg (file) |  |
56 KB | Dronkers J | Backshore nourishment. | 1 |
| 22:29, 17 January 2022 | DuneNourishment.jpg (file) |  |
56 KB | Dronkers J | Inner dune nourishment. | 1 |
| 22:28, 17 January 2022 | ChannelWallNourishment.jpg (file) |  |
57 KB | Dronkers J | Channel wall nourishment. | 1 |
| 15:30, 17 January 2022 | ShorefaceNourishment.jpg (file) |  |
67 KB | Dronkers J | Coastal profile near Egmond (North-Holland) with sand nourishment at the seaside of the outer sandbar. | 1 |
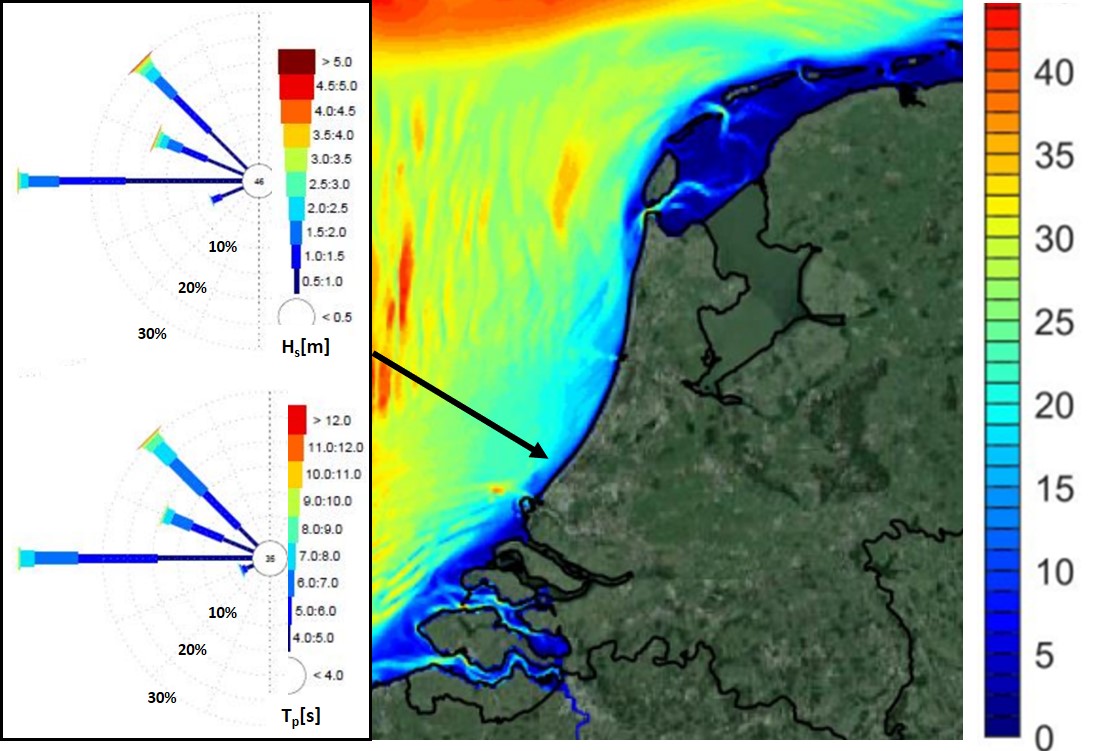
| 15:29, 17 January 2022 | DutchCoastalZone.jpg (file) |  |
150 KB | Dronkers J | Characteristics of the Dutch coast. The figure shows a bathymetric map [m] of the coastal zone and wind roses (significant wave height and peak period) at the location indicated by the arrow. | 1 |
| 16:12, 20 November 2021 | BriarSkillMablethorpeBeach.jpg (file) |  |
160 KB | Dronkers J | Briar skill score of beach level trend prediction versus time for Mablethorpe beach based on linear trends fitted to 5, 10 and 20 years’ data. From Sutherland et al. 2007. | 1 |
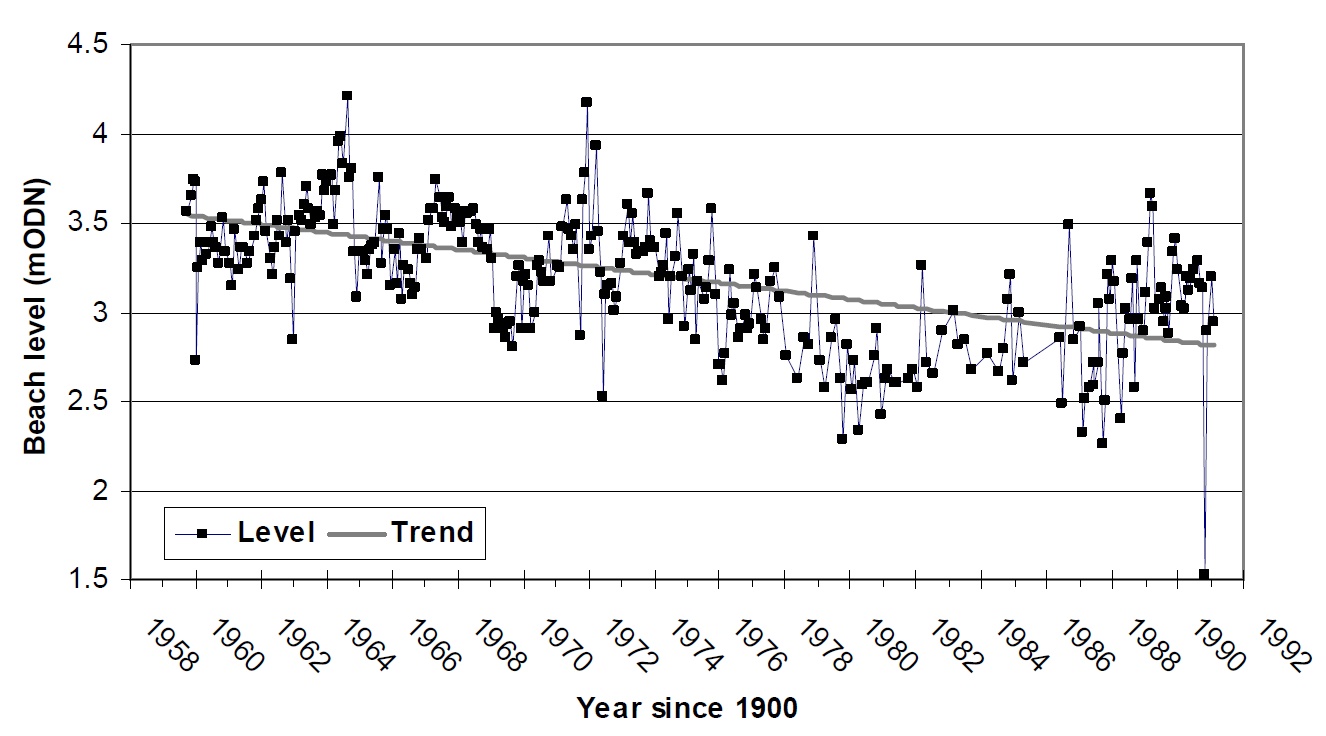
| 17:35, 18 November 2021 | Beach levels at a Mablethorpe seawall.jpg (file) |  |
183 KB | Dronkers J | Time series of beach elevation at a set point in front of Mablethorpe seawall. | 1 |
| 11:47, 18 November 2021 | Haar.jpg (file) |  |
125 KB | Dronkers J | Haar wavelets. | 1 |