File list
This special page shows all uploaded files.
| Date | Name | Thumbnail | Size | User | Description | Versions |
|---|---|---|---|---|---|---|
| 22:57, 14 November 2020 | GreenAlgae D Ramirez.jpg (file) |  |
342 KB | Dronkers J | Macroalgae washed ashore. Photo credit D. Ramirez | 1 |
| 15:38, 14 November 2020 | OceanHypoxia.jpg (file) |  |
198 KB | Dronkers J | Areas with hypoxia in coastal seas (red) and in the oceans (blue). From IOC-UNESCO 2018 Creative Commons Licence. | 1 |
| 16:22, 13 November 2020 | GlobalInputN.jpg (file) |  |
267 KB | Dronkers J | Estimated net anthropogenic nitrogen inputs (NANI) according to the world’s main river catchments. Source: Billen et al., 2013. | 1 |
| 22:07, 12 November 2020 | FertilizerUseNP.jpg (file) |  |
58 KB | Dronkers J | N and P content of global fertilizer use. | 1 |
| 11:20, 26 October 2020 | WaterLevels.jpg (file) |  |
163 KB | Dronkers J | Time series of water level calculated with BW04, DiSC in the deepest part of the tidal channel together with the measured water level. | 1 |
| 10:35, 26 October 2020 | BathyListWest.jpg (file) |  |
107 KB | Dronkers J | Bathymetry of area of investigation acquired by multibeam echosounder. | 1 |
| 10:34, 26 October 2020 | BathyWB04.jpg (file) |  |
150 KB | Dronkers J | Averaged bathymetry over 12h obtained from the BW04 method. | 1 |
| 10:33, 26 October 2020 | ErrorWB04.jpg (file) |  |
107 KB | Dronkers J | Map of the relative error of the BW04 method. | 1 |
| 10:33, 26 October 2020 | ErrorDiSC.jpg (file) |  |
91 KB | Dronkers J | Map of the relative error of the DiSC method. | 1 |
| 20:08, 24 October 2020 | WERAspectrum.jpg (file) |  |
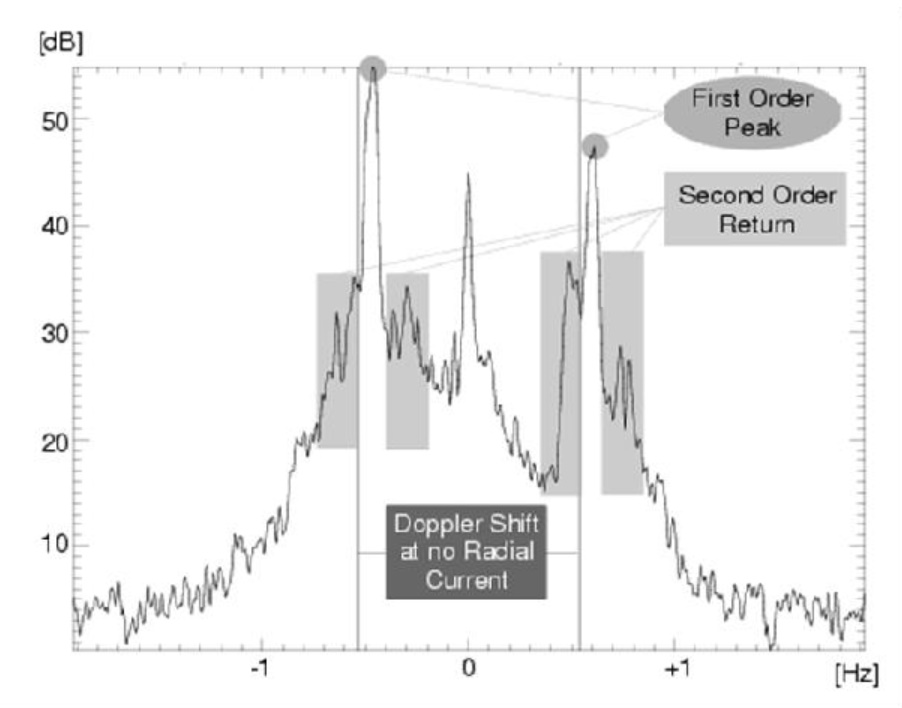
77 KB | Dronkers J | Typical backscatter spectrum of sea echoes, normalized to the strongest signal measured by WERA. | 1 |
| 20:07, 24 October 2020 | WERAantenna.jpg (file) |  |
162 KB | Dronkers J | Typical example of an antenna installation for WERA radar. | 1 |
| 20:06, 24 October 2020 | WindFieldOffBrest.jpg (file) |  |
178 KB | Dronkers J | Example of measured wind direction measured by HF radar of the coast of Brest (France). | 1 |
| 20:05, 24 October 2020 | WaveFieldOffBrest.jpg (file) |  |
195 KB | Dronkers J | Wave field measured by HF radar off the coast of Brest. | 1 |
| 20:04, 24 October 2020 | RDCPScheme.jpg (file) |  |
97 KB | Dronkers J | Ship with mounted Radar Doppler Current Profiler (RDCP). | 1 |
| 20:03, 24 October 2020 | RDCPcurrent.jpg (file) |  |
262 KB | Dronkers J | The two maps show the current distribution within a tidal channel in the German bight (Lister Tief) obtained with RDCP. Left panel: current speed; right panel: current direction. | 1 |
| 20:02, 24 October 2020 | RadarGeometry.jpg (file) |  |
168 KB | Dronkers J | Geometry microwave radar. | 1 |
| 19:51, 24 October 2020 | DispersionShell.jpg (file) |  |
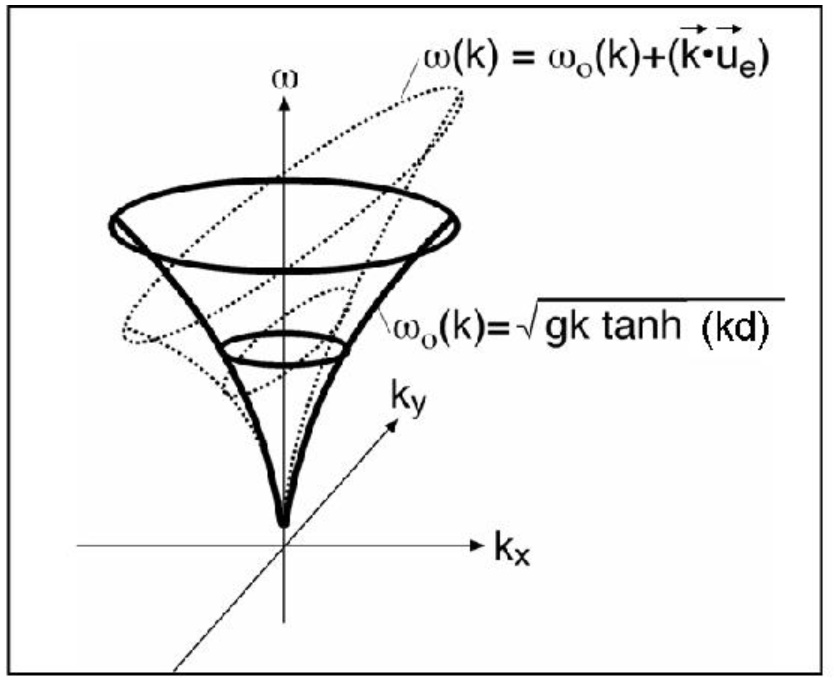
78 KB | Dronkers J | Gravity wave-dispersion shell in the wave vector-frequency domain . | 1 |
| 19:51, 24 October 2020 | DiSCbathymetries.jpg (file) |  |
272 KB | Dronkers J | Bathymetries of List West (north end of the Island Sylt in the German bight) derived by DiSC for February 20 (left) and February 28 (right). | 1 |
| 19:46, 24 October 2020 | CurrentFieldOffBrest.jpg (file) |  |
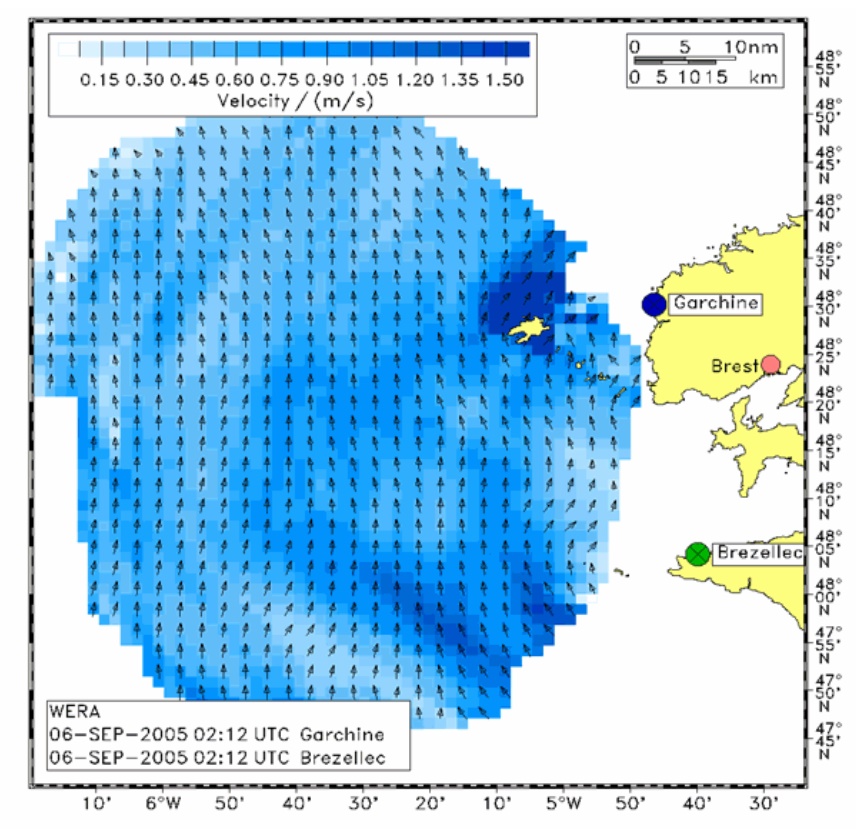
240 KB | Dronkers J | Example of a surface velocity field measured by HF radar off the coast of Brest (France). | 1 |
| 14:55, 24 October 2020 | BraggResonanceMechanism.jpg (file) |  |
190 KB | Dronkers J | Successive reflections of an electromagnetic signal by a surface wave are in phase if the wavelength of the emitted signal is twice the wavelength of the surface wave. This positive interference is called 'Bragg scattering'. Image from Middleditch (2006). | 1 |
| 19:23, 22 October 2020 | RevetmentOvertopping.jpg (file) |  |
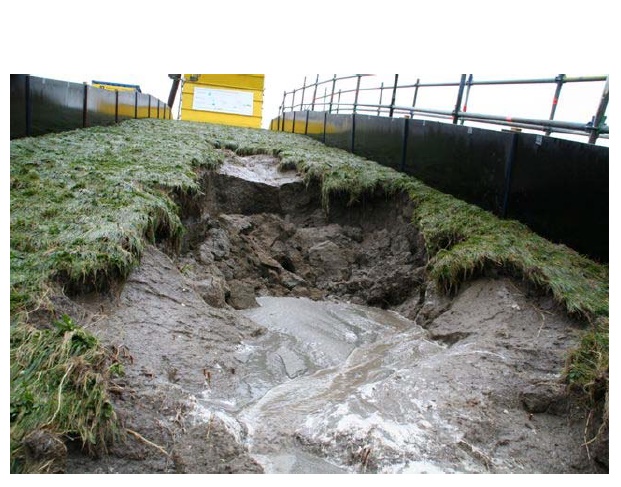
89 KB | Dronkers J | Overtopping of revetment by wave run-up and subsequent erosion. | 1 |
| 22:04, 5 October 2020 | SpeciesAbundance.jpg (file) |  |
107 KB | Dronkers J | Species abundance plots for occasional, persistent and total estuarine fish species. After Mugarran and Henderson (2003). | 1 |
| 16:31, 18 September 2020 | ZoneDivisionNearshore.jpg (file) |  |
135 KB | Dronkers J | Zone division in the nearshore region. | 1 |
| 16:30, 18 September 2020 | OvertoppingDischargeRatioPrototypeModel.jpg (file) |  |
117 KB | Dronkers J | Ratio between prototype overtopping discharge and upscaled model overtopping discharge . | 1 |
| 16:29, 18 September 2020 | ZeebruggeBreakwater.jpg (file) |  |
134 KB | Dronkers J | Cross-section of Zeebrugge rubble mound breakwater. | 1 |
| 11:35, 17 September 2020 | WaveOvertoppingDamage1.jpg (file) |  |
139 KB | Dronkers J | Example of damage by the wave overtopping simulation. | 1 |
| 11:34, 17 September 2020 | WaveOvertoppingVolume.jpg (file) |  |
98 KB | Dronkers J | Distribution of overtopping volumes of waves for sea dikes and various mean overtopping discharges, as simulated by the Wave Overtopping Simulator. | 1 |
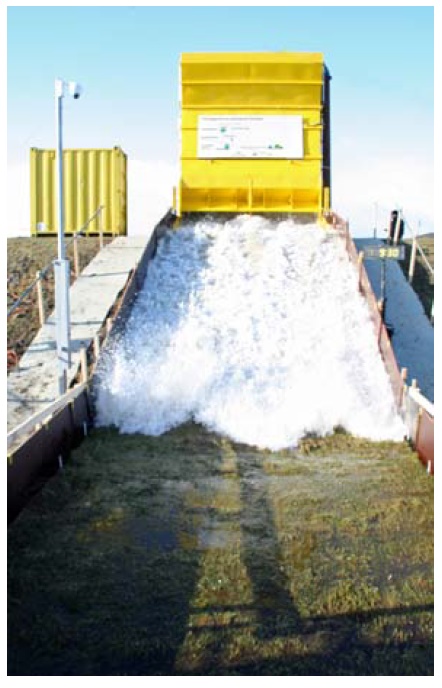
| 11:33, 17 September 2020 | WaveOvertoppingExperiment.jpg (file) |  |
96 KB | Dronkers J | Release of a wave from the simulator. | 1 |
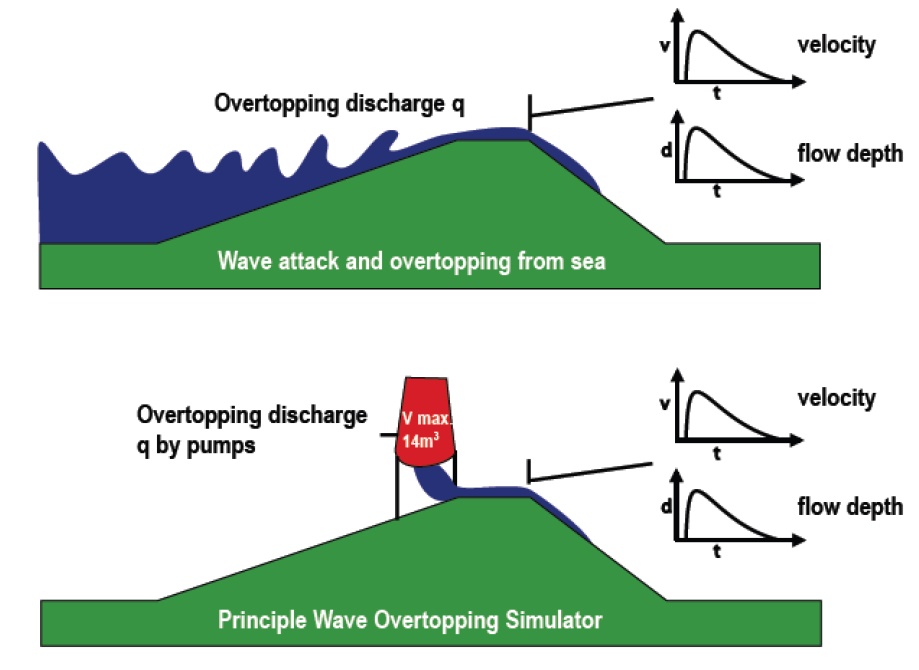
| 11:32, 17 September 2020 | WaveOvertoppingSimulator.jpg (file) |  |
85 KB | Dronkers J | Principle of the Wave Overtopping Simulator. | 1 |
| 14:43, 16 September 2020 | DutchSeadike.jpg (file) |  |
92 KB | Dronkers J | Cross-section of a Dutch seadike. | 1 |
| 21:16, 12 September 2020 | EuropeMarineProtectedAreas2015.gif (file) |  |
819 KB | Dronkers J | Map of Marine Protected Areas designated under the Regional Sea Conventions, situation 2015. From EEA report 3/2015: Marine protected areas in Europe's seas. An overview and perspectives for the future. | 1 |
| 14:55, 1 September 2020 | WhiteCappedWaves.jpg (file) |  |
483 KB | Dronkers J | White-capped waves. Credit recon.sccf.org | 1 |
| 13:37, 18 August 2020 | EUmapObservatories.jpg (file) |  |
445 KB | Dronkers J | Location of field observatories participating in the JERICO network. | 1 |
| 10:55, 6 August 2020 | TraganumMoquinii.jpg (file) |  |
206 KB | Dronkers J | Traganum Moquinii. | 1 |
| 21:41, 8 July 2020 | TouristArrivals.jpg (file) |  |
54 KB | Dronkers J | International tourist arrivals (million) and tourism receipts (USD billion). | 1 |
| 21:45, 6 July 2020 | ColdWaterReefMap AnthonDohrnSeamount.jpg (file) |  |
201 KB | Dronkers J | World map of cold water coral reefs (UNEP, 2003). The red star indicates Anthon Dohrn Seamount. | 1 |
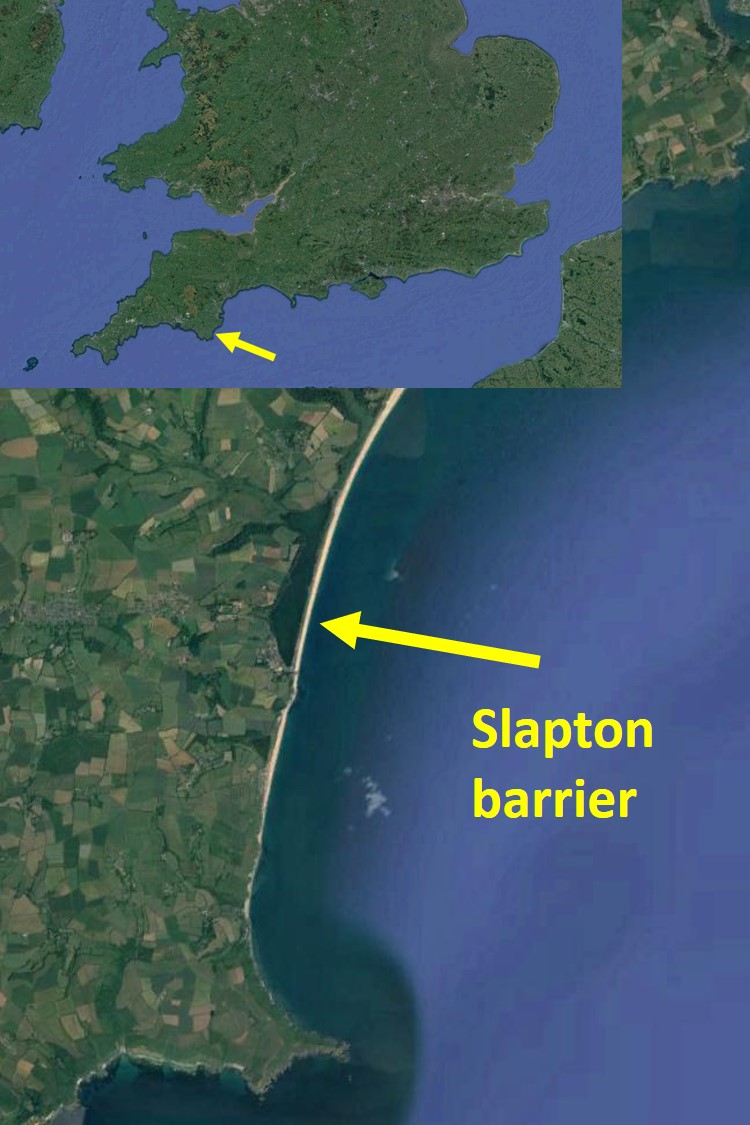
| 11:45, 6 July 2020 | Slapton.jpg (file) |  |
143 KB | Dronkers J | Location Slapton barrier. | 1 |
| 15:22, 4 July 2020 | Bulkheaddesign.jpg (file) |  |
159 KB | Dronkers J | Typical design of a bulkhead structure. | 1 |
| 10:27, 29 June 2020 | SeagrassWorldMap UNEP 2011.jpg (file) |  |
133 KB | Dronkers J | Seagrass world map. Source: Unep-Map-Rac/Spa (2011) | 1 |
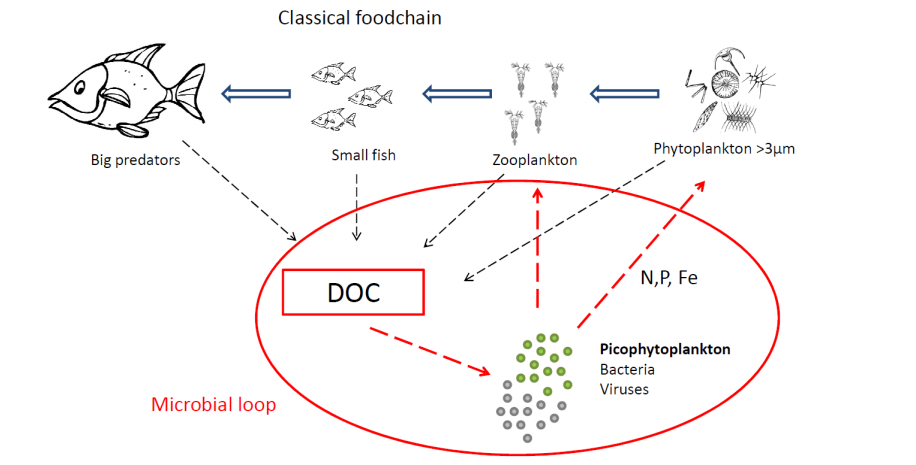
| 20:12, 27 June 2020 | MicrobialLoop.png (file) |  |
95 KB | Dronkers J | Classical marine food chain including the microbial loop. Credit: Beate Stawiarski, Erik Buitenhuis | 1 |
| 16:34, 13 June 2020 | AlgaeBloomModel.jpg (file) |  |
95 KB | Dronkers J | Temporal evolution of the algae population P(t) and the nutrient concentration N(t) according to the Lotka-Volterra equations. | 1 |
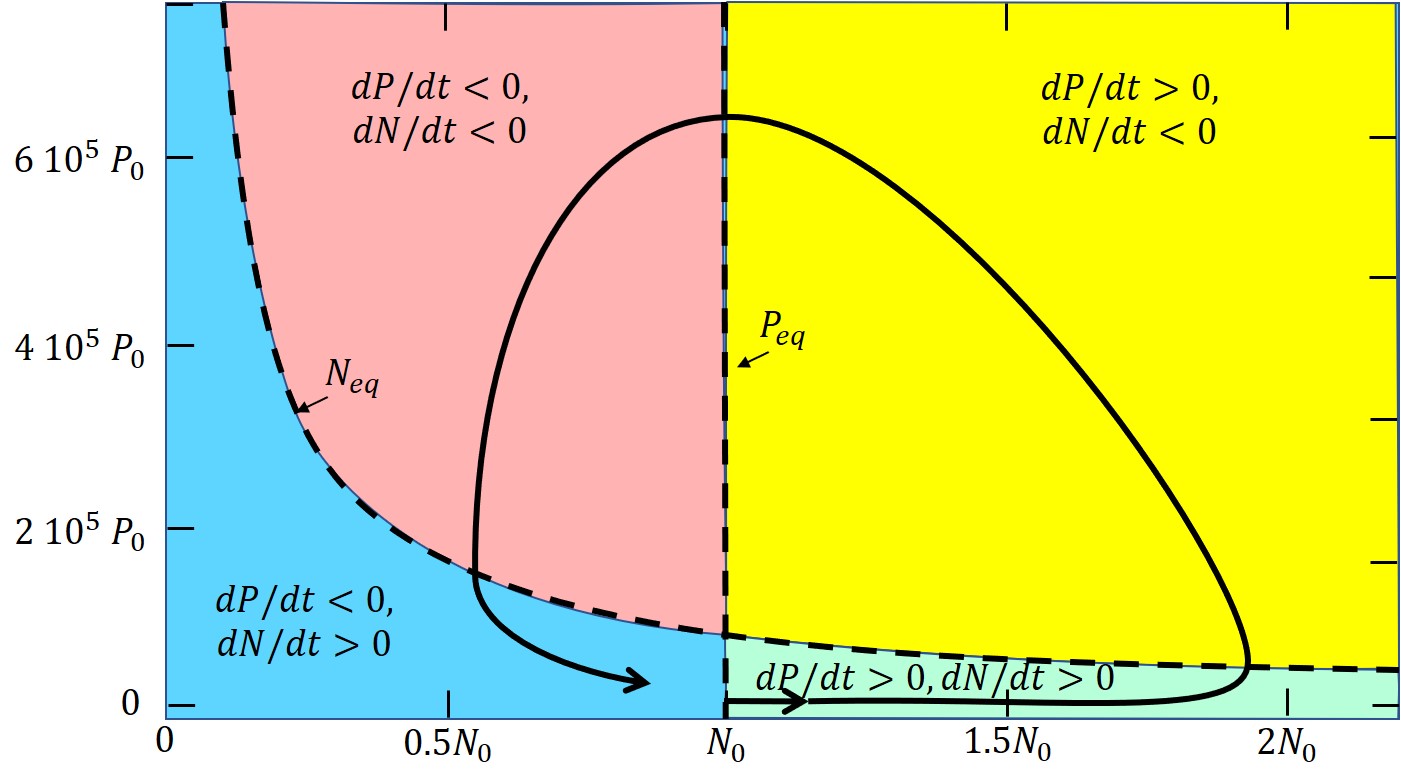
| 16:33, 13 June 2020 | AlgaeBloomPhasePlane.jpg (file) |  |
115 KB | Dronkers J | Solution of the Lotka-Volterra equations (A1, A2) in the N−P phase plane. From Huppert et al. (2002). | 1 |
| 15:48, 10 June 2020 | AlgaeBloomTerschelling.jpg (file) |  |
289 KB | Dronkers J | Multi-annual observation record of the alga ''Chaetoceros socialis'' at a measuring point in the North Sea 10 km north of the Dutch Wadden island of Terschelling. Simultaneous measurements of the local nitrate concentration and surface salinity. From W... | 1 |
| 11:22, 29 May 2020 | Seepcat1.jpg (file) |  |
33 KB | Dronkers J | SeepCat system, consisting of vertical pipes that abstract saline groundwater around the freshwater lens on a small island and pump the saline groundwater to the sea via a horizontal collector pipe. | 1 |
| 14:57, 23 May 2020 | SaltWedgeMod.jpg (file) |  |
65 KB | Dronkers J | Salt wedge in a prismatic estuary. | 1 |
| 19:43, 22 May 2020 | SaltWedgeZero.jpg (file) |  |
44 KB | Dronkers J | Salt intrusion in case of very small river discharge. | 1 |
| 22:12, 21 May 2020 | SaltWedgeObsMod.jpg (file) |  |
94 KB | Dronkers J | Dimensionless salt wedge length <math>C_i L / h</math> according to Eq. (7) for a prismatic estuary and observed salt wedge lengths. | 1 |
| 19:59, 19 May 2020 | Sabellaria-spinulosa-alchetron.jpg (file) |  |
92 KB | Dronkers J | Small mounts on the seabed consisting of tubes produced by the worm ''Sabellaria spinulosa''. From: https://alchetron.com/Sabellaria-spinulosa | 1 |
| 19:58, 19 May 2020 | Sabellaria-alveolata-alchetron.jpg (file) |  |
72 KB | Dronkers J | Reef structure of cemented coarse sand consisting of tubes produced by the worm ''Sabellaria alveolata''. From: https://alchetron.com/Sabellaria-alveolata | 1 |
| 19:57, 19 May 2020 | Serpula-vermicularis-alchetron.jpg (file) |  |
57 KB | Dronkers J | Cold-water reef built from the tubes produced by the worm ''Serpula vermicularis''. From: https://alchetron.com/Serpula-vermicularis | 1 |