File list
This special page shows all uploaded files.
| Date | Name | Thumbnail | Size | User | Description | Versions |
|---|---|---|---|---|---|---|
| 13:50, 13 June 2019 | M2EnergyDissipation.jpg (file) |  |
117 KB | Dronkers J | Estimates of M2 tidal energy dissipation based on six years of altimeter data from the TOPEX/Poseidon satellite. | 1 |
| 21:43, 31 May 2019 | TidalAsymmetryWorldMap.jpg (file) |  |
293 KB | Dronkers J | World map of tidal asymmetry Song et al. (2011). | 1 |
| 22:45, 25 May 2019 | FlumeUndularBores.jpg (file) |  |
234 KB | Dronkers J | Experimental study of undular bores (Favre-waves) in open rectangular channels. | 1 |
| 22:39, 25 May 2019 | PetitcodiacRiver-KamparRiver.jpg (file) | 436 KB | Dronkers J | Left image: Tidal bore in the Petitcodiac River, which is undular at the middle of the channel and breaking near the channel banks. Right image: Breaking tidal bore in the Kampar River, Sumatra. | 1 | |
| 22:11, 25 May 2019 | BreakingBoreLES.jpg (file) |  |
64 KB | Dronkers J | Large Eddy Simulation of turbulence generated by a weak breaking bore. | 1 |
| 22:10, 25 May 2019 | FlumeUndularBoresDye.jpg (file) | 30 KB | Dronkers J | Experimental study of tidal-like bore using a laser sheet and fluorescent dye. | 1 | |
| 21:18, 25 May 2019 | PetitcodiacRiver2.jpg (file) |  |
275 KB | Dronkers J | Tidal bore in the Petitcodiac River, which is undular at the middle of the channel and breaking near the channel banks. | 1 |
| 21:16, 25 May 2019 | GaronneOndularBoreDiffraction.jpg (file) |  |
99 KB | Dronkers J | Left image: Undular tidal bore on the Garonne River. Right image: Tidal bore diffraction around an island of the Garonne River. | 1 |
| 21:14, 25 May 2019 | GaronneObservationOndularBoreDevelopment.jpg (file) |  |
177 KB | Dronkers J | Tidal wave distortion and bore formation in the Gironde-Garonne estuary at spring tide. Tidal bore illustrations at Podensac field site, located 126 km upstream the river mouth. | 1 |
| 18:19, 25 May 2019 | SedimentTideBoreSaintMichel.jpg (file) | 731 KB | Dronkers J | Tide elevation, current velocity and suspended sediment concentration during springtide on a tidal flat in the Baie du Mont Saint Michel and tidal bore photo. | 1 | |
| 17:50, 25 May 2019 | TidalFlatBoreFormation-MorecambeBay.jpg (file) | 241 KB | Dronkers J | Schematic representation of successive stages of tidal bore development on a tidal flat and tidal bore in Morecambe Bay. | 1 | |
| 17:46, 25 May 2019 | Seine-Qiangtang.jpg (file) |  |
366 KB | Dronkers J | Tidal bores in the Seine River (around 1960) and in the Qiangtang estuary. | 1 |
| 15:42, 25 May 2019 | TidalBoreFormation TidalFlat.jpg (file) |  |
103 KB | Dronkers J | Schematic representation of the development of a tidal bore when the tidal flood wave propagates from a tidal basin into a shallow tidal flat channel. | 1 |
| 17:24, 16 May 2019 | TidalAsymmetryRiverFlow.jpg (file) |  |
94 KB | Dronkers J | Tidal asymmetry indicator versus river flow indicator for different estuaries. | 1 |
| 13:03, 15 May 2019 | HooghlyTidalWaveDeformation.jpg (file) |  |
358 KB | Dronkers J | Tide curves in the Hooghly estuary observed during a high springtide (19/9/2009) at different tide gauges along the estuary. | 1 |
| 22:17, 14 May 2019 | TidalAsymmetryEstuaries.jpg (file) |  |
84 KB | Dronkers J | The relative tidal amplitude and corresponding relative difference between HW and LW propagation speed for different estuaries. | 1 |
| 22:15, 14 May 2019 | CharenteSpringNeapTide.jpg (file) |  |
182 KB | Dronkers J | Tidal elevation (solid) and current velocity (dotted) curves in the Charente estuary for springtide (red) and neaptide (blue). | 1 |
| 22:13, 14 May 2019 | EquilibriumTidalLagoons.jpg (file) |  |
203 KB | Dronkers J | The relative tidal amplitude versus the relative intertidal area for a large number of tidal basins with small (or without) river inflow. | 1 |
| 22:10, 14 May 2019 | PropagatingWaveDeformation.jpg (file) |  |
112 KB | Dronkers J | Deformation of a frictionless propagating wave. | 1 |
| 14:18, 6 May 2019 | PetitcodiacRiver Credit Jim Hoffman.jpg (file) |  |
349 KB | Dronkers J | Breaking undular tidal bore in the Petitcodiac River at Moncton, Canada. | 1 |
| 20:11, 5 May 2019 | UndularBoreModel.jpg (file) |  |
90 KB | Dronkers J | Model simulation of an undular tidal bore. | 1 |
| 22:19, 4 May 2019 | SedimentTideSaintMichel.jpg (file) |  |
512 KB | Dronkers J | Current velocity and suspended sediment concentration at a tidal flat in the Baie du Mont Saint Michel for a fast rising tide. | 1 |
| 21:23, 4 May 2019 | ElevationVelocityGaronneTidalBore.jpg (file) |  |
124 KB | Dronkers J | Observations of surface elevation and current velocity at the passage of an non-breaking undular bore in the Garonne River at Podensac, for a large spring tidal range and low river discharge. | 1 |
| 18:41, 4 May 2019 | UndularTidalBoreGaronne.jpg (file) |  |
336 KB | Dronkers J | Non-breaking undular tidal bore in the Garonne River. | 1 |
| 18:35, 4 May 2019 | TidalBoreKamparRiver.jpg (file) |  |
265 KB | Dronkers J | Breaking tidal bore in the Kampar River, Sumatra. | 1 |
| 09:41, 1 May 2019 | SeineBore.jpg (file) |  |
407 KB | Dronkers J | Tidal bore in the Seine at Caudebec in 1963 (Lynch, 1982). | 2 |
| 16:04, 28 April 2019 | SeineTidalDeformation.jpg (file) |  |
211 KB | Dronkers J | Tidal wave deformation in the Seine in 1876 and 1998. | 1 |
| 14:19, 28 April 2019 | PrismaticTidalFlatChannel.jpg (file) |  |
48 KB | Dronkers J | Prismatic estuarine channel with tidal flats. | 1 |
| 17:17, 8 April 2019 | Second MSSA components.jpg (file) |  |
113 KB | Dronkers J | Left panel: Second MSSA component standing wave part a. Right panel: Second MSSA component standing wave part b. | 1 |
| 17:17, 8 April 2019 | First MSSA components.jpg (file) |  |
112 KB | Dronkers J | Left panel: First MSSA component standing wave part a. Right panel: First MSSA component standing wave part b. | 1 |
| 17:15, 8 April 2019 | Spectral bands.jpg (file) |  |
228 KB | Dronkers J | Left panel: Spectral bands with water wave components. Right panel: Spectral bands with residual slow-varying components. | 1 |
| 16:09, 8 April 2019 | Smooth representation of water level.jpg (file) |  |
28 KB | Dronkers J | Smooth representation of water level. | 2 |
| 15:51, 8 April 2019 | Third MSSA component standing wave part a, b and c.jpg (file) |  |
51 KB | Dronkers J | Third MSSA component standing wave part a, b and c. | 1 |
| 15:51, 8 April 2019 | Spectral bands with water wave components.jpg (file) |  |
124 KB | Dronkers J | Spectral bands with water wave components. | 1 |
| 15:50, 8 April 2019 | Spectral bands with residual slow-varying components.jpg (file) |  |
104 KB | Dronkers J | Spectral bands with residual slow-varying components. | 1 |
| 15:49, 8 April 2019 | Second MSSA component standing wave part b.jpg (file) |  |
55 KB | Dronkers J | Second MSSA component standing wave part b. | 1 |
| 15:49, 8 April 2019 | Second MSSA component standing wave part a.jpg (file) |  |
61 KB | Dronkers J | Second MSSA component standing wave part a. | 1 |
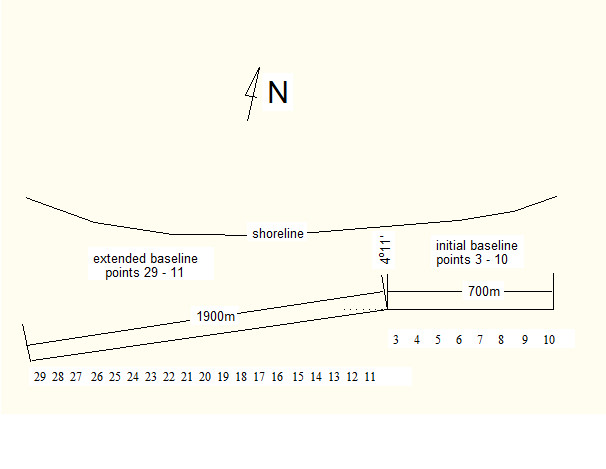
| 15:48, 8 April 2019 | Geodetic base for shoreline measurements.jpg (file) |  |
35 KB | Dronkers J | Geodetic base for shoreline measurements. | 1 |
| 15:48, 8 April 2019 | First MSSA component standing wave part b.jpg (file) |  |
51 KB | Dronkers J | First MSSA component standing wave part b. | 1 |
| 15:47, 8 April 2019 | First MSSA component standing wave part a.jpg (file) |  |
65 KB | Dronkers J | First MSSA component standing wave part a. | 1 |
| 18:23, 25 February 2019 | FlowChartRicePaddyProduction.jpg (file) |  |
146 KB | Dronkers J | Example of a flowchart showing flows of material in physical and monetary terms through a paddy and rice production chain (FAO, 2006) | 1 |
| 17:32, 25 February 2019 | InputOutputMatrixBelgium2000.jpg (file) |  |
1.12 MB | Dronkers J | Input-Output matrix for Belgium (2009) | 1 |
| 22:46, 22 February 2019 | AdaptationMeasuresUSAID.jpg (file) |  |
911 KB | Dronkers J | Climate adaptation measures for the coastal zone (USAID, 2009) | 1 |
| 12:42, 21 February 2019 | SandBypassingSystemsInventory2008.jpg (file) |  |
307 KB | Dronkers J | Inventory of sand bypass systems (Loza, 2008). | 1 |
| 18:36, 16 February 2019 | Zandmotor2012.jpg (file) |  |
324 KB | Dronkers J | A massive foreshore nourishment increases the strength of the narrow dune system protecting the coast between Rotterdam and The Hague (Netherlands). | 1 |
| 18:35, 16 February 2019 | NoordwijkDune.jpg (file) |  |
248 KB | Dronkers J | An artificial dune protects the seafront of Noordwijk coastal village (Netherlands). | 1 |
| 18:34, 16 February 2019 | HumberWetlandRestoration.jpg (file) |  |
439 KB | Dronkers J | Realignment of coastal defences and wetland restoration projects in the Humber estuary (UK). | 1 |
| 18:32, 16 February 2019 | MangroveRestorationThailand.jpg (file) |  |
28 KB | Dronkers J | Mangrove reforestation project in Chachoengsao district, Thailand. | 1 |
| 17:43, 16 February 2019 | ICZMindicatorsDEDUCE.jpg (file) |  |
642 KB | Dronkers J | Quantitative ICZM indicators proposed by the DEDUCE project (Marti et al, 2007) | 2 |
| 17:25, 7 February 2019 | TypesCoastalWorks.jpg (file) |  |
75 KB | Dronkers J | Common types of coastal protection structures. | 1 |