File list
This special page shows all uploaded files.
| Date | Name | Thumbnail | Size | User | Description | Versions |
|---|---|---|---|---|---|---|
| 13:24, 5 June 2017 | BlondeauxFig3.jpg (file) |  |
51 KB | Dronkers J | Comparison between predicted (lines) and observed (points) ripple wavelengths. | 1 |
| 13:24, 5 June 2017 | BlondeauxFig2.jpg (file) |  |
78 KB | Dronkers J | Comparison between predicted (lines) and observed (points) ripple wavelengths. | 1 |
| 13:23, 5 June 2017 | BlondeauxFig1.jpg (file) |  |
94 KB | Dronkers J | Ripple marks in the Mediterranean Sea. Courtesy of José B. Ruiz. | 1 |
| 09:14, 31 May 2017 | BaldockFig3NEW2.jpg (file) |  |
50 KB | Dronkers J | Typical pattern of bore-driven swash oscillations (vertical component). Data show shoreline elevation versus time at Avoca Beach, NSW. Red and green squares indicate maxima and minima of individual swash events. Data courtesy of Dr Michael Hughes, NSW... | 1 |
| 21:26, 30 May 2017 | BaldockFig3NEW.jpg (file) |  |
42 KB | Dronkers J | Typical pattern of vertical shoreline oscillations (in metres) as a function of time (seconds). Redrawn from Stockdon, H. F., Holman, R. A., Howd, P. A. and Sallenger JR, A. H. 2006. Empirical parameterization of setup, swash, and runup. Coastal Engine... | 1 |
| 14:05, 30 May 2017 | BaldockFig7NEW.jpg (file) |  |
60 KB | Dronkers J | Contours of surface elevation with two different resistance coefficients, R=0 (blue lines) and R=0.01 (red dashed lines) in non-dimensional coordinates. From: Deng, X., H. Liu, Z. Jiang and T. E. Baldock, 2016. Swash flow properties with bottom resista... | 1 |
| 08:22, 30 May 2017 | BaldockFig10.jpg (file) |  |
333 KB | Dronkers J | A LIDAR system mounted above the swash zone, together with ultrasonic distance point sensors. Photo: Dr Chris Blenkinsopp, University of Bath, UK. | 1 |
| 08:21, 30 May 2017 | BaldockFig9.jpg (file) |  |
56 KB | Dronkers J | Measured normalized suspended sediment concentration indicated by colours mapped onto the normalised x*-t* plane representing the swash excursion and duration. From: Hughes, M. G., T. Aagaard and T. E. Baldock, 2007. Suspended sediment in the swash zon... | 1 |
| 08:19, 30 May 2017 | BaldockFig8.jpg (file) |  |
220 KB | Dronkers J | A turbulent bore containing entrained suspended sediment just prior to reaching the swash zone. Photo T. Baldock | 1 |
| 08:17, 30 May 2017 | BaldockFig7.jpg (file) |  |
38 KB | Dronkers J | Contours of surface elevation with two different resistance coefficients, R=0 (blue lines) and R=0.01 (red dashed lines) in non-dimensional coordinates. From Deng, X., H. Liu, Z. Jiang and T. E. Baldock, 2016. Swash flow properties with bottom resistan... | 1 |
| 08:16, 30 May 2017 | BaldockFig6.jpg (file) |  |
122 KB | Dronkers J | Forward (solid) and backward (dashed) characteristic curves (a), and contours of flow velocity (b), surface elevation (c) and depth (d) for swash initiated by a near uniform bore in non-dimensional coordinates. From: Guard, P. A. and T. E. Baldock, 200... | 1 |
| 08:11, 30 May 2017 | BaldockFig5.jpg (file) |  |
64 KB | Dronkers J | Washover fan deposited on Ocracoke Island, North Carolina, during Hurricane Isabel, September 2003. From: Donnelly, C., N. Kraus and M. Larson, 2006. State of knowledge on measurement and modeling of coastal overwash. Journal of Coastal Research 22: 96... | 1 |
| 08:10, 30 May 2017 | BaldockFig4.jpg (file) |  |
73 KB | Dronkers J | Swash energy spectra from (a) reflective, (b) intermediate, and (c) dissipative beach-states. From: Hughes, M. G., T. Aagaard, T. E. Baldock and H. E. Power, 2014. Spectral signatures for swash on reflective, intermediate and dissipative beaches. Marin... | 1 |
| 08:09, 30 May 2017 | BaldockFig3.jpg (file) |  |
27 KB | Dronkers J | Typical pattern of vertical shoreline oscillations (<math>\eta (t)</math>), the mean shoreline position (<math><\eta></math>) and runup maxima(*). From: Stockdon, H. F., Holman, R. A., Howd, P. A. and Sallenger JR, A. H. 2006. Empirical parameterizatio... | 1 |
| 08:07, 30 May 2017 | BaldockFig2b.jpg (file) |  |
388 KB | Dronkers J | Avoca Beach, NSW, Australia, a reflective beach. Photo shows the inner surf zone and a bore reaching the swash zone in the background and a swash uprush reaching the top of a beach berm in the foreground. Photo: Dr Hannah Power, University of Newcastle... | 1 |
| 08:05, 30 May 2017 | BaldockFig2a.jpg (file) |  |
328 KB | Dronkers J | Seven Mile Beach, NSW, Australia, a dissipative beach. Photo shows conditions after a swash rundown, with only small bores reaching the swash zone. Photo: Dr Hannah Power, University of Newcastle, NSW, Australia. | 1 |
| 08:04, 30 May 2017 | BaldockFig1.jpg (file) |  |
37 KB | Dronkers J | Definition sketch for the nearshore littoral zone (swash zone width exaggerated). | 1 |
| 15:49, 22 May 2017 | RSFFFig3NEW.jpg (file) |  |
67 KB | Dronkers J | Images from the Castelldefels beach video station (Catalonia, Spain) showing surf zone bar morphology at different times. a) shore parallel straight bar, b) incipient crescentic bar with relatively subtle undulations, c) large amplitude crescentic bar... | 1 |
| 15:34, 22 May 2017 | RSFFFig2NEW.jpg (file) |  |
93 KB | Dronkers J | Rhythmic shoreline features at various lengthscales. a) Beach cusps (Matingarahi, NZ. Source: courtesy of Prof. A.D. Short); b) up: megacups associated to transverse bars (Ebro delta, Catalonia (Spain), image taken by the authors); b) down: large beach... | 1 |
| 13:20, 16 May 2017 | RSFFFig9.jpg (file) |  |
55 KB | Dronkers J | Feedback mechanisms between shoreline undulations and waves involving both the surf and the shoaling zones. Left: Definition of absolute and relative wave incidence angles. The straight brown line represents the local shoreline orientation. Right: The... | 1 |
| 13:18, 16 May 2017 | RSFFFig8.JPG (file) |  |
44 KB | Dronkers J | Feedback mechanisms between shoreline undulations and waves involving both the surf and the shoaling zones. Wave incidence from the left. The blue lines with arrows indicate the wave rays. The brown arrows indicate the larger or smaller total sediment... | 1 |
| 13:17, 16 May 2017 | RSFFFig7.JPG (file) |  |
104 KB | Dronkers J | Bed-flow feedback mechanism associated to the wave driven longshore current in the surf zone. It can be based either on the shoreward deflection of the current by down-current oriented bars (a) or on the seaward deflection of the current by up-curren... | 1 |
| 13:16, 16 May 2017 | RSFFFig6.JPG (file) |  |
57 KB | Dronkers J | Bed-surf feedback mechanism based on the rip-current circulation in the surf zone. The yellow colour indicates emerged or submerged shallower areas, blue colour indicates submerged deeper areas. The lower/higher density of brown spots indicate the lowe... | 1 |
| 13:15, 16 May 2017 | RSFFFig5.jpg (file) |  |
114 KB | Dronkers J | Shoreline sand waves at the Gulf of Finland, Russia. | 1 |
| 13:15, 16 May 2017 | RSFFFig4.jpg (file) |  |
73 KB | Dronkers J | Long transverse finger bars at Horn Island, Mississippi, USA. | 1 |
| 13:14, 16 May 2017 | RSFFFig3.jpg (file) |  |
73 KB | Dronkers J | Images from the Castelldefels beach video station (Catalonia, Spain) showing surf zone bar morphology at different times. a) shore parallel straight bar, b) incipient crescentic bar with relatively subtle undulations, c) large amplitude crescentic bar... | 1 |
| 13:13, 16 May 2017 | RSFFFig2.jpg (file) |  |
84 KB | Dronkers J | Rhythmic shoreline features at various lengthscales. a) Beach cusps, b) up: megacups associated to transverse bars, Ebro delta, Spain, b) down: large beach cusps, Angola, c) up: megacusps associated to a crescentic bar, Saint Cyprien, France, c) down:... | 1 |
| 13:07, 16 May 2017 | RSFFFig1.jpg (file) |  |
75 KB | Dronkers J | Left: Rhythmic shoreline features forced by a breakwater system. Right: Picture taken at the Arcachon bay and it shows ripple marks and shoreline undulations at low tide. | 1 |
| 16:49, 4 May 2017 | HanFig7NEW.jpg (file) |  |
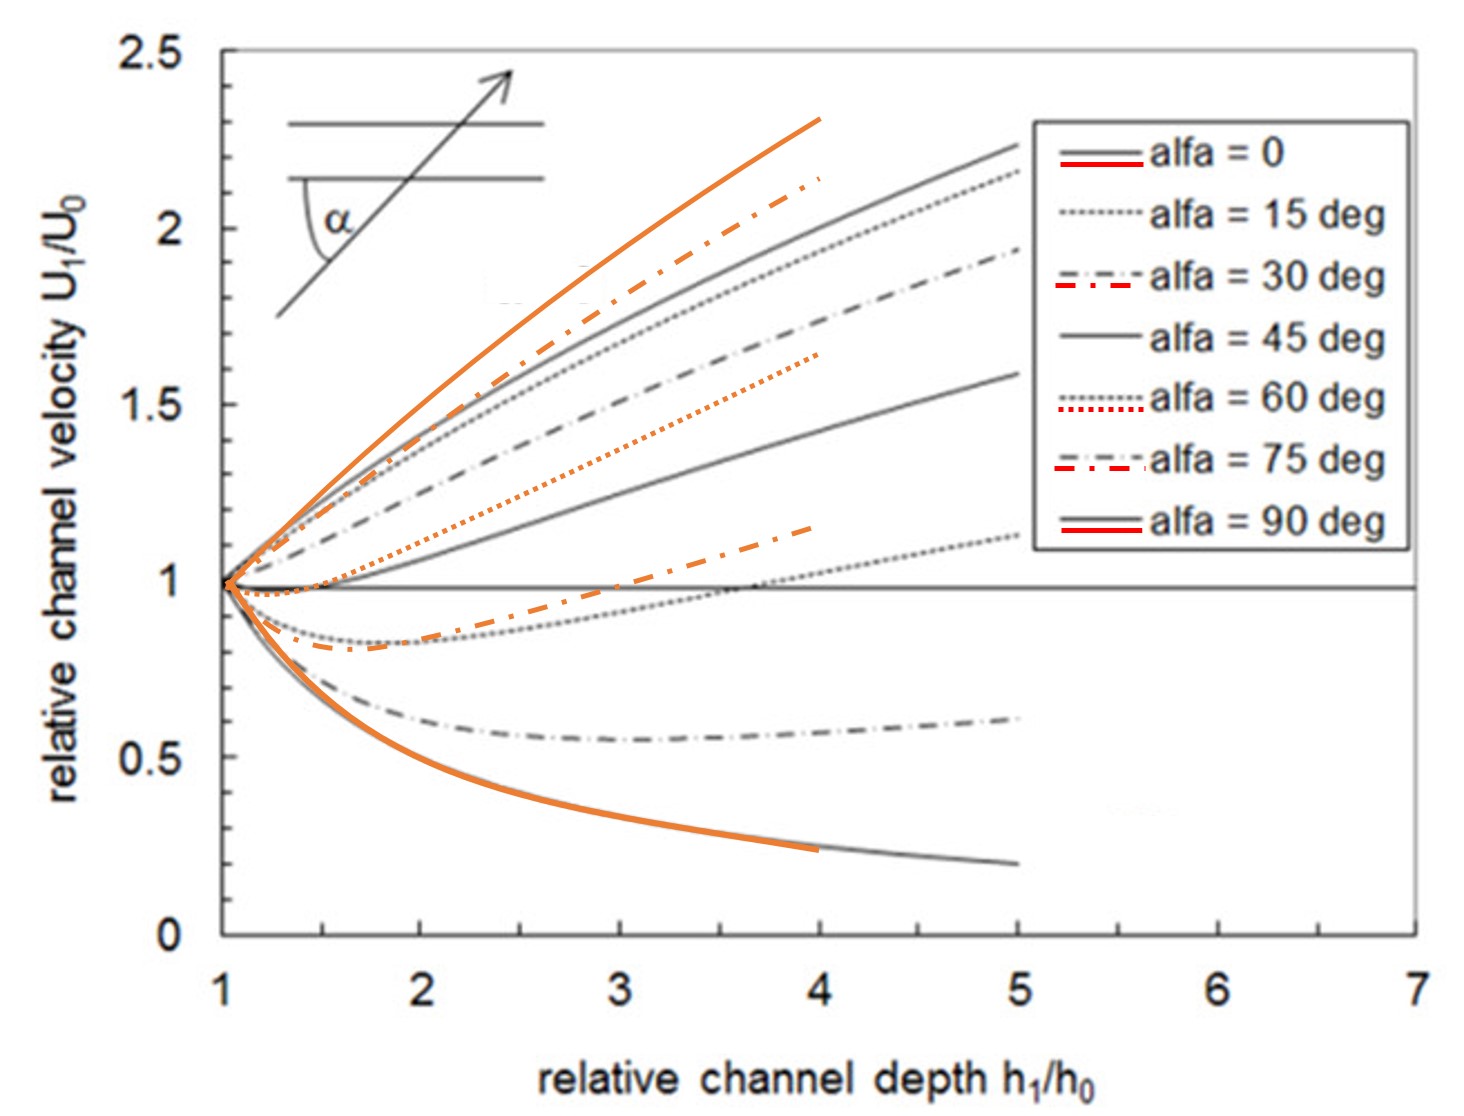
150 KB | Dronkers J | Ratio flow velocity inside and outside channel according to equation 4 (black curves) and the three-dimensional approach by Jensen et al. (red curves). | 1 |
| 15:37, 23 April 2017 | HanFig9new.jpg (file) |  |
61 KB | Dronkers J | Maximum wave-induced bed shear stresses on channel bed as a function of wave-induced bed shear stresses in the surrounding waters and relative channel depth. | 1 |
| 14:04, 23 April 2017 | HanFig9.jpg (file) |  |
58 KB | Dronkers J | Maximal wave-induced bed shear stresses on channel bed as a function of wave-induced bed shear stresses in the surrounding waters and relative channel depth. | 1 |
| 14:03, 23 April 2017 | HanFig8.jpg (file) |  |
21 KB | Dronkers J | Cartoon of extra water to be attracted. | 1 |
| 14:02, 23 April 2017 | HanFig7.jpg (file) |  |
93 KB | Dronkers J | Ratio flow velocity inside and outside channel according to equation (4) and the three-dimensional approach by Jensen et al. (1999). | 1 |
| 13:13, 23 April 2017 | HanFig6.jpg (file) |  |
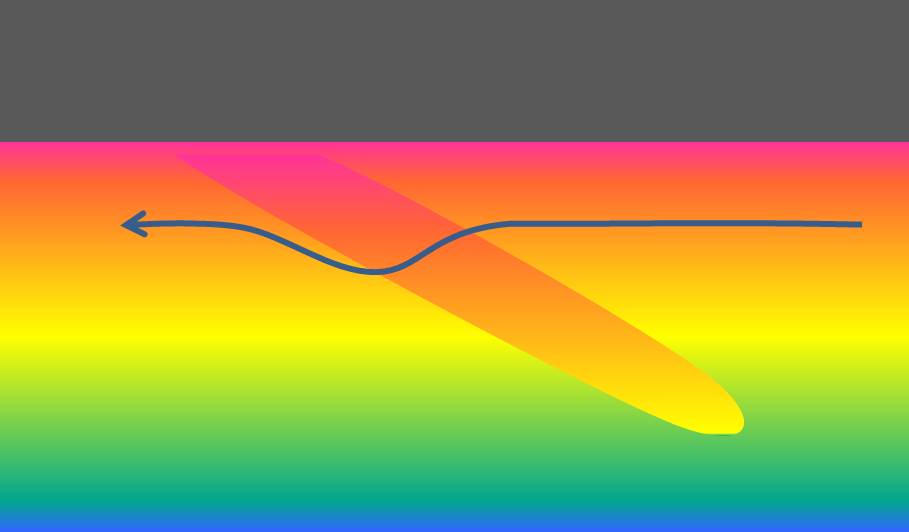
25 KB | Dronkers J | Refraction of current oblique to navigation channel. | 1 |
| 13:12, 23 April 2017 | HanFig5.jpg (file) |  |
22 KB | Dronkers J | Cartoon of shipping-induced siltation. | 1 |
| 13:12, 23 April 2017 | HanFig4.jpg (file) |  |
10 KB | Dronkers J | Empirical coefficients for harbor siltation. | 1 |
| 13:11, 23 April 2017 | HanFig3.jpg (file) |  |
46 KB | Dronkers J | Zero-order mass balance for harbor siltation. | 1 |
| 13:10, 23 April 2017 | HanFig2.jpg (file) |  |
76 KB | Dronkers J | Timing of water exchange processes over a tidal period. | 1 |
| 13:09, 23 April 2017 | HanFig1.jpg (file) |  |
48 KB | Dronkers J | Visualization of exchange processes between harbor basin and surrounding. | 1 |
| 21:27, 14 March 2017 | FlowPerturbationObliqueRidge1.jpg (file) |  |
23 KB | Dronkers J | Perturbation of frictionless flow over a shoreface-connected ridge. | 1 |
| 21:26, 14 March 2017 | ShoreObliqueFlowPath1.jpg (file) |  |
22 KB | Dronkers J | Flow path over a shoreface-connected ridge. | 1 |
| 21:26, 14 March 2017 | TidalRidgeSandTransport1.jpg (file) | 47 KB | Dronkers J | Sand transport convergence at the tidal ridge crest. | 1 | |
| 21:24, 14 March 2017 | CyclonicRidgeCirculation1.jpg (file) |  |
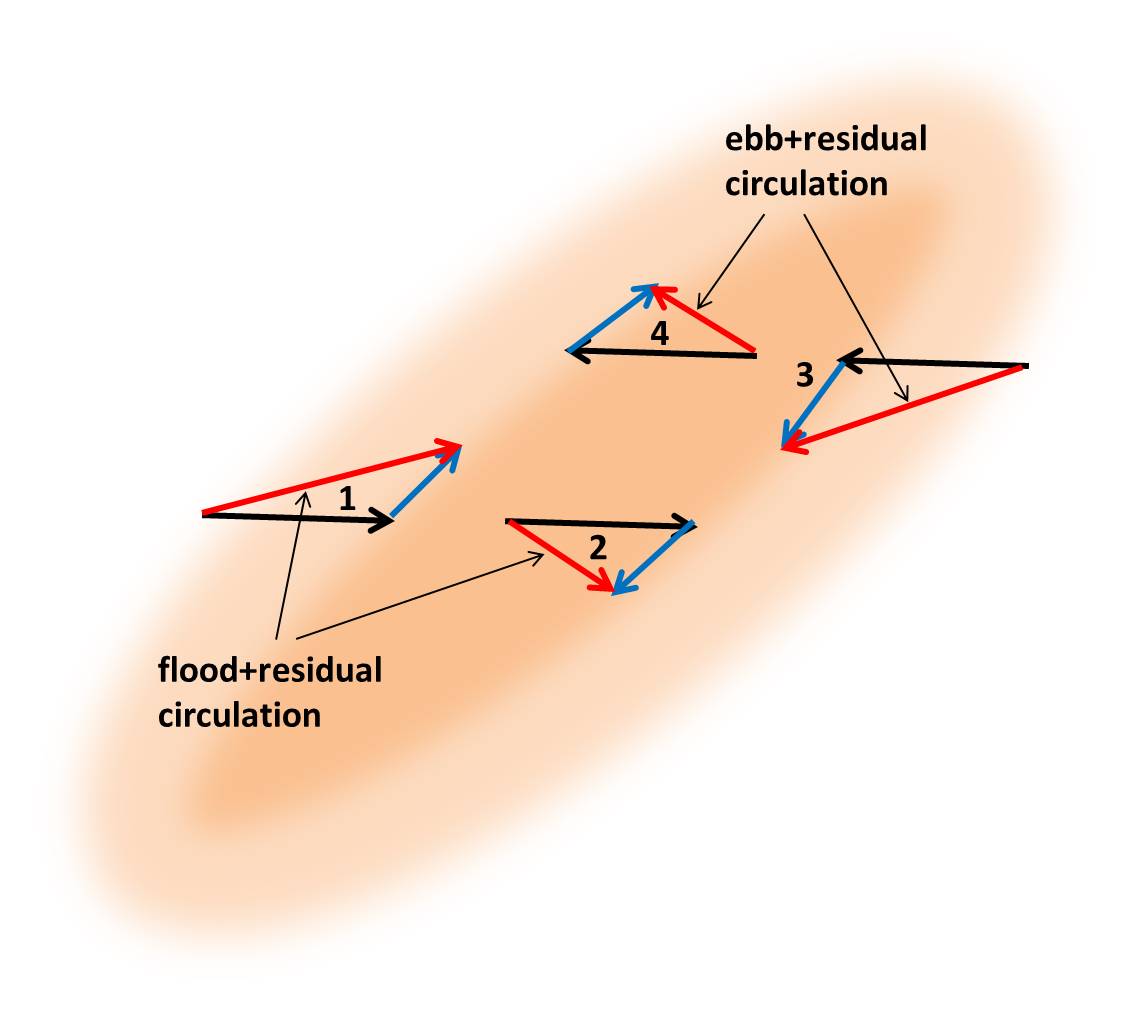
68 KB | Dronkers J | Vorticity balance at a tidal sand ridge which is rotated cyclonically with respect to the dominant flood and ebb flow direction. | 1 |
| 21:23, 14 March 2017 | AnticyclonicRidgeCirculation2.jpg (file) |  |
61 KB | Dronkers J | Vorticity balance at a tidal sand ridge which is rotated anticyclonically with respect to the dominant flood and ebb flow direction. | 1 |
| 21:20, 14 March 2017 | AnticyclonicRidgeCirculation1.jpg (file) |  |
57 KB | Dronkers J | Vorticity balance at a tidal sand ridge which is rotated anticyclonically with respect to the dominant flood and ebb flow direction. | 1 |
| 21:12, 14 March 2017 | TidalRidgeFlow1.jpg (file) |  |
50 KB | Dronkers J | Paths of flood and ebb flow over a tidal sand ridge. | 1 |
| 21:07, 14 March 2017 | TidalRidgeFlow.jpg (file) |  |
50 KB | Dronkers J | New file: Paths of flood and ebb flow over a tidal sand ridge. | 4 |
| 22:26, 13 March 2017 | LongBedWaves.jpg (file) |  |
103 KB | Dronkers J | Multibeam record of long bed waves in a small area of the southern North Sea. | 1 |
| 22:24, 13 March 2017 | FlowPerturbationObliqueRidge.jpg (file) |  |
21 KB | Dronkers J | Perturbation of frictionless flow over a shoreface-connected ridge. | 1 |
| 22:23, 13 March 2017 | ShoreObliqueFlowPath.jpg (file) |  |
26 KB | Dronkers J | Flow path over a shoreface-connected ridge. | 1 |