File list
This special page shows all uploaded files.
| Date | Name | Thumbnail | Size | User | Description | Versions |
|---|---|---|---|---|---|---|
| 13:12, 23 April 2017 | HanFig5.jpg (file) |  |
22 KB | Dronkers J | Cartoon of shipping-induced siltation. | 1 |
| 13:12, 23 April 2017 | HanFig4.jpg (file) |  |
10 KB | Dronkers J | Empirical coefficients for harbor siltation. | 1 |
| 13:11, 23 April 2017 | HanFig3.jpg (file) |  |
46 KB | Dronkers J | Zero-order mass balance for harbor siltation. | 1 |
| 13:10, 23 April 2017 | HanFig2.jpg (file) |  |
76 KB | Dronkers J | Timing of water exchange processes over a tidal period. | 1 |
| 13:09, 23 April 2017 | HanFig1.jpg (file) |  |
48 KB | Dronkers J | Visualization of exchange processes between harbor basin and surrounding. | 1 |
| 21:27, 14 March 2017 | FlowPerturbationObliqueRidge1.jpg (file) |  |
23 KB | Dronkers J | Perturbation of frictionless flow over a shoreface-connected ridge. | 1 |
| 21:26, 14 March 2017 | ShoreObliqueFlowPath1.jpg (file) |  |
22 KB | Dronkers J | Flow path over a shoreface-connected ridge. | 1 |
| 21:26, 14 March 2017 | TidalRidgeSandTransport1.jpg (file) | 47 KB | Dronkers J | Sand transport convergence at the tidal ridge crest. | 1 | |
| 21:24, 14 March 2017 | CyclonicRidgeCirculation1.jpg (file) |  |
68 KB | Dronkers J | Vorticity balance at a tidal sand ridge which is rotated cyclonically with respect to the dominant flood and ebb flow direction. | 1 |
| 21:23, 14 March 2017 | AnticyclonicRidgeCirculation2.jpg (file) |  |
61 KB | Dronkers J | Vorticity balance at a tidal sand ridge which is rotated anticyclonically with respect to the dominant flood and ebb flow direction. | 1 |
| 21:20, 14 March 2017 | AnticyclonicRidgeCirculation1.jpg (file) |  |
57 KB | Dronkers J | Vorticity balance at a tidal sand ridge which is rotated anticyclonically with respect to the dominant flood and ebb flow direction. | 1 |
| 21:12, 14 March 2017 | TidalRidgeFlow1.jpg (file) |  |
50 KB | Dronkers J | Paths of flood and ebb flow over a tidal sand ridge. | 1 |
| 21:07, 14 March 2017 | TidalRidgeFlow.jpg (file) |  |
50 KB | Dronkers J | New file: Paths of flood and ebb flow over a tidal sand ridge. | 4 |
| 22:26, 13 March 2017 | LongBedWaves.jpg (file) |  |
103 KB | Dronkers J | Multibeam record of long bed waves in a small area of the southern North Sea. | 1 |
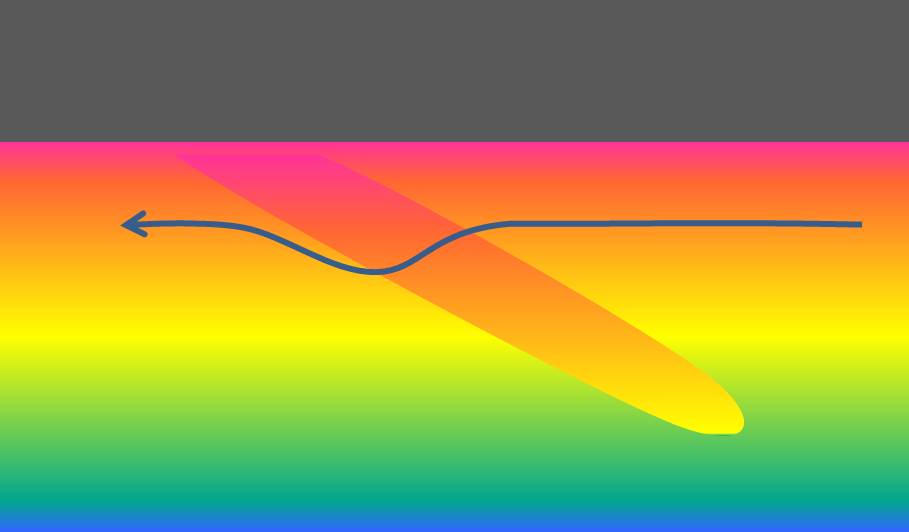
| 22:24, 13 March 2017 | FlowPerturbationObliqueRidge.jpg (file) |  |
21 KB | Dronkers J | Perturbation of frictionless flow over a shoreface-connected ridge. | 1 |
| 22:23, 13 March 2017 | ShoreObliqueFlowPath.jpg (file) |  |
26 KB | Dronkers J | Flow path over a shoreface-connected ridge. | 1 |
| 22:22, 13 March 2017 | LongIslandObliqueRidges.jpg (file) |  |
94 KB | Dronkers J | Shoreface-connected ridges at the coast of Long Island, US Atlantic coast. | 1 |
| 22:21, 13 March 2017 | DutchCoastObliqueRidges.jpg (file) |  |
100 KB | Dronkers J | Bathymetry of the inner shelf slope at the Flemish-Dutch coast. | 1 |
| 22:20, 13 March 2017 | TidalRidgeSandTransport.jpg (file) | 43 KB | Dronkers J | Sand transport convergence at the tidal ridge crest. | 1 | |
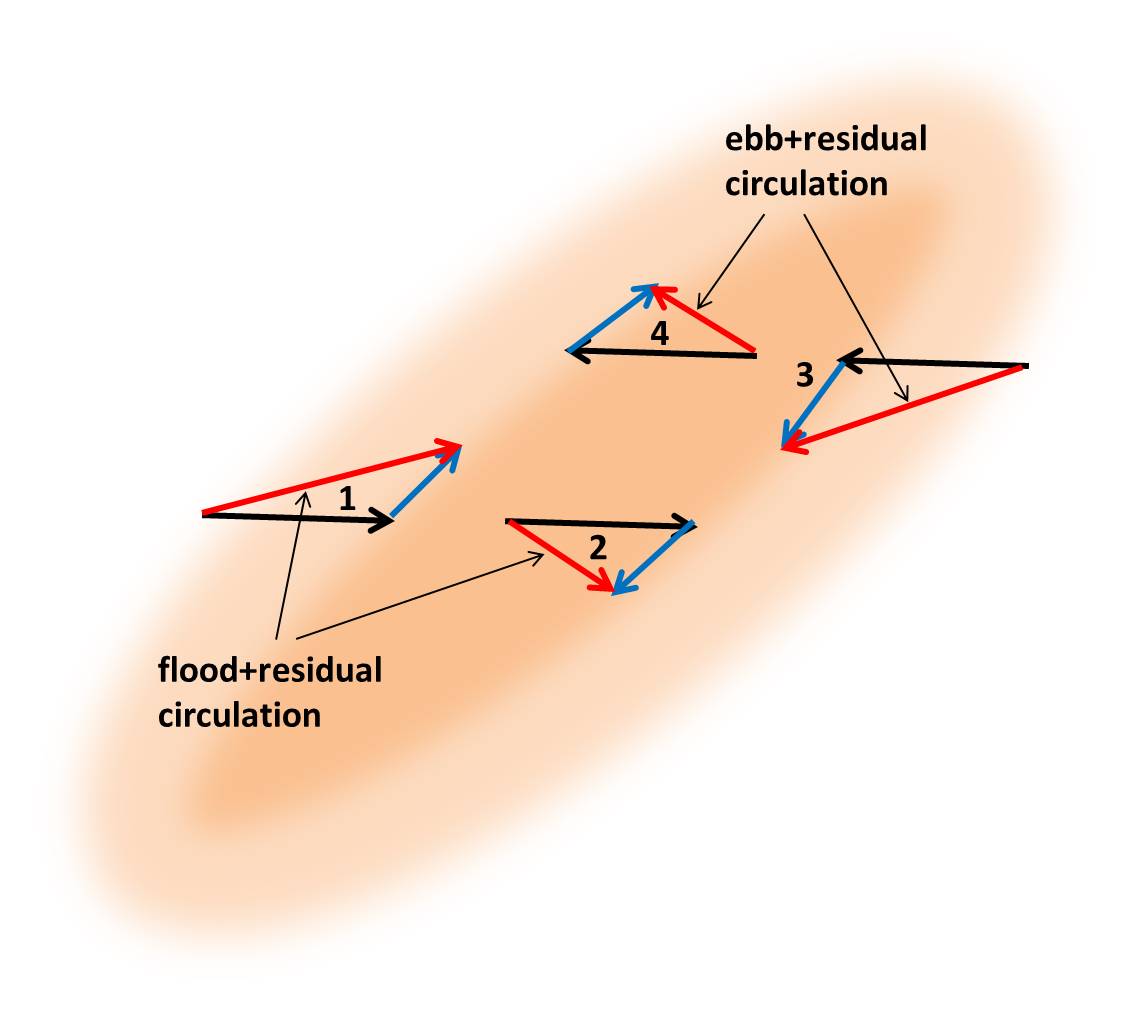
| 22:15, 13 March 2017 | AnticyclonicRidgeCirculation.jpg (file) |  |
57 KB | Dronkers J | Vorticity balance at a tidal sand ridge which is rotated anticyclonically with respect to the dominant flood and ebb flow direction. | 1 |
| 22:14, 13 March 2017 | CyclonicRidgeCirculation.jpg (file) |  |
64 KB | Dronkers J | Vorticity balance at a tidal ridge which is rotated cyclonically with respect to the dominant flood and ebb flow direction. | 1 |
| 22:11, 13 March 2017 | EastChinaSeaTidalRidges.jpg (file) |  |
120 KB | Dronkers J | Tidal sand ridge field in the East China Sea. | 1 |
| 22:10, 13 March 2017 | NorthSeaTidalRidges.jpg (file) |  |
85 KB | Dronkers J | Tidal sand ridge fields in the North Sea. | 1 |
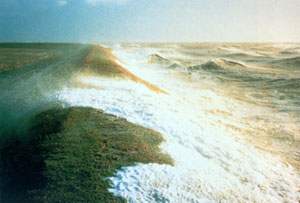
| 12:27, 23 January 2017 | EmbankmentOvertoppingGermany.jpg (file) |  |
16 KB | Dronkers J | Wave overtopping of a coastal embankment in Germany caused by a wave storm event. | 1 |
| 23:10, 22 January 2017 | WaveShoaling.jpg (file) |  |
79 KB | Dronkers J | Significant wave height values of incoming and outgoing infragravity waves on a sloping 1:70 laboratory bed for different wave frequencies. | 1 |
| 20:16, 20 January 2017 | SandSuspension.jpg (file) |  |
122 KB | Dronkers J | Conceptual figure for sand suspension mechanisms and resulting infragravity-wave flux directions. | 1 |
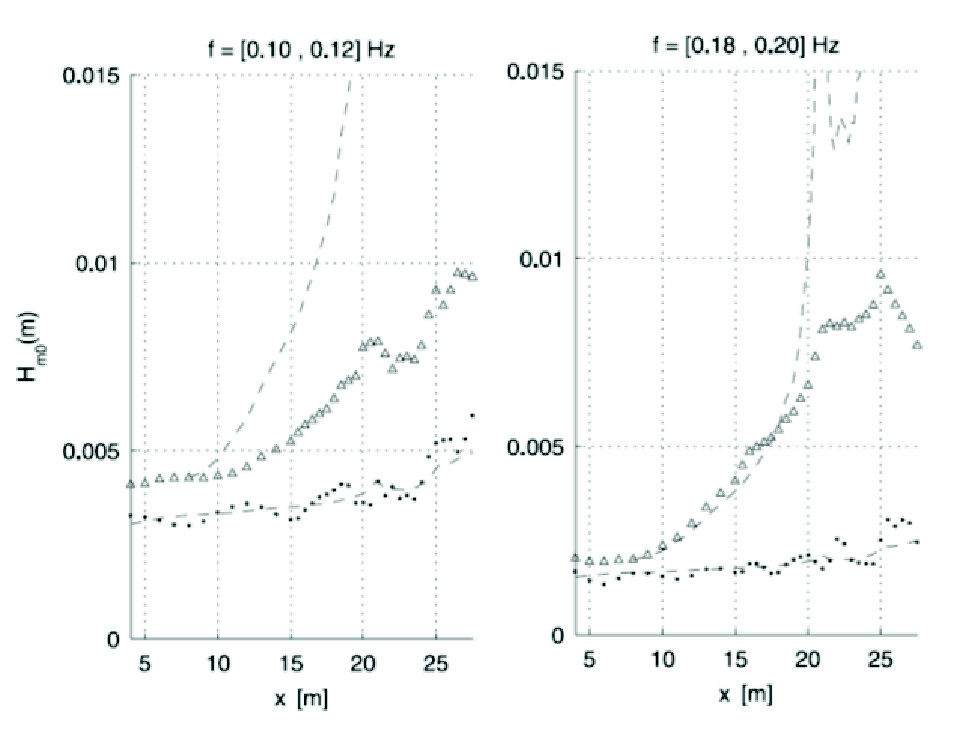
| 20:15, 20 January 2017 | WaveHeight.jpg (file) |  |
512 KB | Dronkers J | Significant wave height values of incoming (triangles) and outgoing (dots) infragravity waves for different frequency bands. | 1 |
| 20:13, 20 January 2017 | WaveGroups.jpg (file) |  |
218 KB | Dronkers J | Merging of two wave trains of slightly different wave lengths. | 1 |
| 20:11, 20 January 2017 | WaveSpectrum.jpg (file) |  |
344 KB | Dronkers J | Classification of ocean waves according to wave period. | 1 |
| 12:42, 26 November 2016 | MehtaNewTable1.jpg (file) | 67 KB | Dronkers J | Particle classification by property. | 1 | |
| 12:21, 26 November 2016 | Mehta Table2 new.jpg (file) |  |
56 KB | Dronkers J | Erosion flux equations. | 1 |
| 12:20, 26 November 2016 | MehtaNewFig15.jpg (file) |  |
80 KB | Dronkers J | Dependence of fluid mud entrainment flux on wet bulk density. | 1 |
| 12:19, 26 November 2016 | MehtaNewFig11.jpg (file) |  |
168 KB | Dronkers J | Relationship between bed floc erosion shear strength and viscoplastic yield stress. | 1 |
| 12:18, 26 November 2016 | MehtaNewFig10.jpg (file) |  |
95 KB | Dronkers J | Erosion flux against bed shear stress. | 1 |
| 12:17, 26 November 2016 | MehtaNewFig7.jpg (file) |  |
107 KB | Dronkers J | Yield stress variation with floc volume fraction for the Gironde sediment. | 1 |
| 12:17, 26 November 2016 | MehtaNewFig6.jpg (file) |  |
73 KB | Dronkers J | Layered structure of flocculated sediment in water and in the bed. | 1 |
| 12:16, 26 November 2016 | MehtaNewFig5.jpg (file) |  |
162 KB | Dronkers J | Settling velocity as a function of volume fraction. | 1 |
| 12:15, 26 November 2016 | MehtaNewFig4.jpg (file) |  |
162 KB | Dronkers J | Variation of floc settling velocity with shear rate and volume fraction. | 1 |
| 12:15, 26 November 2016 | MehtaNewFig3.jpg (file) |  |
181 KB | Dronkers J | Variation of floc settling velocity with volume fraction and shear rate. | 1 |
| 12:13, 26 November 2016 | MehtaNewFig2.jpg (file) |  |
123 KB | Dronkers J | Floc excess (bulk) density against diameter based on flocculator experiments. | 1 |
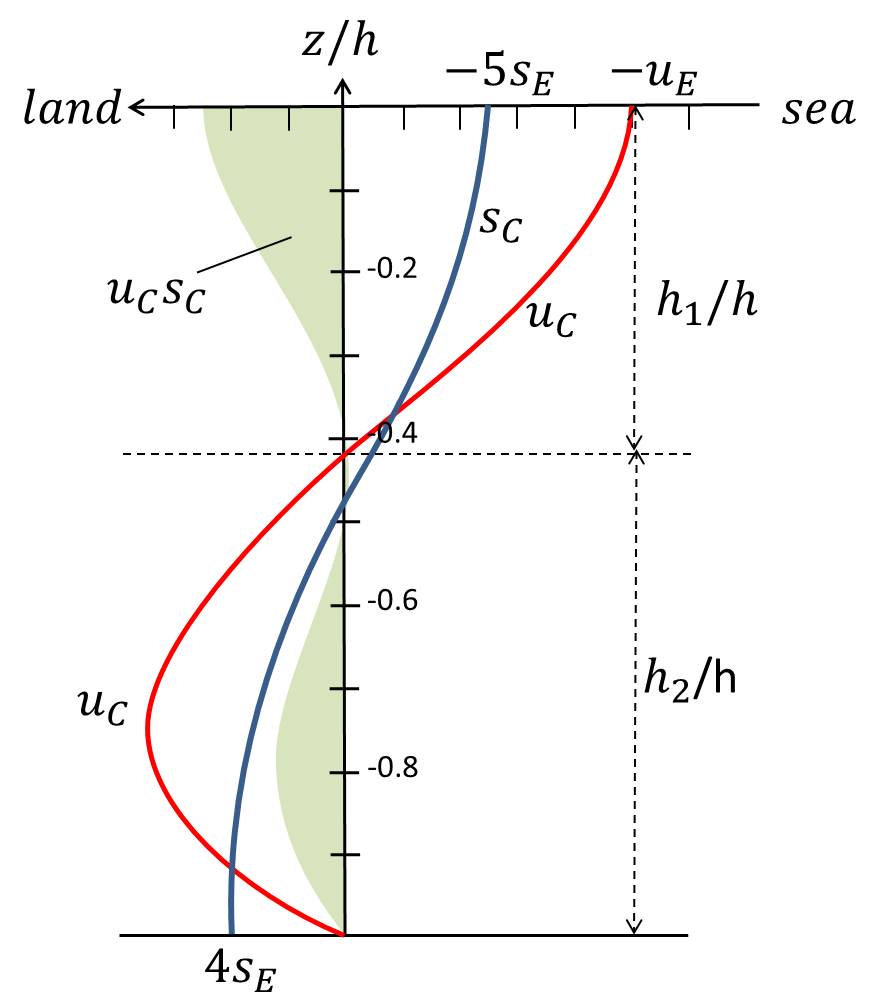
| 16:00, 25 November 2016 | VelSalProfilesNew.jpg (file) |  |
53 KB | Dronkers J | Vertical profiles of estuarine circulation and salinity according to the classical theory. | 1 |
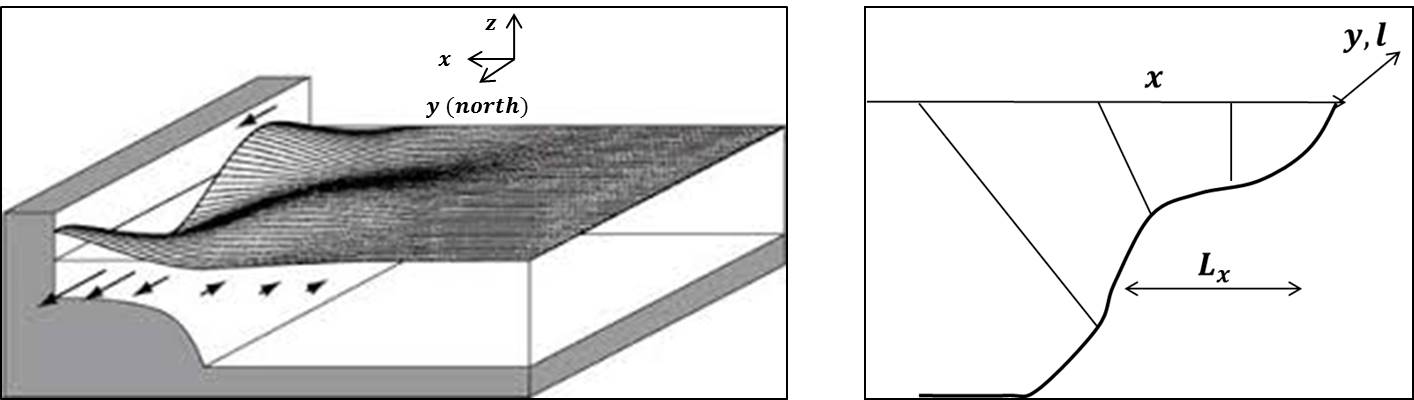
| 20:59, 19 November 2016 | CTW 1 3.jpg (file) |  |
45 KB | Dronkers J | Left: Sketch of form of elevation for mode 1 coastal-trapped wave.Right: Sketch of cross-slope structure of mode 3 coastal-trapped wave. | 1 |
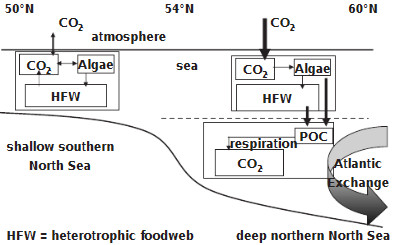
| 20:37, 19 November 2016 | Cpump.jpg (file) |  |
32 KB | Dronkers J | Sketch of south-north section through the North Sea. | 2 |
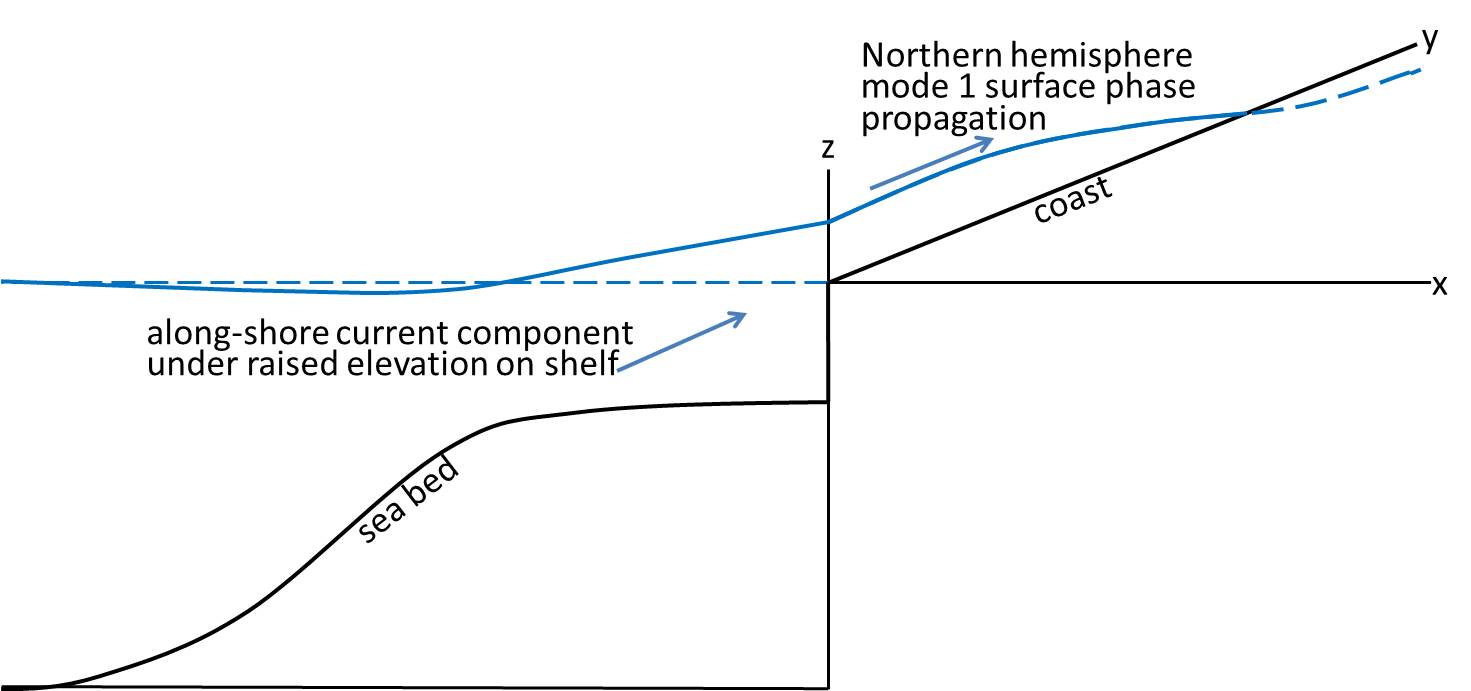
| 20:36, 19 November 2016 | CTWnew.jpg (file) |  |
58 KB | Dronkers J | Sketch of form of elevation for mode 1 coastal-trapped wave. | 1 |
| 13:40, 12 November 2016 | CTWandNodes.jpg (file) |  |
45 KB | Dronkers J | Left: Sketch of form of elevation for mode 1 coastal-trapped wave. Right: Sketch of cross-slope structure of mode 3 coastal-trapped wave. | 1 |
| 12:41, 12 November 2016 | JHtable.jpg (file) |  |
81 KB | Dronkers J | Some ocean – shelf sea interaction studies. | 1 |
| 12:40, 12 November 2016 | SeaLevel.jpg (file) |  |
72 KB | Dronkers J | Map of rates of change in sea surface height (geocentric sea level) for the period 1993–2012 from satellite altimetry. | 1 |
| 12:38, 12 November 2016 | UpwellCa.jpg (file) |  |
216 KB | Dronkers J | Upwelling of California with meanders and filaments shown by cooler sea-surface temperature. | 1 |
| 12:37, 12 November 2016 | LeeuwinU.jpg (file) |  |
30 KB | Dronkers J | The poleward Leeuwin current off Western Australia shown by warm sea-surface temperature. | 1 |
| 12:37, 12 November 2016 | InternalW.jpg (file) |  |
67 KB | Dronkers J | Thermistor chain cross-section of temperature (°C) through internal wave packet over continental slope depth 400 m. | 1 |