File list
This special page shows all uploaded files.
| Date | Name | Thumbnail | Size | User | Description | Versions |
|---|---|---|---|---|---|---|
| 22:22, 4 August 2016 | CamFig1.jpg (file) |  |
83 KB | Dronkers J | Profile of the time-dependent velocity (a) and bed shear stress (b) in the wave direction | 1 |
| 14:31, 2 August 2016 | Hawaii.gif (file) |  |
164 KB | Nelle Meyers | © 2015 Ezilon.com Regional Maps http://www.ezilon.com/maps/united-states/hawaii-physical-maps.html | 1 |
| 14:09, 2 August 2016 | New-Zealand-physical-map.gif (file) |  |
350 KB | Nelle Meyers | © 2015 Ezilon.com Regional Maps http://www.ezilon.com/maps/oceania/new-zealand-physical-maps.html | 1 |
| 07:57, 7 July 2016 | WesternScheldt.jpg (file) |  |
214 KB | Dronkers J | Western Scheldt and Scheldt estuary | 2 |
| 16:25, 6 July 2016 | Columbia.jpg (file) |  |
241 KB | Dronkers J | Columbia River estuary | 1 |
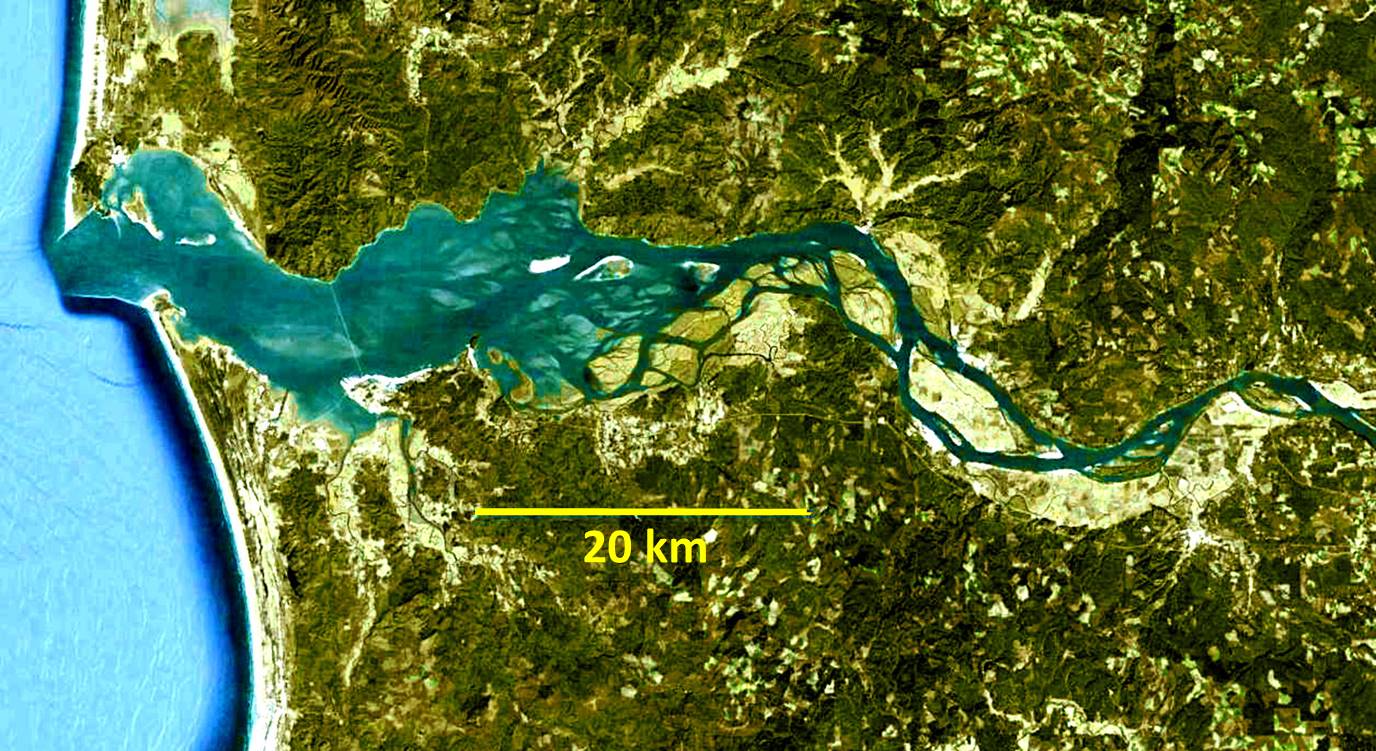
| 16:24, 6 July 2016 | Charente.jpg (file) |  |
249 KB | Dronkers J | Charente estuary | 1 |
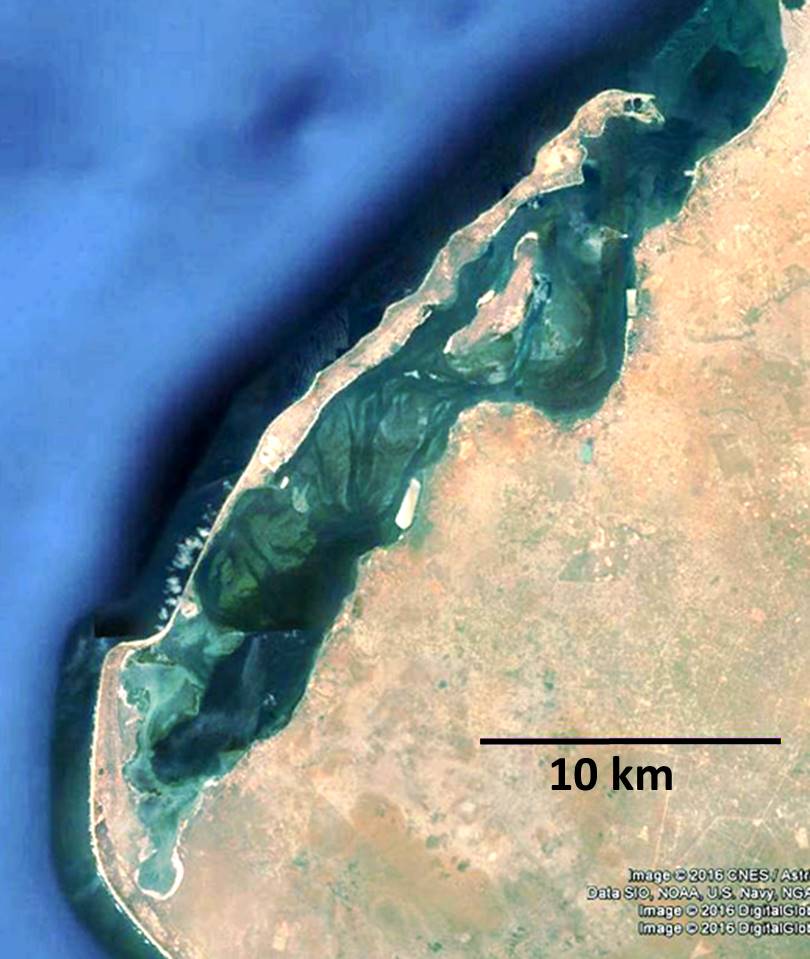
| 16:24, 6 July 2016 | Mussulo.jpg (file) |  |
86 KB | Dronkers J | Mussulo Lagoon | 1 |
| 16:22, 6 July 2016 | Gomso.jpg (file) |  |
217 KB | Dronkers J | Gomso Bay | 1 |
| 16:21, 6 July 2016 | Wadden.jpg (file) |  |
209 KB | Dronkers J | Western Wadden Sea | 1 |
| 16:20, 6 July 2016 | Yellow.jpg (file) |  |
118 KB | Dronkers J | Yellow River delta | 1 |
| 16:20, 6 July 2016 | Ebro.jpg (file) |  |
156 KB | Dronkers J | Ebro delta | 1 |
| 16:18, 6 July 2016 | Senegal.jpg (file) |  |
47 KB | Dronkers J | Senegal River delta | 1 |
| 16:18, 6 July 2016 | Mahakam.jpg (file) |  |
135 KB | Dronkers J | Mahakam River delta | 1 |
| 16:17, 6 July 2016 | Mekong.jpg (file) |  |
233 KB | Dronkers J | Mekong delta | 1 |
| 16:16, 6 July 2016 | Willapa.jpg (file) |  |
151 KB | Dronkers J | Willapa Bay | 1 |
| 16:16, 6 July 2016 | Dyfi.jpg (file) |  |
238 KB | Dronkers J | Dyfi estuary | 1 |
| 16:15, 6 July 2016 | Zambezi.jpg (file) |  |
120 KB | Dronkers J | Zambezi River delta | 1 |
| 16:03, 6 July 2016 | WorldMacroTidalZones.jpg (file) |  |
71 KB | Dronkers J | World map of macrotidal coastal zones | 1 |
| 16:02, 6 July 2016 | WorldCoastalPlains.jpeg (file) |  |
73 KB | Dronkers J | World map of coastal plains | 1 |
| 16:02, 6 July 2016 | EstuaryLocation.jpeg (file) |  |
88 KB | Dronkers J | Location of estuaries discussed in the text on the world map | 1 |
| 16:00, 6 July 2016 | Curonian.jpeg (file) |  |
111 KB | Dronkers J | Curonian Lagoon | 1 |
| 15:59, 6 July 2016 | Hooghly.jpeg (file) |  |
113 KB | Dronkers J | Hooghly estuary | 1 |
| 10:21, 24 May 2016 | DyeExperiment3.jpg (file) |  |
137 KB | Dronkers J | Dye experiment 3. Panel a: Location viewed by the camera. Panels b, c, d, e: dye patch at different tidal phases. | 2 |
| 10:20, 24 May 2016 | DyeExperiment2.jpg (file) |  |
145 KB | Dronkers J | Dye experiment 2. Panel a: Location viewed by the camera. Panels b, c, d: dye patch at different tidal phases. | 2 |
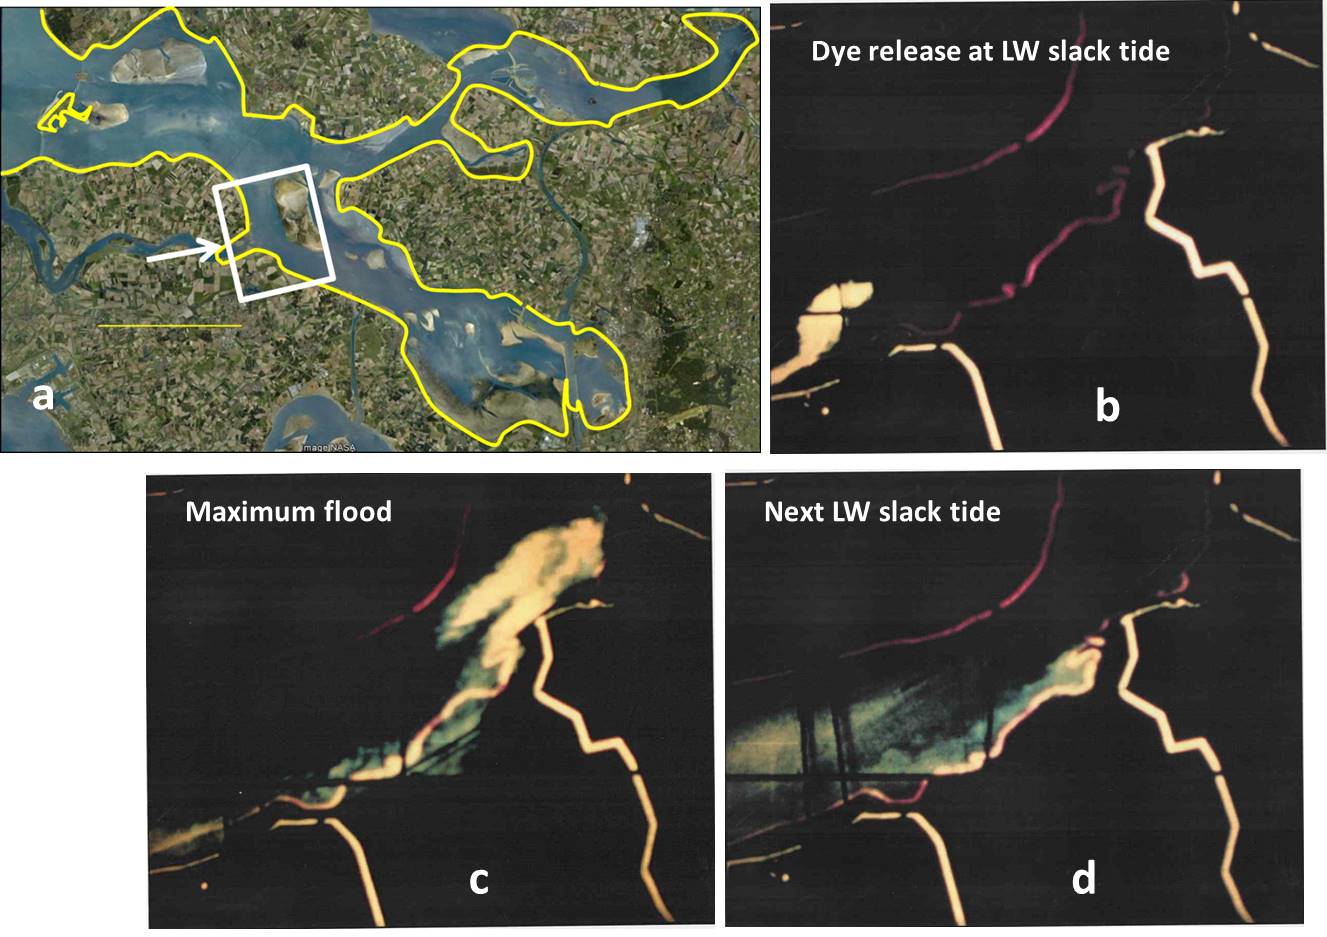
| 10:18, 24 May 2016 | DyeExperiment1.jpg (file) |  |
160 KB | Dronkers J | Dye experiment 1. Panel a: Location viewed by the camera. Panels b, c, d: dye patch at different tidal phases. | 2 |
| 10:16, 24 May 2016 | EasternScheldtMapDepth.jpg (file) |  |
141 KB | Dronkers J | Eastern Scheldt estuary: Map and depth contours. | 2 |
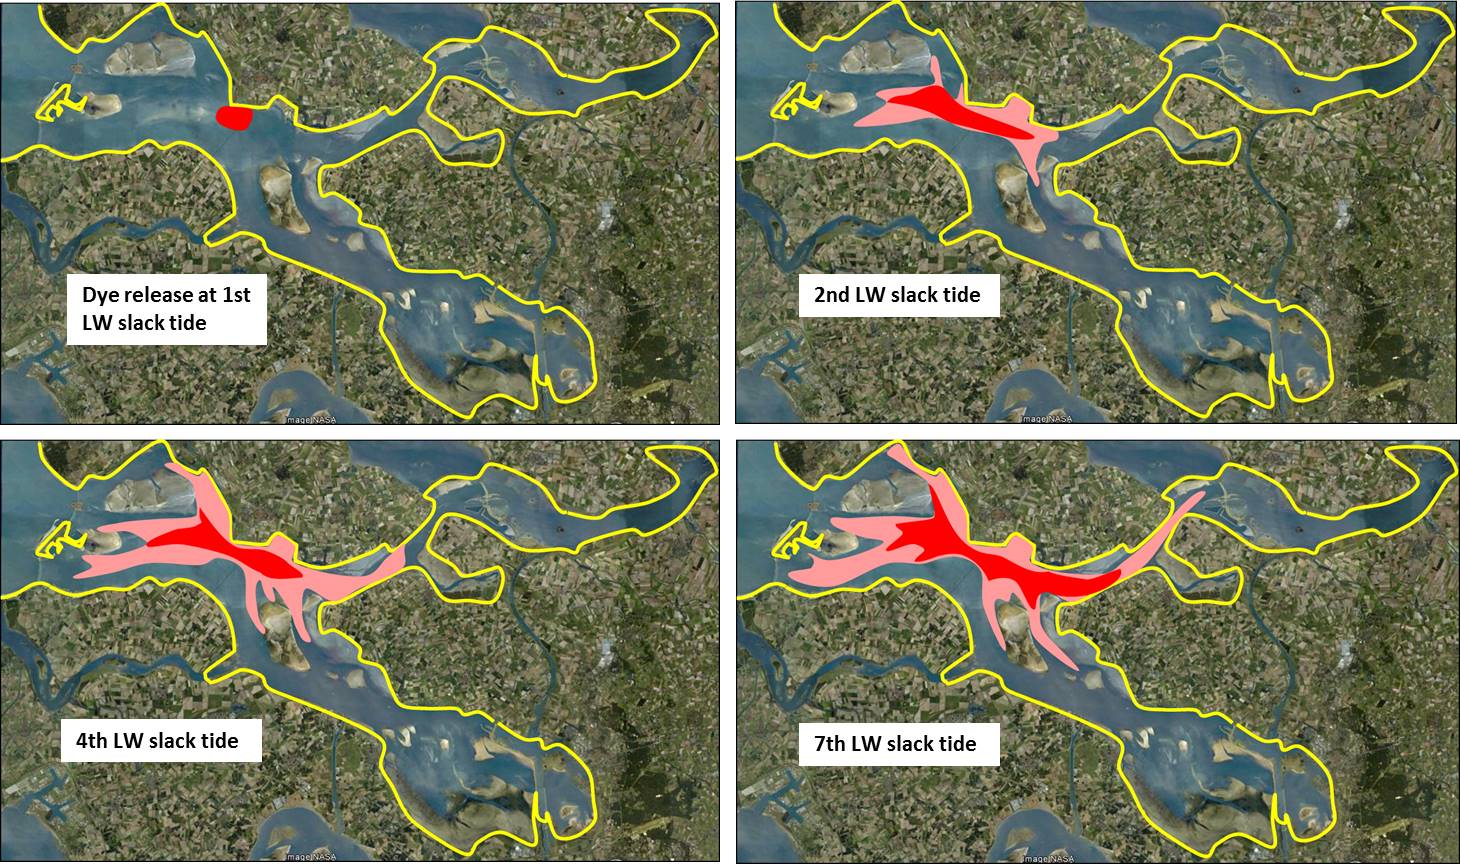
| 09:33, 24 May 2016 | DyeExperiment5.jpg (file) |  |
289 KB | Dronkers J | Dye experiment 5 | 1 |
| 09:33, 24 May 2016 | DyeExperiment4.jpg (file) |  |
165 KB | Dronkers J | Dye experiment 4 | 1 |
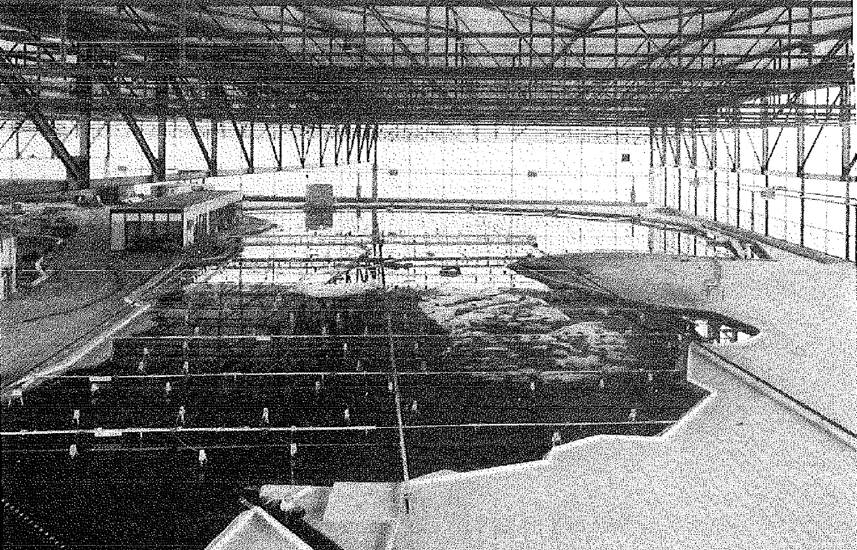
| 09:29, 24 May 2016 | EasternScheldtModelM1000.jpg (file) |  |
187 KB | Dronkers J | Eastern Scheldt hydraulic scale model M1000 | 1 |
| 13:06, 19 May 2016 | RotatingAxesDef.jpg (file) |  |
65 KB | Dronkers J | Definition of x,y,z axes on the rotating earth | 1 |
| 12:52, 19 May 2016 | RotatingAxes.jpg (file) |  |
65 KB | Dronkers J | Definition of x,y,z axes on the rotating earth | 2 |
| 03:21, 15 April 2016 | Coral Ecotox Fig6.jpg (file) |  |
105 KB | Arielmika | 1 | |
| 03:18, 15 April 2016 | Coral Ecotox Fig4-5.jpg (file) |  |
201 KB | Arielmika | 1 | |
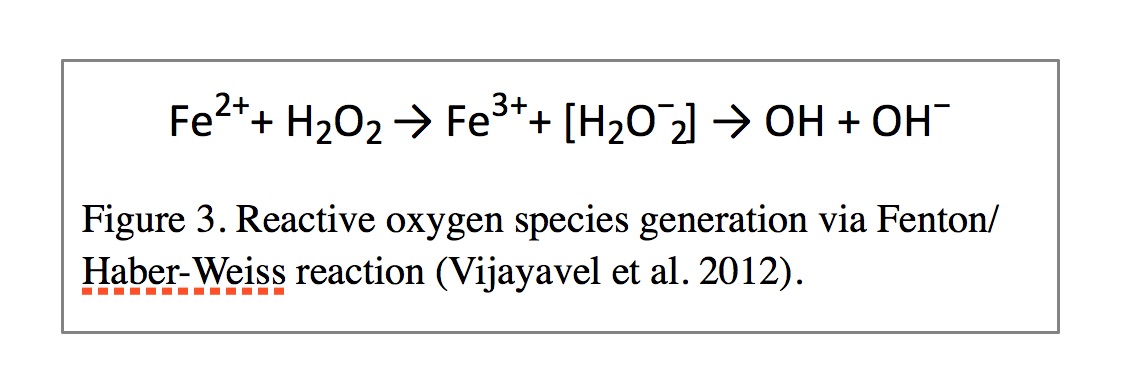
| 03:18, 15 April 2016 | Coral Ecotox Fig3.jpg (file) |  |
69 KB | Arielmika | 1 | |
| 23:42, 14 April 2016 | Coral Ecotox Table6.jpg (file) |  |
472 KB | Arielmika | 1 | |
| 23:30, 14 April 2016 | Coral Ecotox Table3.jpg (file) |  |
219 KB | Arielmika | 1 | |
| 23:29, 14 April 2016 | Coral Ecotox Table4-5.jpg (file) |  |
274 KB | Arielmika | 1 | |
| 23:25, 14 April 2016 | Coral Ecotox FIg2.jpg (file) |  |
108 KB | Arielmika | 1 | |
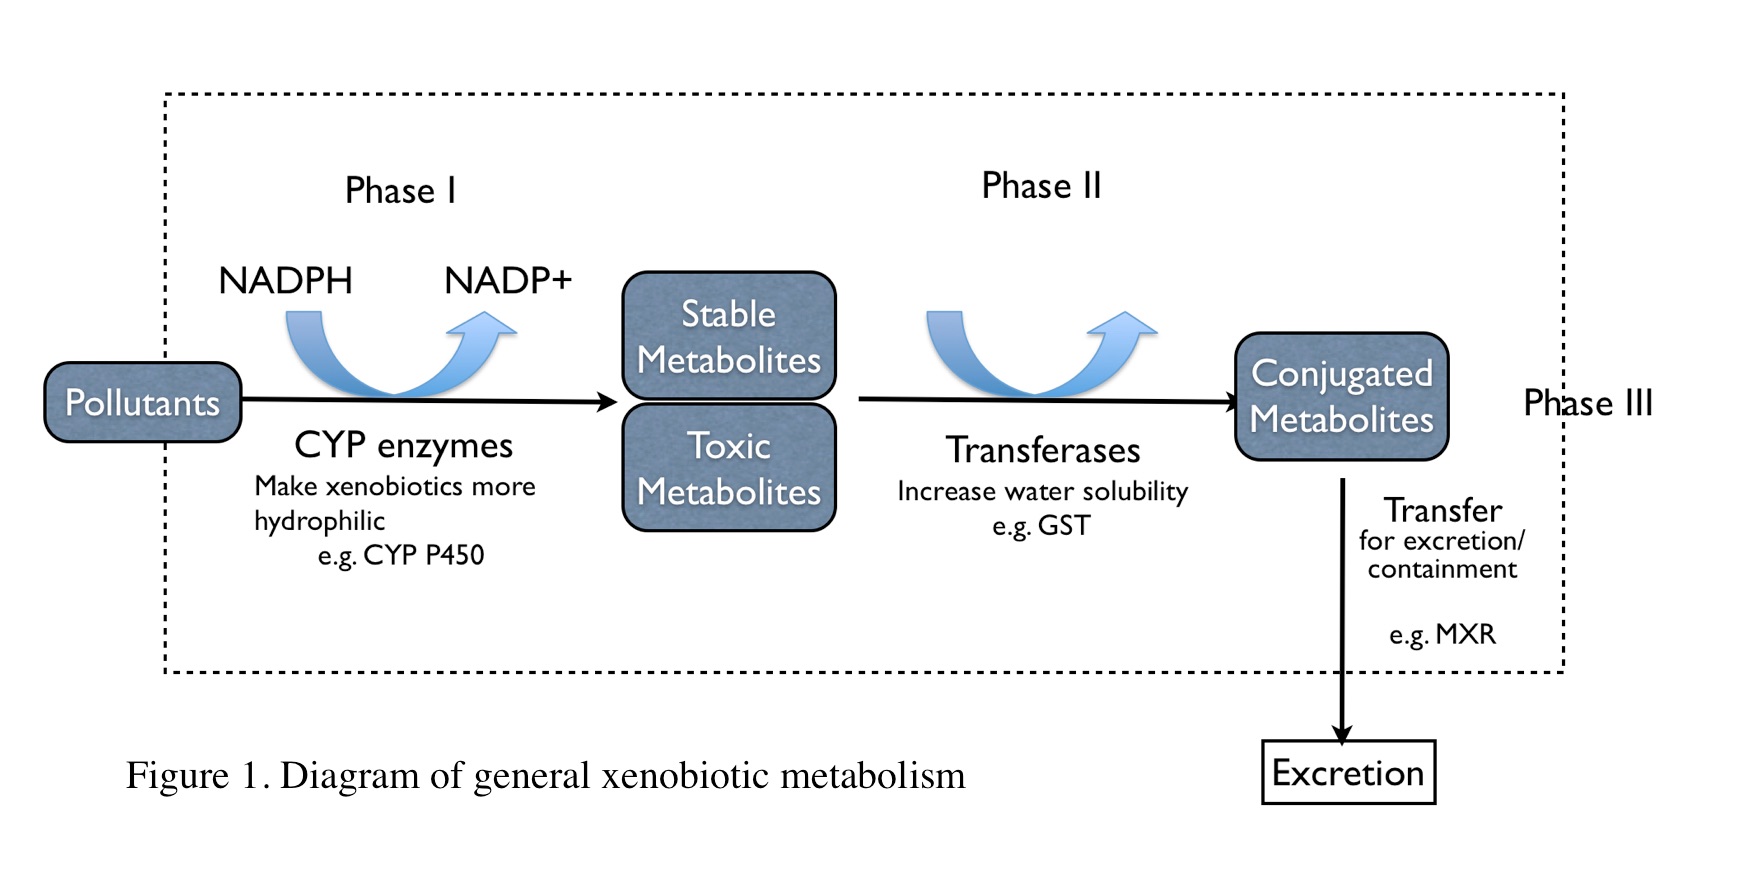
| 23:23, 14 April 2016 | CoralTox Fig1.jpg (file) |  |
166 KB | Arielmika | 1 | |
| 23:21, 14 April 2016 | Coral Ecotox Table2.jpg (file) |  |
249 KB | Arielmika | 1 | |
| 22:25, 14 April 2016 | Coral Ecotoxicology Table1.jpg (file) |  |
250 KB | Arielmika | 1 | |
| 11:34, 12 April 2016 | RdamWaterwayVelSal.jpg (file) |  |
133 KB | Dronkers J | Velocity and salinity distributions in a longitudinal section of Rotterdam Waterway on 9 September 1967 at different tidal phases: at the end of flood tide (H.S.W.=high slack water), during maximum ebb flow, at the end of ebb tide (L.W.S.-low slack wat... | 1 |
| 11:31, 12 April 2016 | VelSalProfiles.jpg (file) |  |
52 KB | Dronkers J | Vertical profiles of estuarine circulation and salinity according to the classical theory. | 1 |
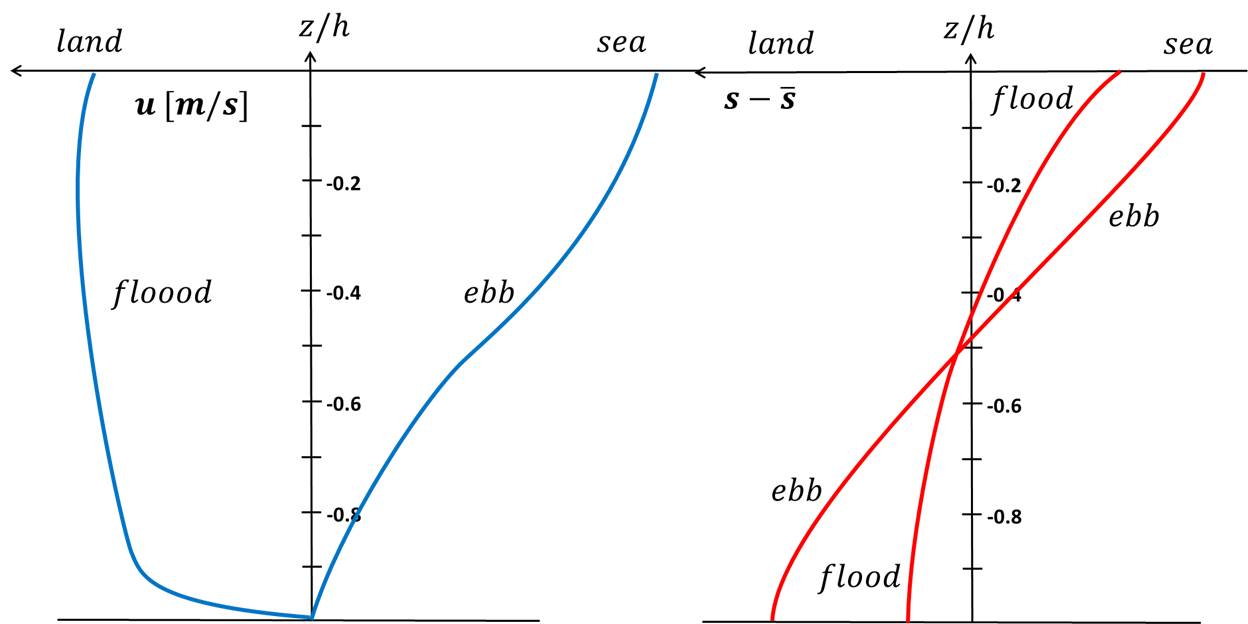
| 11:30, 12 April 2016 | EbbFloodProfiles.jpg (file) |  |
48 KB | Dronkers J | Schematic representation of vertical profiles of salinity and along-channel velocity for flood and ebb. | 1 |
| 11:27, 12 April 2016 | LateralEstCirc.jpg (file) | 29 KB | Dronkers J | Lateral density-driven exchange flow related to cross-channel depth variation. | 1 | |
| 11:26, 12 April 2016 | CoriolisEstCirc.jpg (file) |  |
36 KB | Dronkers J | Influence of earth rotation on estuarine circulation. | 1 |
| 14:43, 8 April 2016 | Compendiumcoastandsea.jpg (file) |  |
73 KB | Daphnisd | 1 | |
| 19:25, 1 April 2016 | SaltWedgeLength.jpg (file) |  |
71 KB | Dronkers J | Dimensionless salt wedge length <math>C_i L / h</math> according to the theory for a prismatic estuary and observed salt wedge lengths in the Rhône and Ebro estuaries at different discharges (corresponding to different internal river Froude numbers <m... | 1 |
| 12:00, 23 March 2016 | TidalEllipse1.jpg (file) |  |
16 KB | Dronkers J | At some distance from the coastal boundaries the tidal current vector describes an ellipse during the tidal cycle. The current vector runs the ellipse in clockwise direction on the northern hemisphere. | 1 |
| 11:53, 23 March 2016 | TidalEllipse.jpg (file) |  |
16 KB | Dronkers J | Reverted to version as of 10:48, 23 March 2016 | 4 |