Coastal ocean satellite altimetry
Contents
Introduction
The advent of the space era signalled a great boost for all geosciences, since scientific observational methods were not limited any more to terrestrial only, but to satellite ones as well. Considering the main advantages of satellite methods we can immediately distinguish their improved observational methods, the dense coverage as well as the repeatability and homogeneity of the data offered for almost the entire planet. The Earth’s oceans cover almost 73% of our planet’s surface, thus the interactions that take place on their surface and interior trigger and direct changes in the environment and the natural and human ecosystem. One of the main goals of space geodetic techniques and of satellite altimetry in particular is the study and observation of the processes and properties of the marine environment, so that when utilizing altimetry data monitoring and studying of phenomena like mean sea level variations and changes, ocean circulation, mass variations and balance, ice transfer, wind speed, storm surges, wave height and water temperature would be feasible. It is easily concluded that coastal zone monitoring and management can be greatly benefited by utilizing the measurement provided by satellite altimetry, since the late offer direct observations of the sea level and of its variations. Altimetric measurements have a vital importance for geosciences, since we are lucky enough to have satellites that provide very accurate and direct measurements of the instantaneous heights of the sea. This is so, since the altimetric observables, the sea surface heights (SSHs), correspond to the separation of the sea surface from the reference ellipsoid and are very close to geoid undulations. Once having these measurements and with proper handling through appropriate procedures one can derive the deviations of the geoid above the ellipsoid and therefore determine a reference equipotential surface useful to geodetic, oceanographic, geological, geodynamic and hydrological studies. The data offered to the scientific community come from different agencies such as the French Archiving, Validation and Interpretation of Satellite Oceanographic data (AVISO), the Centre ERS d’Archivage et de Traitement (CERSAT), the Centrale Nationale d’ Etudes Speciales (CNES), the Collect, Localization, Satellites (CLS) project at the University of Texas, the European Space Agency (ESA), the Jet Propulsion Laboratory (JPL) through its Pathfinder project, the National Aeronautics and Space Administration (NASA) and finally the National Oceanic and Atmospheric Administration (NOAA).
Altimetric satellites and missions
In the following paragraphs we will briefly give some introductory information about the already launched and expected altimetric satellites, together with their characteristics and missions.
Skylab, GEOS-3 and Seasat
The beginning of satellite altimetry, as it was defined in the introductory chapter, originates in the first purely altimetric satellite GEOS-3, which was launched in 1973. Before GEOS-3 there have been a number of satellites with the name Skylab, which conducted some experimental altimetric measurements without this being their primary goal. The Skylab satellites where the first ones to perform altimetric observations and they formed the basis for the first complete altimetry mission with SEASAT.
GEOSAT
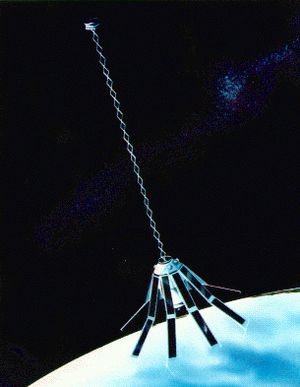
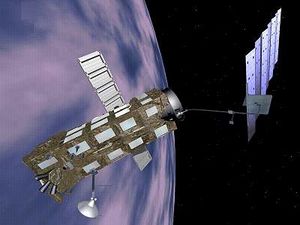
The next satellite launched was the GEOdetic SATellite (GEOSAT), which is considered as the cornerstone of satellite geodesy and satellite oceanography. The satellite’s name, GEOSAT (see Figure 1), indicates its primary mission, i.e., the approximation of the oceanic geoid. GEOSAT was constructed at the Applied Geophysics Laboratory of Johns Hopkins University under the supervision of the U.S. Navy. The satellite was equipped with one altimeter, which measured the distance between the satellite and the instantaneous sea surface (ISS) as well as the wave height and the wind speed.
ERS1/2
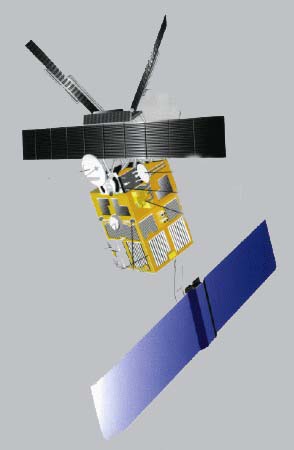
The European Earth Remote-sensing Satellite 1 (ERS1) followed GEOSAT’s mission on July 17, 1991 and was launched by the European Space Agency (ESA) (see Figure 2). The primary goal of ERS1 was to study the oceans, monitor the ice sheet movements, measure the wave height and the ocean surface temperature and determine the wind speed and direction. These are only the altimetric tasks that ERS1 was dedicated to do, since the satellite carried a multitude of scientific instruments for many other different types of experiments. ERS1 was originally scheduled to fly for two years only, but since the altimeter recorder was continuing to operate and the satellite was in good health, its mission continued until 1996 when it was used in a tandem phase for the calibration of its successor ERS2.
TOPEX/POSEIDON, JASON-1 and JASON-2
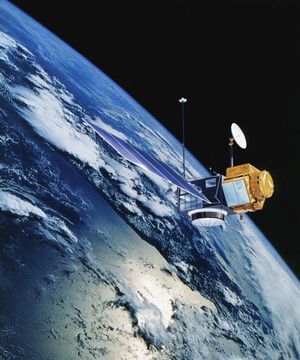
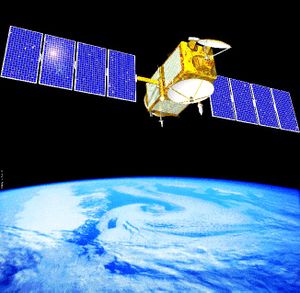
The GEOS-3, SEASAT, GEOSAT and ERS1 missions provided a great amount of data and proved the importance and potentials of the continuous monitoring of the oceans. These facts forced NASA and CNES to combine their efforts in launching a new altimetric satellite, which would provide more accurate observations and longer records of the state of the oceans. The result was the creation and launch of TOPEX/POSEIDON (TOPographic Experiment/POSEIDON) (see Figure 3) that was named after the two on-board altimeters. The TOPEX radar is of double frequency and was built by NASA, while the second one is single frequency and was built by CNES. The satellite was launched in August 10, 1992 and until the last transmission of its data in January 18, 2006 it has completed almost 481 complete cycles around the Earth. This dataset, spanning for almost 10 years, offers the greatest and longest set of repeated observations for the surface of the oceans making possible the study of sea level anomalies (SLA) and mean sea level (MSL) variations, the monitoring of ocean currents like the Gulf Stream and Kuroshio and ultimately meteorological phenomena like El Niño and La Niña.The altimetric mission of JASON-1 (Figure 4) was launched in December 7, 2001 and constitutes the continuation of T/P. The satellite is the result of cooperation between NASA, through its Jet Propulsion Laboratory (JPL), CNES, through AVISO (Archiving, Validation and Interpretation of Satellite Orbit) and CLS (Collect, Localization, Satellites). JASON-1 was the first satellite in a row planned to launch in the next 20 years, all aiming to provide a continuous record of the variability and the state of the Earth’s oceans. JASON-1 is revolving the Earth at an altitude of 1336 km with a 66ο inclination and a period of 112 min. It has already completed 240 complete cycles around the Earth and repeats its orbit track with a horizontal accuracy better than 1 km at the equator. It successor, JASON-2 has been launched in June 20, 2008 and its main goals are to monitor ocean tides, mean sea level change, as well as the ocean circulation and sea level variability in scales longer than ten years, which will result by the combination of its data with those of T/P and JASON-1.
GFO altimetric satellite
After the great success of the altimetric mission of GEOSAT, which is considered as one of the most successful satellites for military and geodetic applications, the U.S. Navy decided to launch its successor called Geosat Follow On (GFO) in February 10, 1998. The satellite repeats the 17.05-day GEOSAT ERM mission, thus providing observations at the exact same tracks as its predecessor did almost 15-years ago.
ENVISAT
ENVISAT (ENVIronmental SATellite) is the successor of ERS1/2 and was launched in March 1, 2002 by the European Space Agency (ESA). The satellite is set in a polar sun-synchronous orbit with an inclination of 98.55o and its life span is scheduled to ten years. It should be noted that ENVISAT is not a purely altimetric satellite, but has a wide variety of instruments in order to monitor many natural processes that take place on the Earth’s surface (monitoring of the atmosphere, the oceans, polar as well as continental areas). So, altimetric measurements are just a component of the entire laboratory aiming to continue the successful record of the ERS1/2 missions.
JASON 3
Launched in January 2016, Jason-3 is the follow-on altimetry mission of Jason-2/OSTM (Ocean Surface Topography Mission). The Jason missions use radar altimetry sensors that measure the time a signal takes to bounce off the ocean surface and return to the satellite, to provide global measurements of sea surface height that are accurate to within a few centimetres. This information, combined with GPS and DORIS measurements of the satellite's location, allows complete global mapping of sea surface height once every 10 days. Jason-3 makes precise measurements related to global sea-surface height. In order to calibrate the radar altimeter, a microwave radiometer measures signal delay caused by atmospheric vapors, ultimately correcting the altimeter's accuracy to 3.3 cm.
SENTINEL 3
The Sentinel satellites 3A and 3B launched in 2016 and 2018 respectively, measure systematically Earth’s sea surface and lake surface topography, land ice, sea-ice and atmosphere, to monitor and understand long term and large-scale global dynamics. Four main instruments are: OLCI: Ocean and Land Colour Instrument; SLSTR: Sea and Land Surface Temperature Radiometer; SRAL: SAR Radar Altimeter; MWR: Microwave Radiometer.
Satellite altimetry principle
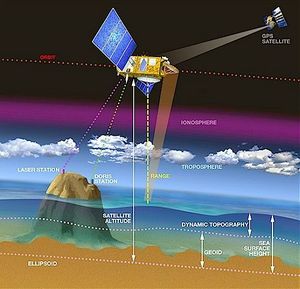
The definition of some basic terms related to satellite altimetry is presented in Figure 6 which depicts a basic altimetric system. As range we define the distance from the satellite centre of mass to the instantaneous sea surface. This is the main measurement that the altimeter provides. As satellite altitude we define the distance between the satellite centre of mass and the reference ellipsoid in the direction of the normal to the ellipsoid. As height or sea surface height (SSH) we define the deviation of the instantaneous sea surface from the reference ellipsoid. This is given as the difference between the altitude and the range. As orbit we define the path that the satellite follows while revolving around the Earth. As revolution we define a complete revolution of the satellite around the Earth. As satellite pass we define the half of a satellite revolution. The satellite passes are distinguished in ascending and descending ones. Ascending passes are those that the satellite goes from South to North (North-going passes) and descending those that the satellite goes from North to South (South-going passes). Finally, as a complete satellite repeat cycle we define the time period until the satellite passes twice from the exact same point. It is obvious that this term is found in ERM phases only.
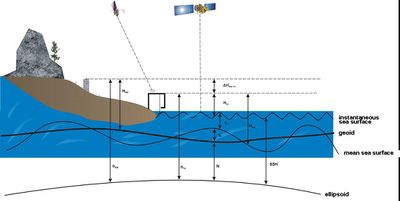
The principle of satellite altimetry (see Figures 6 and 7) is based on the transmission of a radar pulse from the altimeter towards the surface of the Earth along the vertical and its subsequent reflection from the sea surface towards the satellite receiver. The satellite has an accurate on-board time-tagging device, which measures the time needed for the radar pulse to do this two-way trip from the satellite to the sea surface and then back to the satellite receiver. After proper processing and the removal of instrumental and geophysical corrections the distance between the satellite and the ISS is computed, which is called range or instantaneous sea surface topography (ISST). This is computed as half the time that the radar pulse needed to travel from the satellite two the sea surface and then back to the satellite. The distance between the ISS and the mean sea surface (MSS) is called time-varying sea surface topography (TSST) and is denote by ς_t in Figure 7. It is caused by many factors like the earth tides, the ocean currents and meteorological phenomena. For some of these parameters available models have been developed either in a global, regional or local scale. Finally, the distance between the geoid and the MSS is called quasi-stationary sea surface topography (QSST), denoted by ς_c in Figure 7, and originates from various dynamic phenomena in the oceans such as the temperature, the salinity and the dissolved oxygen content. Additionally, it is attributed to the loading of the oceans due to the existence of ocean currents.
Measuring and monitoring coastal zones of a changing planet from space
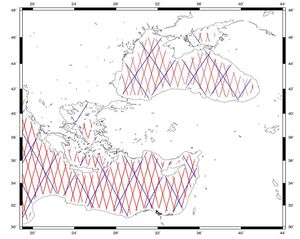
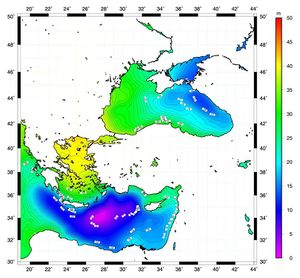
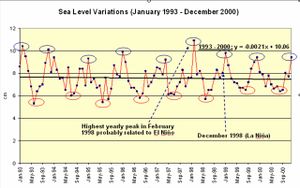
The main products of satellite altimetry techniques useful in monitoring and managing coastal areas refer to models of the mean sea surface, of the bathymetry and of the sea circulation. Mean sea surface (MSS) models are generated by integrating sea surface height measurements from multi-satellite missions, so as to achieve wide-coverage, high-accuracy and high-resolution. In Figure 8 an example of a multi-mission combination setup is presented for the Eastern Mediterranean and Black Seas, where TOPEX/Poseidon (T/P) and ERS1/2 data have been combined for the determination of a MSS model. After various combination schemes have been examined, a model based on Least Squares Collocation has been determined with a spatial resolution of 2 arcmin, in both latitude and longitude, and an accuracy in the order of 4-5 cm (standard deviation – std). The result from this multi-mission combination for MSS determination is presented in Figure 9. Apart from a picture of the mean state of the sea, such models offer a great opportunity to perform studies on the variations of the sea level at least in time-scales that the altimetric data record allow. In the same study (Tziavos et al. 2004)[1], sea level variations relative to the determined MSS model for the period 1993-2001 have been determined for the Aegean Sea. From the results acquired it was determined that a regular seasonal pattern was evident while a significant response to ENSO events like El Niño and La Niña could be spotted in the analysis performed. These variations are depicted in Figure 10, where the seasonal pattern is evident.
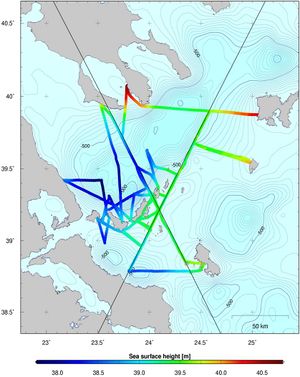
Another opportunity to monitor the sea surface and collect data closer to the coastline where space methods suffer due to the scattering of the radar pulse by the ocean bottom is the so-called marine GPS-measurements. The entire concept is based on the development of enhanced ground-based methods for the precise determination of Sea Surface Heights (SSH), through a system consisting by shipborne multi-antenna GPS measurements (Figure 12) and GPS equipped buoys (Figure 11). The SSH data provide local-scale information on the short-wave structure of the gravity field and can be used to improve local marine geoid solutions, monitor the sea variability especially close to the coastline and determine ocean circulation. They also contain information on the local dynamic ocean topography (DOT) and can be used for the validation and calibration of radar altimeter satellites. In addition, they can provide a link between offshore radar altimeter data and tide-gauge stations.
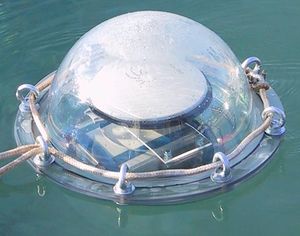
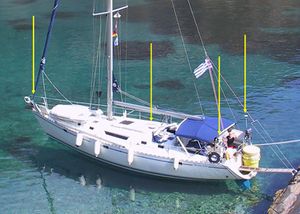
Highly-precise GPS positioning of the buoys and the boat is achieved by simultaneously operating the buoy receivers, the receivers aboard the boat and several permanent terrestrial GPS reference stations, all operated at a sampling rate of 1 Hz. The coordinates of the reference stations are first determined with respect to the ITRF reference frame. The kinematic positions of the buoys and the boat are then determined through differential GPS carrier phase processing with respect to the reference stations. In order to derive the Sea Surface Topography (SST) from the instantaneous SSHs, several corrections have to be applied, especially for tides and atmospheric effects (inverse barometer effect). The tide corrections can be computed using any global tide model, e.g., the GOT00.2 model, while local tidal effects can be determined by using tide gauges installed in the survey area. The inverse barometer corrections can be computed using ECMWF atmospheric pressure data. Such a study has been performed in the Aegean Sea in 2004 and 2005, totalling more than 1000 nm (nautical miles) of ship tracks (Fig. 13). For calibration and validation purposes of radar altimeter missions, the survey area has been chosen in the vicinity of Jason-1 ground-tracks. Dedicated buoy measurements have been performed along these Jason-1 tracks, including deployments with direct Jason-1 crossovers, which provide precise ground-truth SSH information during the overflight. From the description of the method it is evident that measurements can be performed as close to the coastline as one wishes, with the only limitation being the depth of the sea and the height of the sailing boat keel. Of course in case a sail boat’s tender is used, then this depth limit reduces to lets say 20 cm, which practically means that the system is capable of performing measurements in virtually all coastal areas.
A direct consequence of the continuous development of MSS models of the ocean is that they are usually combined with satellite-only Earth Gravity Models (EGMs) to estimate models of the Quasi-Stationary Sea Surface Topography (QSST). The QSST is defined as the semi-constant over large periods of time deviation of the mean sea surface from the geoid. It reaches a maximum of +2.2 m and in closed sea areas has very small variations over large regions. This is why most QSST models developed during the last two decades are usually provided in terms of a spherical harmonics expansion of the QSST to low degrees, e.g., 20 (which corresponds to about 2000 km full wavelength). It can be easily concluded that when the area under study is rather small or is characterised as closed, e.g., the Mediterranean Sea, then such global models are insufficient. Moreover, in areas like the aforementioned the differences between the presently available global QSST models largely exceed the magnitude of the signal under consideration itself. This signals both a significant uncertainty in the available models and a need for the development of reliable and accurate local estimates of the QSST for use in geodetic and oceanographic studies.
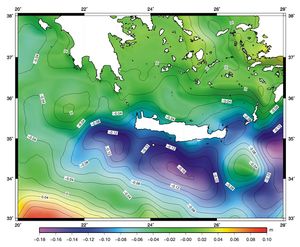
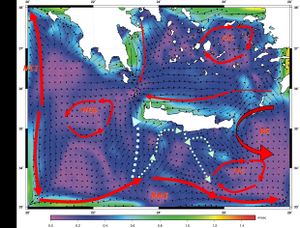
The QSST is needed in geodetic and oceanographic studies for the reduction of the altimetric measurements from the sea surface to the geoid. This is so because the basic measurements of satellite altimeters, the sea surface heights (SSHs), refer to the sea surface and not the geoid itself. Therefore, the reduction of these observations to the geoid is necessary to determine a geoid and not a MSS model. Additionally, shipborne gravity measurements refer to the sea surface as well and need to be free-air reduced to the geoid to be used for the determination of a gravimetric geoid. The quantity needed for this reduction is the QSST, which is the “marine” counterpart of orthometric heights on land. It can be easily concluded that the QSST is significant for the precise and accurate determination of gravity-field related quantities, while local models are highly necessary as well to serve local to regional geoid modelling. Moreover, since the geoid serves as the reference surface for oceanographic measurements, its determination and separation from the MSS is necessary as well. Finally, under the assumption of geostrophic flow, the QSST can be used to determine the direction and magnitude of the ocean currents, with obvious implications to coastal zone management and monitoring since the circulation of the sea has a direct effect in coastal erosion, habitat changes and determines the biodiversity of coastal regions. An example of a QSST model is presented in Figure 14 for the Southern Aegean Sea (Vergos 2006[3], Vergos and Tziavos 2007)[4], while Figure 15 presents the resulting circulation in the area. From Figure 15 we can clearly distinguish some well-known jets in the area like the Mid-Ionian (MIJ) and Mid-Mediterranean ones (Mid-MED Jet), the Western Cretan Gyre (WCG), the Ierapetra Anticyclone (IAC), Rhodes Gyre (RG) and the Cyclades Anticyclone (CAC). Furthermore, South of the island of Crete we can identify a small (in terms of magnitude) jet (dotted lines), which can be either a branch of the Mid-Mediterranean one or a jet by its own. Finally, there is a clear flow from the Aegean Sea (jets J1 and J2) which merge into the Western Cretan Anticyclone and probable “feed” the MIJ.
Near-coastal sea level
In a coastal zone band of about 20 km wide along the coastline, the radar signal reflected from the Earth surface within the satellite footprint is often corrupted by land contamination. The percentage of valid altimetry-based sea level data is around 90% in the open ocean but it regularly drops to less than 10% from 20 km offshore towards the coast. The loss of valid sea level data in the coastal zone caused by land contamination within the radar footprint, leads to distorted waveforms (i.e., magnitude and shape of the radar echo after reflection on the Earth’ surface), compared to the classical step-like waveforms over the open ocean.
An important contribution to improve satellite altimetry in the near-coastal zone is due Passaro et al. (2014[5]) who developed the Adaptive Leading-Edge Subwaveform (ALES) retracker. To retrieve geophysical information from the distorted waveforms, a processing step called 'retracking' has to be performed on the ground. The retracking process consists of fitting a model response to the real waveform. By avoiding echoes from bright targets along the wave trailing edge, the ALES retracker is capable of retrieving more coastal waveforms than the standard processing for the open ocean. As the distance to the coast decreases, the retracked data are in general more noisy. Another editing based on sea level trends has to be applied to delete dubious data in the close vicinity of the coast. Depending on the region, this additional editing enables reaching a variable closest distance to the coast with an average value of 3.5 km. The ALES retracker was validated against tide gauges in the Adriatic Sea and in the Greater Agulhas System for three different missions: Envisat, Jason-1 and Jason-2, showing correlations higher than 0.9 and along-track root-mean-square errors of 0.14-0.53 m.
Using the ALES retracker technique, Cazenave et al. (2022[6]) determined sea level anomalies and associated coastal sea level trends from the Jason-1, 2 and 3 missions from January 2002 to December 2019 at 756 altimetry-based virtual coastal stations located along the coasts of North and South America, Northeast Atlantic, Mediterranean Sea, Africa, North Indian Ocean, Asia and Australia. Sea level anomalies over the period 2002-2019 from altimetry were compared with data from tide gauges close to the altimeter track. To ensure a proper validation, tide gauge records were adjusted for vertical land motions using Global Positioning System (GPS) vertical velocities. Correlations ranged between 0.38 and 0.78. Comparison of coastal trends with along track offshore sea level trends showed no significant difference at 78% of the 756 virtual stations. In the remaining 22%, either a smooth trend increase (7%) or decrease (15%) was observed in the last ~4–5 km to the coast. Decreasing coastal trends dominated, especially in the Asian region and around Australia. Small-scale coastal processes may be responsible for such a behavior.
Historical tide gauges provide invaluable information on coastal sea level change relative to the ground (the quantity of interest for coastal populations). However, long-term tide gauge records are mostly available for mid-latitude regions of the northern hemisphere. Although satellite altimetry only provides absolute sea level change in a geocentric reference frame (unlike tide gauges, altimetry does not measure vertical land motions), this technique allows to estimate climate-related coastal sea level changes with an extended coverage. Hence both tide gauges and altimetry can be considered as fully complementary.
Related articles
References
- ↑ 1.0 1.1 Tziavos IN, Vergos GS, Kotzev V, Pashova L (2004) Mean sea level and sea surface topography studies in the Black Sea and the Aegean. International Association of Geodesy Symposia, Vol. 129, Jekeli C, Bastos L, Fernandes J (eds.), Gravity Geoid and Space Missions 2004, Springer – Verlag Berlin Heidelberg, pp. 254-259.
- ↑ 2.0 2.1 2.2 Müller A, Bürki B, Limpach P, Kahle HG, Grigoriadis VN, Vergos GS, Tziavos IN (2006) Validation of marine geoid models in the North Aegean Sea using satellite altimetry, marine GPS data and astrogeodetic measurements. In: Forsberg R, Kiliçoğlu A (eds) 1st International Symposium of the International Gravity Field Service, Gravity Field of the Earth, General Command of Mapping, Special Issue 18, pp. 90-95.
- ↑ 3.0 3.1 Vergos GS (2006) Study of the Earth’s Gravity Field and Sea Surface Topography in Greece by combining surface data and data from the new satellite missions of CHAMP and GRACE. Doctoral Thesis, Department of Geodesy and Surveying, Aristotle University of Thessaloniki, Greece, January 2006.
- ↑ 4.0 4.1 Vergos GS, Tziavos IN (2007) Determination of the quasi-stationary sea surface topography from a common adjustment of a geodetic and an oceanographic model. In: Forsberg R, Kiliçoğlu A (eds) 1st International Symposium of the International Gravity Field Service, Gravity Field of the Earth, General Command of Mapping, Special Issue 18, pp. 235-241.
- ↑ Passaro, M. Cipollini, P., Vignudelli, S., Quartly, G.D. and Snaith, H.M. 2014. ALES: A multi-mission adaptive subwaveform retracker for coastal and open ocean altimetry. Remote Sensing Environ. 145: 173–189
- ↑ Cazenave, A., Gouzenes, Y., Birol, F., Leger, F., Passaro, M., Calafat, F.M., Shaw, A., Nino, F., Legeais, J.F., Oelsmann, J., Restano, M. and Benveniste, J. 2022. Sea level along the world’s coastlines can be measured by a network of virtual altimetry stations. Commun Earth Environ 3: 1–9
Please note that others may also have edited the contents of this article.
|
